Download to read offline


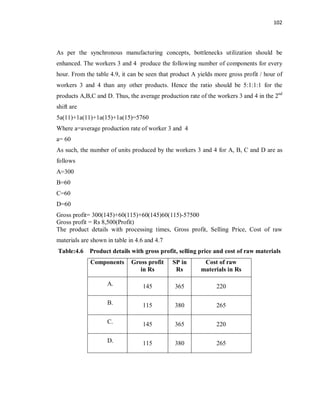
![64
machines and other facilities were remaining idle, due to the procedural limitations in the
system. The movement of tools and materials along the flow were not effective. After a
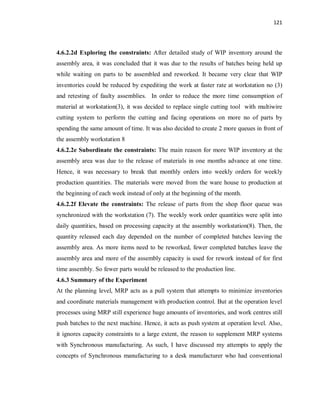
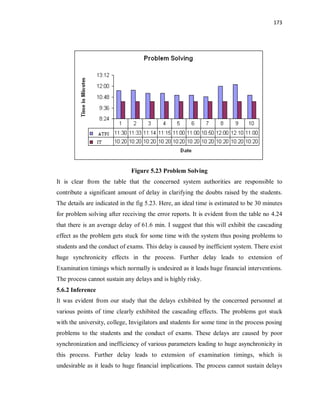
detailed inspection and study, it became clear that the presence of constraint(s) in the
system prevented better performance and increased production outputs. It was evident
from the observation that the different resources were poorly synchronized. At this point
of time, the idea of analyzing the best operation strategies to synchronize and integrate
all related resources in the system was evolved. After a detailed study of different
available operational strategies, SM Philosophy was planned, and implemented at
different scenario in the engineering environment. Under these circumstances, a few
research assignments were planned for implementation at local companies/ factories and
at a few prominent industries in Bangalore region. Thus, an attempt is made here to
critically analyze and to measure the Synchronous parameters under both domains..
3.2 Motivation:
One of the important parameters that affect the productivity is the synchronization of
resources in the production process. The high performance is much anticipated in a
synchronous manufacturing environment. Any management practitioner of Lean or
MRP, assumes that ideal plant is a balanced plant. But a perfectly balanced production
line does not exist in the real world due to line dependencies, variability and disruptions.
Often resources conflict each other and identification becomes challenging. Hence, huge
losses in production occur. On realizing that not all resources are equal, lead us to the
concept of Synchronous Manufacturing. The philosophy of synchronous manufacturing
[as explained] can be approached for continuous profit growths and to measure the
performance of manufacturing operations.
Keeping these points in view, “A Study of synchronous manufacturing practices on vital
resources and constraints in a typical engineering environment.” was considered as a
valuable tactical tool to make manufacturing more efficient. The study describes how the
principles and strategies of synchronous manufacturing could be applied at different
scenario in the engineering environment for the substantial improvement.
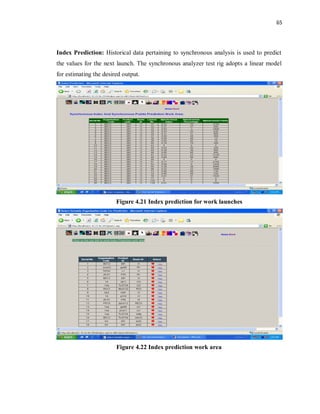
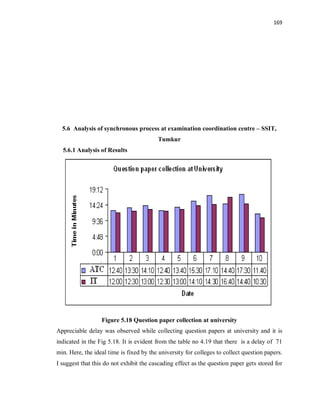
3.3 OBJECTIVES OF THE PRESENT WORK:](https://image.slidesharecdn.com/final-170727133022/85/Final-64-320.jpg)
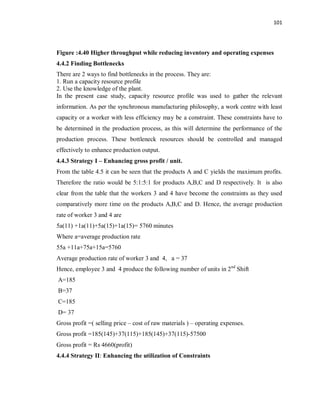
![48
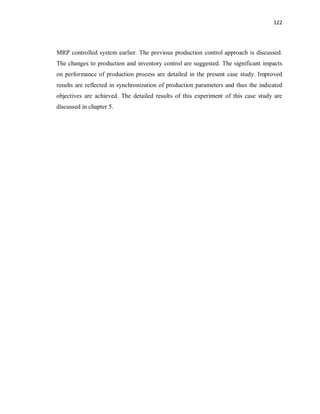
disadvantage is that MRP ignores capacity constraints to a great extent. The idea of this
is extended to synchronous analysis which gives cognizance of the process to an
Industrial engineer.
Incase of JIT, it does an excellent job in reducing lead times and work in process, but has
got several disadvantages.
1. It is limited to repetitive manufacturing
2. It requires a stable production level [usually about a month long].
3. It does not allow much flexibility in the products produced [products must be
similar with a limited number of options].
4. Completed work must be stored on the down stream side of each work station to
be pulled by the next work station.
5. Vendors need to be located nearby because the system depends on smaller, more
frequent delivery.
6. It applies a trial and error procedure to a real system.
MRP schedules [back ward scheduling] production through a bill of materials explosion
in a back ward manner - working backward in time from the desired completion date.
MRP through its capacity resource-planning module, develops capacity utilization
profiles of work centres, as a secondary procedure. When work centres are over loaded,
either the master production schedules must be adjusted or enough slack capacity must be
left unscheduled in the system, so that work can be smoothened at the local level. This is
accomplished by work centre supervisors or the workers themselves. Trying to smooth
capacity using MRP is so difficult and would require so many computer runs to execute
capacity analyses. The capacity over loads and under loads decisions at the machine
centres are best left to local decisions. An MRP schedule becomes invalid in just one day
after it is created due to many practical constraints. Hence analysis with the synchronous
index is applicable at this stage. We can have knowledge built up on a day-to-day basis.
Whenever such an instance of large capacity requirement exists, the average synchronous
index can be used to take up a managerial decision. If there is a variance of synchronous
index, we can take appropriate action to see that the production happens in time, there by](https://image.slidesharecdn.com/final-170727133022/85/Final-68-320.jpg)


1. The document presents a thesis submitted by Ashok Mehatha for the award of a Doctor of Philosophy degree in Mechanical Engineering. 2. It describes a study conducted on synchronous manufacturing practices and their impact on vital resources and constraints in a typical engineering environment. Laboratory and field investigations were carried out to critically analyze and measure synchronous manufacturing parameters. 3. A synchronous manufacturing model is proposed to assess the level of synchronization in any engineering environment. The model aims to identify constraints, minimize them, and analyze synchronicity levels by applying synchronous manufacturing concepts, tools, and strategies. Case studies were conducted at various companies to test the model.


](https://cdn.slidesharecdn.com/ss_thumbnails/a19ad365-545d-4890-a8b6-6d3f609a9304-160529172845-thumbnail.jpg?width=640&height=640&fit=bounds)


