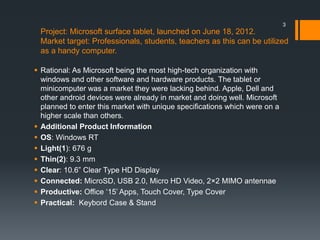
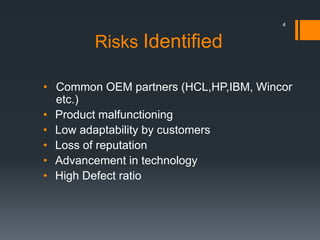
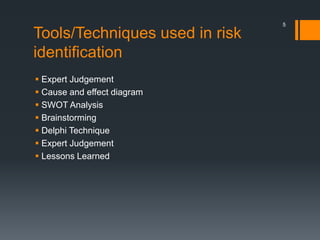
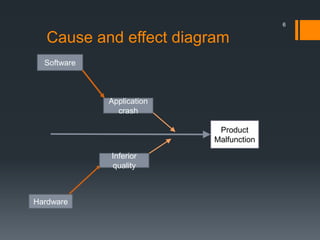
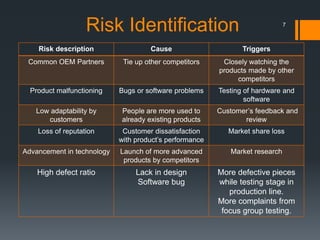
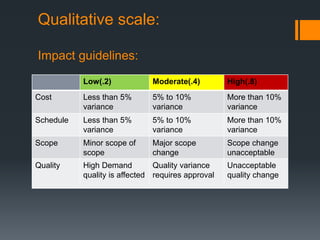
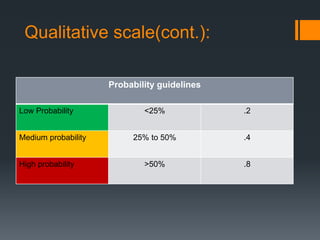
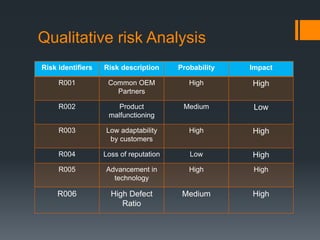
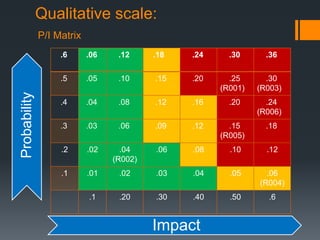
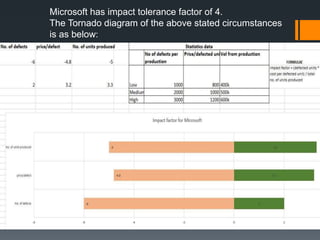
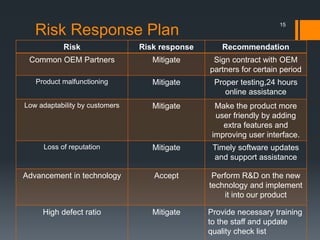
Project Risk
Management
Plan Risk Response
Instructor : Cheryl Francis Nurse
Date: 11.26.2015
Team No : 5
Members : Vishavjit Singh
Prabhpaul Singh Gill
Manpreet Singh Gill
Bikram Jeet
Jaspreet Singh
Agenda
To discuss various risks with respect to our project
Qualitative and quantitative analysis
Tools and techniques used for analysis
Risk response plan
Key takeaway from “PM as a Risk Taker”
2
Project: Microsoft surface tablet, launched on June 18, 2012.
Market target: Professionals, students, teachers as this can be utilized
as a handy computer.
 Rational: As Microsoft being the most high-tech organization with
windows and other software and hardware products. The tablet or
minicomputer was a market they were lacking behind. Apple, Dell and
other android devices were already in market and doing well. Microsoft
planned to enter this market with unique specifications which were on a
higher scale than others.
 Additional Product Information
 OS: Windows RT
 Light(1): 676 g
 Thin(2): 9.3 mm
 Clear: 10.6” Clear Type HD Display
 Connected: MicroSD, USB 2.0, Micro HD Video, 2×2 MIMO antennae
 Productive: Office ‘15’ Apps, Touch Cover, Type Cover
 Practical: Keybord Case & Stand
3
Risks Identified
• Common OEM partners (HCL,HP,IBM, Wincor
etc.)
• Product malfunctioning
• Low adaptability by customers
• Loss of reputation
• Advancement in technology
• High Defect ratio
4
Tools/Techniques used in risk
identification
 Expert Judgement
 Cause and effect diagram
 SWOT Analysis
 Brainstorming
 Delphi Technique
 Expert Judgement
 Lessons Learned
5
Cause and effect diagram
6
Product
Malfunction
Software
Application
crash
Hardware
Inferior
quality
Risk Identification
Risk description Cause Triggers
Common OEM Partners Tie up other competitors Closely watching the
products made by other
competitors
Product malfunctioning Bugs or software problems Testing of hardware and
software
Low adaptability by
customers
People are more used to
already existing products
Customer’s feedback and
review
Loss of reputation Customer dissatisfaction
with product’s performance
Market share loss
Advancement in technology Launch of more advanced
products by competitors
Market research
High defect ratio Lack in design
Software bug
More defective pieces
while testing stage in
production line.
More complaints from
focus group testing.
7
Qualitative scale:
Impact guidelines:
Low(.2) Moderate(.4) High(.8)
Cost Less than 5%
variance
5% to 10%
variance
More than 10%
variance
Schedule Less than 5%
variance
5% to 10%
variance
More than 10%
variance
Scope Minor scope of
scope
Major scope
change
Scope change
unacceptable
Quality High Demand
quality is affected
Quality variance
requires approval
Unacceptable
quality change
Qualitative scale(cont.):
Probability guidelines
Low Probability <25% .2
Medium probability 25% to 50% .4
High probability >50% .8
Qualitative risk Analysis
Risk identifiers Risk description Probability Impact
R001 Common OEM
Partners
High High
R002 Product
malfunctioning
Medium Low
R003 Low adaptability
by customers
High High
R004 Loss of reputation Low High
R005 Advancement in
technology
High High
R006 High Defect
Ratio
Medium High
Qualitative scale:
.6 .06 .12 .18 .24 .30 .36
.5 .05 .10 .15 .20 .25
(R001)
.30
(R003)
.4 .04 .08 .12 .16 .20 .24
(R006)
.3 .03 .06 .09 .12 .15
(R005)
.18
.2 .02 .04
(R002)
.06 .08 .10 .12
.1 .01 .02 .03 .04 .05 .06
(R004)
.1 .20 .30 .40 .50 .6
Probability
Impact
P/I Matrix
Quantitative Risk Analysis:
“As the name might suggest, this is
quantifying (assigning a value =
quantity) the ranked risks often done
in terms of time or cost”
Qualitative and Quantitative Risk Analysis - PMP Primer. (n.d.). Retrieved November 26,
2015, from http://www.pm-primer.com/pmbok-qualitative-and-quantitative-risk-analysis
12
Example
 Let us take an example of a risk “defects in production line”
 From the conversation of the testing team we get to know
that the range of defects may vary from 1000, 2000 and
sometimes 3000. The information obtained from the
production manager says the number of units produced vary
from 400k, 500k and sometimes 600k. And the finance
department calculated that the cost of defective piece
depends on various factors and may vary from $1000,
$2000 and sometimes it may be even $3000.
 Microsoft has an organizational formula of calculating the
impact of defected units i.e.
Impact factor = (defected units * cost per defected unit) / total
no. of units produced
13
Microsoft has impact tolerance factor of 4.
The Tornado diagram of the above stated circumstances
is as below:
Risk Response Plan
Risk Risk response Recommendation
Common OEM Partners Mitigate Sign contract with OEM
partners for certain period
Product malfunctioning Mitigate Proper testing,24 hours
online assistance
Low adaptability by customers Mitigate Make the product more
user friendly by adding
extra features and
improving user interface.
Loss of reputation Mitigate Timely software updates
and support assistance
Advancement in technology Accept Perform R&D on the new
technology and implement
it into our product
High defect ratio Mitigate Provide necessary training
to the staff and update
quality check list
15
Key Takeaways
 Rationale for taking a risk
 To make an effective decision in risk environment, one must
objectively evaluate the factors associated with risks.
1. Identify the risks
2. Define the potential rewards
3. Assess the chance of probability of success.
4. Assess the chance of probability of failure.
5. Establish a remedy(Contingency Plan) and estimate its cost.
 In a risk environment, there is always uncertainty while making a
decision irrespective of the size of project, risk always exist.
 Quantitative analysis of risk must be done by using analytical
techniques which deals with risk and uncertainty.
16
Conclusion
Risks are integral part of every project. Qualitative and
quantitative risk analysis is very important to find out the
impact and probability of the risks associated with the
project. This will not help us to analyze the risk but also
be prepared for any surprises, which could drag our
project and company back.
This project being a crucial project for the Organization.
Risk Management plan will save millions of dollars as
this will help us to be prepared for any unforeseen.
Assumptions
Microsoft will Sign contract with OEM
partners
 Resistance to change.
Innovative ideas of competitors
Surface with new techs introduced will
affect the market in a positive manner.
The Data attained for the tornado analysis
is attained from the respective department.
References
1. Qualitative and Quantitative Risk Analysis - PMP Primer.
(n.d.). Retrieved November 26, 2015, from http://www.pm-
primer.com/pmbok-qualitative-and-quantitative-risk-
analysis
19
Thank You
20

final (2)

  • 1.
    Project Risk Management Plan RiskResponse Instructor : Cheryl Francis Nurse Date: 11.26.2015 Team No : 5 Members : Vishavjit Singh Prabhpaul Singh Gill Manpreet Singh Gill Bikram Jeet Jaspreet Singh
  • 2.
    Agenda To discuss variousrisks with respect to our project Qualitative and quantitative analysis Tools and techniques used for analysis Risk response plan Key takeaway from “PM as a Risk Taker” 2
  • 3.
    Project: Microsoft surfacetablet, launched on June 18, 2012. Market target: Professionals, students, teachers as this can be utilized as a handy computer.  Rational: As Microsoft being the most high-tech organization with windows and other software and hardware products. The tablet or minicomputer was a market they were lacking behind. Apple, Dell and other android devices were already in market and doing well. Microsoft planned to enter this market with unique specifications which were on a higher scale than others.  Additional Product Information  OS: Windows RT  Light(1): 676 g  Thin(2): 9.3 mm  Clear: 10.6” Clear Type HD Display  Connected: MicroSD, USB 2.0, Micro HD Video, 2×2 MIMO antennae  Productive: Office ‘15’ Apps, Touch Cover, Type Cover  Practical: Keybord Case & Stand 3
  • 4.
    Risks Identified • CommonOEM partners (HCL,HP,IBM, Wincor etc.) • Product malfunctioning • Low adaptability by customers • Loss of reputation • Advancement in technology • High Defect ratio 4
  • 5.
    Tools/Techniques used inrisk identification  Expert Judgement  Cause and effect diagram  SWOT Analysis  Brainstorming  Delphi Technique  Expert Judgement  Lessons Learned 5
  • 6.
    Cause and effectdiagram 6 Product Malfunction Software Application crash Hardware Inferior quality
  • 7.
    Risk Identification Risk descriptionCause Triggers Common OEM Partners Tie up other competitors Closely watching the products made by other competitors Product malfunctioning Bugs or software problems Testing of hardware and software Low adaptability by customers People are more used to already existing products Customer’s feedback and review Loss of reputation Customer dissatisfaction with product’s performance Market share loss Advancement in technology Launch of more advanced products by competitors Market research High defect ratio Lack in design Software bug More defective pieces while testing stage in production line. More complaints from focus group testing. 7
  • 8.
    Qualitative scale: Impact guidelines: Low(.2)Moderate(.4) High(.8) Cost Less than 5% variance 5% to 10% variance More than 10% variance Schedule Less than 5% variance 5% to 10% variance More than 10% variance Scope Minor scope of scope Major scope change Scope change unacceptable Quality High Demand quality is affected Quality variance requires approval Unacceptable quality change
  • 9.
    Qualitative scale(cont.): Probability guidelines LowProbability <25% .2 Medium probability 25% to 50% .4 High probability >50% .8
  • 10.
    Qualitative risk Analysis Riskidentifiers Risk description Probability Impact R001 Common OEM Partners High High R002 Product malfunctioning Medium Low R003 Low adaptability by customers High High R004 Loss of reputation Low High R005 Advancement in technology High High R006 High Defect Ratio Medium High
  • 11.
    Qualitative scale: .6 .06.12 .18 .24 .30 .36 .5 .05 .10 .15 .20 .25 (R001) .30 (R003) .4 .04 .08 .12 .16 .20 .24 (R006) .3 .03 .06 .09 .12 .15 (R005) .18 .2 .02 .04 (R002) .06 .08 .10 .12 .1 .01 .02 .03 .04 .05 .06 (R004) .1 .20 .30 .40 .50 .6 Probability Impact P/I Matrix
  • 12.
    Quantitative Risk Analysis: “Asthe name might suggest, this is quantifying (assigning a value = quantity) the ranked risks often done in terms of time or cost” Qualitative and Quantitative Risk Analysis - PMP Primer. (n.d.). Retrieved November 26, 2015, from http://www.pm-primer.com/pmbok-qualitative-and-quantitative-risk-analysis 12
  • 13.
    Example  Let ustake an example of a risk “defects in production line”  From the conversation of the testing team we get to know that the range of defects may vary from 1000, 2000 and sometimes 3000. The information obtained from the production manager says the number of units produced vary from 400k, 500k and sometimes 600k. And the finance department calculated that the cost of defective piece depends on various factors and may vary from $1000, $2000 and sometimes it may be even $3000.  Microsoft has an organizational formula of calculating the impact of defected units i.e. Impact factor = (defected units * cost per defected unit) / total no. of units produced 13
  • 14.
    Microsoft has impacttolerance factor of 4. The Tornado diagram of the above stated circumstances is as below:
  • 15.
    Risk Response Plan RiskRisk response Recommendation Common OEM Partners Mitigate Sign contract with OEM partners for certain period Product malfunctioning Mitigate Proper testing,24 hours online assistance Low adaptability by customers Mitigate Make the product more user friendly by adding extra features and improving user interface. Loss of reputation Mitigate Timely software updates and support assistance Advancement in technology Accept Perform R&D on the new technology and implement it into our product High defect ratio Mitigate Provide necessary training to the staff and update quality check list 15
  • 16.
    Key Takeaways  Rationalefor taking a risk  To make an effective decision in risk environment, one must objectively evaluate the factors associated with risks. 1. Identify the risks 2. Define the potential rewards 3. Assess the chance of probability of success. 4. Assess the chance of probability of failure. 5. Establish a remedy(Contingency Plan) and estimate its cost.  In a risk environment, there is always uncertainty while making a decision irrespective of the size of project, risk always exist.  Quantitative analysis of risk must be done by using analytical techniques which deals with risk and uncertainty. 16
  • 17.
    Conclusion Risks are integralpart of every project. Qualitative and quantitative risk analysis is very important to find out the impact and probability of the risks associated with the project. This will not help us to analyze the risk but also be prepared for any surprises, which could drag our project and company back. This project being a crucial project for the Organization. Risk Management plan will save millions of dollars as this will help us to be prepared for any unforeseen.
  • 18.
    Assumptions Microsoft will Signcontract with OEM partners  Resistance to change. Innovative ideas of competitors Surface with new techs introduced will affect the market in a positive manner. The Data attained for the tornado analysis is attained from the respective department.
  • 19.
    References 1. Qualitative andQuantitative Risk Analysis - PMP Primer. (n.d.). Retrieved November 26, 2015, from http://www.pm- primer.com/pmbok-qualitative-and-quantitative-risk- analysis 19
  • 20.