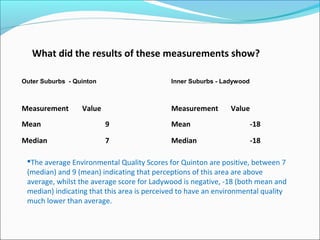
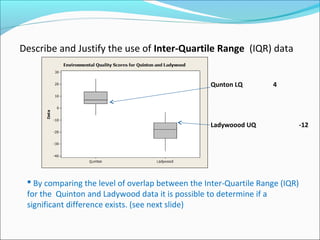
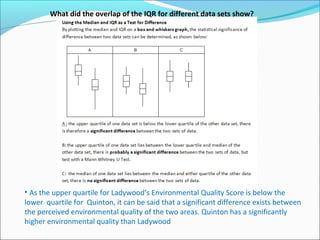
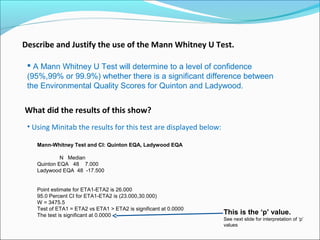
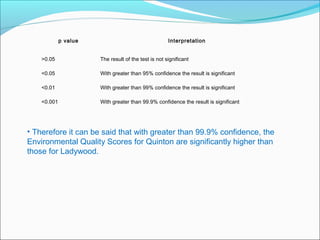
2. Primary Data
Environmental Quality Assessment
Describe and justify how you used measurements of Central Tendency
(averages) to analyse your data.
Using Excel measurements of mean and median Environmental Quality
Scores were calculated (see next slide)
These measurement provide a typical Environmental Quality Score value
for each location and can be used as an initial comparison point
3. Outer Suburbs - Quinton Inner Suburbs - Ladywood
Measurement Value Measurement Value
Mean 9 Mean -18
Median 7 Median -18
What did the results of these measurements show?
The average Environmental Quality Scores for Quinton are positive, between 7
(median) and 9 (mean) indicating that perceptions of this area are above
average, whilst the average score for Ladywood is negative, -18 (both mean and
median) indicating that this area is perceived to have an environmental quality
much lower than average.
5. • As the upper quartile for Ladywood’s Environmental Quality Score is below the
lower quartile for Quinton, it can be said that a significant difference exists between
the perceived environmental quality of the two areas. Quinton has a significantly
higher environmental quality than Ladywood
What did the overlap of the IQR for different data sets show?
6. Describe and Justify the use of the Mann Whitney U Test.
A Mann Whitney U Test will determine to a level of confidence
(95%,99% or 99.9%) whether there is a significant difference between
the Environmental Quality Scores for Quinton and Ladywood.
What did the results of this show?
• Using Minitab the results for this test are displayed below:
Mann-Whitney Test and CI: Quinton EQA, Ladywood EQA
N Median
Quinton EQA 48 7.000
Ladywood EQA 48 -17.500
Point estimate for ETA1-ETA2 is 26.000
95.0 Percent CI for ETA1-ETA2 is (23.000,30.000)
W = 3475.5
Test of ETA1 = ETA2 vs ETA1 > ETA2 is significant at 0.0000
The test is significant at 0.0000 This is the ‘p’ value.
See next slide for interpretation of ‘p’
values
7. p value Interpretation
>0.05 The result of the test is not significant
<0.05 With greater than 95% confidence the result is significant
<0.01 With greater than 99% confidence the result is significant
<0.001 With greater than 99.9% confidence the result is significant
• Therefore it can be said that with greater than 99.9% confidence, the
Environmental Quality Scores for Quinton are significantly higher than
those for Ladywood.
8. Census Data
Summarise what the bar charts showed in terms of socio-economic indicators?
• For all of the indicators of wealth
- Owner Occupied
- 2 or more cars
- Employed
- Mngmnt/ Prof occupations
Quinton has a higher % than
Ladywood and in most cases the
average for Birmingham
• For all of the indicators of deprivation
- Social rented
- 0 cars
- Unemployed
- No Qualifications
Ladywood has a higher % than Quinton
and in most cases the average for
Birmingham
9. Police Crime Data
Describe and justify how you used measurements of Central Tendency ( averages) to analyse your data.
What did the results of these measurements show?
Describe and Justify the use of Inter-Quartile Range (IQR) data.
What did the overlap of the IQR for different data sets show?
Describe and Justify the use of the Mann Whitney U Test.
What did the results of this show?
YOU need to do this bit on your own!!
Use Minitab to complete the Mann Whitney U Test –
see next slides for help
Great!
I love doing statistics