يستعرض هذا الملف المبادئ الأساسية لجيولوجيا الحقل، بما في ذلك طرق رسم الخرائط الجيولوجية، تقنيات القياس في الحقل، السلامة أثناء العمل الجيولوجي، واستخدام الأدوات مثل البوصلة الجيولوجية ونظام تحديد المواقع GPS. كما يتناول أساليب جمع العينات وتحليلها.
It isa guide to what to do in the field to collect the evidence
from which geological conclusions can be drawn.
What those conclusions are is up to you, but bear in mind
what the geologist Lord Oxburgh has said; that making a
geological map is one of the most intellectually challenging
tasks in academia (Dixon 1999).
Course Object
3.
Concerns with observations,representations,
measurements and reporting the geologic work in
the field
Field Geology
4.
Scale: There aremany kinds of geological
map, from small‐scale reconnaissance surveys
to large‐scale detailed underground mine
maps and engineering site plans, and each
needs a different technique to make.
Field Geology
5.
Limit:
The intentionis to provide basic knowledge which can be
built upon.
We cannot tell you everything you need to know but we hope
we can stimulate your imagination so that you can adapt your
methods to most prevailing field conditions and to the scale
and quality of your topographic base maps and, where
necessary, to develop and devise new methods of your own.
Field Geology
6.
The Base: Thebasic geology still must come first – and if it is
wrong, everything that follows will probably be wrong.’
Field Geology
8.
1‐ describes theequipment you will need
2‐ introduced to the many types of geological map
3‐ Methods to locate yourself on a map
4‐ methods and techniques used in geological mapping,
including a brief description of photogeology; that is the use
of aerial photographs in interpreting geology on the ground.
5‐ office work’, methods of drawing cross‐sections and the
preparation of other diagrams to help your geological
interpretation.
6‐ a report is also needed to explain the geological history of the
area and the sequence of geological events
Topics
9.
Geologists spendmuch of their time in the open air and more
often than not their work takes them to the less inhabited
parts of a country.
Always ask permission to enter land from the owners, their
agents or other authorities;
* Take only what you need
• Experience
• Fit
• Adopted
• Cleverness
• skills
Field Geologist
10.
A geologistmust be fit if he is to do a full day’s work in the
field, perhaps in mountainous country, in poor weather, or in
a difficult climate, either hot or cold. Always ask permission
to enter land from the owners, their agents or other
authorities;
many risks can be minimized by following fairly simple rules
of behavior
Experience is the best teacher but common sense is a good
substitute.
Field Safety
11.
A brief listof dos and don’ts for the field is given below:
1. Do not run down hills.
2. Do not climb rock faces unless it is essential to do so, and then
only if you are a trained climber and you have a friend
present.
3. Do not enter old mine workings or cave systems except by
arrangement, and then always in company. Use proper
lighting, headgear and clothing and ensure that someone
knows where you are.
4. Always work in pairs or in close association in rugged
mountains and wear easily visible clothing.
5. Do not hammer close to other people.
6. Whenever possible note the weather forecast before going
into the field
7. If you are lost in mountains or on moors in clear weather,
follow the drainage
Field Safety
12.
Geologists needa number of items for the field. A hammer
(sometimes two) is essential and some chisels. Also essential
are a compass, clinometer, pocket steel tape, and a hand lens,
plus a map case, notebook, map scales, protractor, pencils
and eraser, an acid bottle and a jack‐knife.
A camera is a must and a small pair of binoculars can be most
useful at times, as is a GPS instrument if it can be afforded.
If using aerial photographs you will need a pocket
stereoscope
Geologists must also wear appropriate clothing and footwear
for the field if they are to work efficiently, often in wet cold
weather
Field Equipments
13.
The following isa list of field equipment. Checking it before leaving your home base for the field
will save you from the embarrassment of arriving in the field lacking essential items.
Mapping equipment
Rucksack
Map case
Pencils for plotting
Coloured pencils
Scales
Protractors (half‐round, 15 cm dia, and 10 cm spares)
Pencil case (for belt or attached to map case)
Hammers (with spare shafts and wedges)
Chisels
Belt and hammer frog
Pocket tape
Long tape (30 m)
String or cord
Field acid bottle; spare acid
Compass/clinometer/hand‐level
Camera, lenshood and tripod
Filters (especially UV)
Flash equipment
Films
Binoculars
GPS instrument
Handlens and spares
Notebooks
Pocket stereoscope
Protective goggles
Safety helmet
Field Equipments
Drawing, plotting, ‘office’equipment
Maps (road, district, etc.)
Maps for plotting on
Aerial photographs
Handbooks (local geology, etc.)
Reference manuals
Permatrace, Mylar, tracing film, tracing paper
Squared paper
Stereonets
Probability paper
Pocket calculator
Drafting tape
Black waterproof ink
Coloured inks
Mapping pens (for very fine work)
Stylus type pens (black/colours)
Field Equipments
16.
Paperwork
Passport; must haveat least six months to run, otherwise, most countries will
not grant entry, nor will airlines accept you
Visas
Vaccination/inoculation certificates
Driving licence
International driving permit
‘Green card’ insurance
Car spares
Tickets
Foreign currency
Traveller’s cheques
Cards: cheque, Visa, Amex, etc.
Any authorisations, work permits
Foreign dictionary/phrase book
Field Equipments
Angles and Determinationof Direction
• Bearings and Azimuths
• Bearing of a line is the acute horizontal angle between a
reference meridian (North and South) and a line
• Azimuth of a line is the horizontal angle measured from the
North meridian clockwise to the line
23.
Brunton Compass
• Acompass is an instrument that is used for navigation and
mapping because it measures the geographic direction between
two points. It is a fairly simple instrument that uses a magnet,
mounted on a pivot that turns in response to the earth’s
magnetic field, to determine direction (but not position). The
magnetic needle points to the magnetic North Pole, which is
different from geographic North Pole.
• A compass bearing, which is typically expressed as an angle
(degrees), refers to the horizontal direction to or from any point.
The term “bearing” is used interchangeably with the term
“azimuth.”
24.
Brunton Compass
In thischapter you will learn about:
• Parts of a compass
• Tips on getting accurate compass readings
• Adjusting a compass for magnetic declination
• Orienting a compass
• Taking bearings (direct and back)
• Estimating slope with clinometer
• Computing vertical elevation
• Measuring Strike, Dip, trend and plunge
25.
Brunton Compass
• Geologistsmost commonly use a compass to determine
direction in the field. Three basic types are now routinely used:
Transit (e.g. Brunton), Stratum (e.g. GeoBrunton, Breipthaupt,
Freiberg), or Silva type.
• The variety of compasses in use can be perplexing at first. Each
type has features that are advantageous for specific types of
work: for example the transit compass for surveying; the
stratum compass for rapid and accurate collection of
structural data.
Brunton Compass
Brunton Compasscan uses as three basic instrument:
1. compass- measuring magnetic bearing
2. clinometer- measuring vertical inclination of planes
3. hand level- sights for line surveying
Methods of Measure
a. sighting
b. direct measure
28.
Parts of BruntonCompass
Parts of a Compass
1) clinometer level = use for taking vertical angles
(2) bullseye level = use for taking compass readings
(3) graduated circle
(4) compass needle
(5) sighting arm
(6) sighting window
(7) declination adjusting screw
(8) lid with mirror
(9) lift pin/needle brake
Compass Mastery
• LocateNorth, Set local declination
• Measure Bearings
• Measure Vertical Angles
• measuring height / thickness of a feature
• Measure Strike and Dip of planes
• Measure Trend and Plunge of lines
31.
Tips on GettingAccurate Compass Readings
A small error when using a compass can result in a significant error in measurement on the ground. To
obtain accurate readings when using a compass:
• Hold the compass level and steady so the needle swings freely.
• Hold the compass about waist high in front of the body, except when using a compass with a
sighting mirror or a sighting type compass.
• Raise and lower eyes when taking a bearing, do not move your head. Always use the same eye
when taking bearings.
• Directly face object that is being measured.
• Magnetic fields will give incorrect compass readings. Avoid taking readings near magnetic fields
such as steel, iron (ferrous metals), vehicles, rebar, and clipboards. Even belt buckles, glasses, and
rings can interfere with the compass reading.
• Take bearing twice.
• Adjust for magnetic declination as appropriate.
• Follow the direction of travel arrow, not the compass needle, when walking a bearing. Always
follow the line indicated by the compass rather than relying on judgment as to the direction.
• Use back bearings to ensure you are on track when navigating.
32.
Adjusting a Compassfor Magnetic Declination
Magnetic Declination
The Earth is completely surrounded by a magnetic field, and an unobstructed magnetized object will
orient itself with the earth’s magnetic north and south poles. Magnetic declination (variation) is the
difference between true geographic north (north pole) and magnetic north, with respect to your
position. It is important to note magnetic declination at your position, because magnetic declination
varies and fluctuate slowly at different rates, around the world.
Adjusting a Compassfor Magnetic Declination
• Example: If magnetic declination at your position is 15° east, then magnetic north is 15° east of
true geographic north. Figure 8 displays true geographic north and magnetic north, as indicated
in the legends of USGS and BLM maps.
• To adjust for magnetic declination, rotate the graduated circle by turning the circle adjusting
screw. Begin with the zero pin at 0°. For East declination, rotate graduated circle clockwise
from the zero pin. (Fig 9A) For West declination, rotate graduated circle counterclockwise. (Fig
9B) If magnetic declination is 0°, no adjustment is necessary. (Fig 9C)
35.
Taking Bearings withthe Compass - 1
A bearing is the compass direction from one point to another. A bearing always has a unidirectional
sense; for example, if the bearing from A to B is N 30 W, the bearing from B to A can only be S 30
E. Using the Brunton compass, the correct bearing sense is from the compass to the point sighted
when the sighting arm is aimed at the point. The white end of the needle gives the bearing directly
because the E and W markings are transposed.
To read accurate bearings, three things must be done simultaneously:
(1) the compass must be leveled,
(2) the point sighted must be centered exactly in the sights, and
(3) the needle must be brought nearly to rest.
36.
Taking Bearings withthe Compass - 1
When the point sighted is visible from the level of the waist or chest, the following procedure should be used.
1. Open the lid about 135°; ton the sighting arm out and turn up its hinged point (Fig. 2-2A).
2. Standing with the feet somewhat apart, hold the compass at waist height with the box cupped in the left hand.
3. Center the hull's eye. bubbale, and, keeping it approximately centered, adjust the mirror with the right hand
until the point sighted and the end of the sighting arm appear in it.
4. Holding the compass exactly level, rotate the whole compass (on an imaginary vertical axis) until the mirror
images of the point sighted and the tip of the sighting arm are superimposed on the black axial line of the
mirror.
5. Read the bearing indicated by the white end of the needle, which should be nearly at rest.
6. After reading the bearing, check to make sure the line of sight is correct and the compass is level..
7. Record or plot the bearing at once.
Fig. 2-2. Compass set for taking a bearing at waist height (A) and at height of eye (B).
37.
Taking Bearings withthe Compass - 1
When the point sighted is visible only at eye level or by a steep downhill sight, the following
instructions apply.
1. Fold out the sighting arm as above, but open the lid only about 45° (Fig. 2-2B).
2. Hold the compass in the left hand at eye level, with the sighting arm pointing toward, and
about 1 ft from, the right eye.
3. Level the compass approximately by observing the mirror image of the bull's eye bubble, and,
holding the compass approximately level, rotate it until the point sighted appears in the small
sighting window of the lid.
4. Holding the compass exactly level, rotate it until the point sighted and the point of the sighting
arm coincide with the axial line of the window.
5. Read the bearing in the mirror, double checking for alignment and level.
6. Transpose the direction of the bearing before recording or plot¬ting it (the compass was
pointed in reverse of its bearing direction).
With practice, bearings can be read to the nearest 0.5° provided the needle is steady
Measuring Vertical Angleswith the Clinometer- 2
Vertical angles can be read to the nearest quarter of a degree with the clinometer of the Brunton
compass. Instructions for this procedure are:
1. Open the lid about 45° and fold out the sighting arm, with its point turned up at right angles.
2. Hold the compass in a vertical plane, with the sighting arm pointing toward the right eye. The
compass must be about 1 ft from the eye so that the point sighted and the axial line in the
sighting window can be focused clearly.
3. Look through the window of the lid and find the point to be sighted, then tilt the compass until
the point of the sighting arm, the axial line of the window, and the point sighted coincide.
4. Move the clinometer by the lever on the back of the compass box until the tube bubble is
centered, as observed in the mirror.
5. Check to make sure the sights are still aligned, then bring the compass down and read and
record the angle.
40.
Measuring Vertical Angleswith the Clinometer- 2
Computing difference in elevation. The approximate difference in elevation between the point
occupied and the point sighted can be computed in the field if the slope distance is paced and if a
small table of sines of angles is available (difference in elevation = slope distance X sine of vertical
angle).
1- D.E. = H x tan θ
2- D.E. = H x tan θ + e.o
3- D.E. = H x tan θ - e.o
41.
Using the BruntonCompass as a Hand Level- 3
The Brunton compass is converted to a hand level by setting the clinometer exactly at 0, opening the
lid 45 and extending the sighting arm with the sighting point turned up. The compass is held in the
same way as when measuring vertical angles. It is tilted slowly until the mirror image of the tube
bubble is centered. Any point lined up with the tip of the sighting arm and the axial line of the
sighting window is now at the same elevation as the eye of the observer. By carefully rotating the
entire instrument with a horizontal motion, a series of points that are at the same elevation can be
noted.
Difference in elevation by leveling = The number of moves is tallied and multiplied by the height
of the surveyor's eye
Measuring Strike andDip – 4 (planes)
In structural geology, we need to describe the orientations of real and/or imaginary lines, planes,
and surfaces in three-dimensions and to define how those features change orientation through time.
Linear features in a rock are called lineations and planar features include foliations, bedding
planes, and faults. We use trend and plunge to describe the orientations of linear features. We
describe the orientations of planar features or portions of surfaces by: 1) Strike, dip, and dip
direction; or 2) Dip and dip bearing. If a line is associated with a plane, we can define its
orientation by defining a pitch and a pitch direction that relates to the strike and dip of the plane.
Planes
Strike, dip and dip direction,
• Most geologists use one of two different conventions to describe the orientation of a planar
surface in space: 1) Strike, dip, and dip direction; or 2) Dip and dip bearing. It is probably
more common to use strike, dip, and dip direction to define the orientation of a planar element.
We describe strike, and dip and dip direction measurements in this section, and dip and dip
bearing measurements in the following section. We will use a book as our standard for a planar
marker.
• The strike is the most difficult of the spatial orientation measurements to comprehend. The
strike is the direction of any and all horizontal lines on a plane. Every inclined plane will
contain an infinite number of strike lines, each of them different distances above or below a
horizontal datum.
44.
Measuring Strike andDip – 4 (planes)
The dip is the direction angle of maximum inclination on the plane. The direction of the dip is
necessarily perpendicular to the strike line. As with a plunge, we always measure the dip downward
from horizontal. The value of the dip varies from 0 to 90.
45.
Measuring Strike andDip – 4 (planes)
Planes
1- Strike (2-directional) and dip (uni-directional) or
Compass clinometer
120/15NE
2- dip and dip direction
30/N25E
46.
Measuring Strike andDip – 4 (planes)
Here is the protocol for taking a strike measurement with a transit compass:
• Put a measuring edge of the compass on the plane (Fig. 4.A5a) (Make sure that the right side of
the compass points in the dip direction if you are using right hand rule convention.
• Adjust the compass in order to level the bulls eye level.
• Record the measurement that either end of the needle points to on the circular dial (Read only
the white end of the arrow direction if you are using right hand rule convention).
• If you are learning to take strike and dip measurements, mark in pencil the strike line on the
planar surface. This is done by drawing a line parallel to the measuring edge, on the planar
surface.
47.
Measuring Strike andDip – 4 (planes)
Here is the protocol for taking a strike measurement with a transit compass:
• Put a measuring edge of the compass on the plane (Fig. 4.A5a) (Make sure that the right side of
the compass points in the dip direction if you are using right hand rule convention.
• Adjust the compass in order to level the bulls eye level.
• Record the measurement that either end of the needle points to on the circular dial (Read only
the white end of the arrow direction if you are using right hand rule convention).
• If you are learning to take strike and dip measurements, mark in pencil the strike line on the
planar surface. This is done by drawing a line parallel to the measuring edge, on the planar
surface.
48.
Measuring Strike andDip - 4
(E. McBride)
Cross-Section: Dipping Strata
Horizontal
Dip Angle
W E
49.
Measuring Strike andDip - 4
(E. McBride)
Cross-Section: Dipping Strata
W E
Horizontal
Dip Angle
50.
Measuring Strike andDip – 4 (planes)
Here is the protocol for taking a dip measurement.
1. Place the side of the compass on a plane. -Make sure that the measuring edges are parallel to the
line of steepest dip on the plane.
2. Rotate the level until the clinometer level becomes level. If the clinometer level is not on top,
you must turn over the compass and start over.
3. Read off the number and record it.
4. Point your compass in the dip direction and record the approximate bearing of the dip
direction. As a double check, make sure that the dip direction is consistent with a direction that
is 90° different from your strike measurement. (This step not needed if using right hand rule
convention).
Measuring Trend andPlunge – 5 (lines)
• We use two numbers to describe the orientation of a linear element or lineation in space: Trend
and plunge . The trend (also called the plunge bearing) is the angle between a horizontal line
and the projection of the linear element onto the horizontal plane (what you would see when
looking vertically down on the linear element from above).e usually give the trend as an
azimuth, varying from 000 to 360, and always written with three numbers (e.g., 005). For
example, if you place a pencil on the ground, with the point oriented toward N, the linear
element (i.e. pencil) would have a trend of 000. If the pencil were oriented NE, it would have a
trend of 045.
• The plunge (or inclination) of any linear element is the angle measured downward from the
horizontal to the line in a vertical plane, that vertical plane will also contain the direction of the
trend. That is, the plunge is the deviation from the horizontal in the vertical plane that contains
the linear element. The value of the plunge varies from 0 to 90. So, a pencil that is oriented
horizontally has a plunge of 0, a pencil that is oriented vertically has a plunge of 90, a pencil
that is oriented halfway has a plunge of 45. In structural geology, the plunge is always
downward into the Earth.
53.
Measuring Trend andPlunge – 5 (lines)
How to measure a linear object: trend and plunge
We will use a pencil as our example of a linear marker, with its orientation. The first task is to
determine the trend. Transit:
1. Point your compass in the direction of the pencil, making sure that the pencil plunges
downward away from you.
2. Level the bulls eye level.
3. Standing directly above the compass and having folded the pointer out fully, make sure you can
see the entire pencil through the slot in the pointer.
4. Make sure the bulls eye level is still horizontal.
5. Record the measurement reading off the white end of the arrow.
6. Point your compass toward N and make sure that your measurement makes sense.
54.
Measuring Trend andPlunge – 5 (lines)
The second task is to measure the plunge. The two long sides of the compass – informally
called the measuring edges– are critical.
1. Line up a measuring edge with the lineation.
2. Rotate the compass (about the measuring edge aligned with the lineation) until it lies in a
vertical plane 10
3. Using the lever on the base of the compass, adjust the cylindrical level until the clinometer level
becomes level. If the clinometer level is not on top, you must turn over the compass and start
over.
4. Read off the number and record it. -Double check that your trend is correct for the case of very
shallow or very steep lineations.
Measurements oncemade must be plotted and recorded, and
there are several ways of doing this too, some easier than
others. Structures must also be investigated, specimens
collected, photographs taken
FIELD MEASUREMENTS AND TECHNIQUES
60.
Structural Elements
One object of geological mapping is to elucidate the structure
and structural history of the region studied. This can only be
done if measurements are made of: the attitude of planar
structures such as bedding and foliation; linear features
including the intersection of bedding and cleavage; the
plunges of minor folds and the directions of overturning.
FIELD MEASUREMENTS AND TECHNIQUES
61.
Measuring Strikeand Dip of Planar Structures
Measurements of strike and dip of bedding, foliation and
jointing are fundamental. Without them, a geological map
means little.
Do not take measurements only when the strikes or dips have
changed!
FIELD MEASUREMENTS AND TECHNIQUES
62.
Measuring Strikeand Dip of Planar Structures
Strikes and dips can be measured in a number of different
ways. Suit your method to the type of exposure. Limestones,
for instance, often have uneven bedding surfaces, and a
method that allows you to measure strike and dip over a wide
area of surface will give more representative
Metamorphic rocks offer additional problems.
Measurements of cleavage or other foliations often have to
be made on very small parts of a surface
One point must be emphasised: you must plot measurements
onto your map immediately after you have taken them so
that any mistakes made in reading your compass – and they
do happen – are obvious.
FIELD MEASUREMENTS AND TECHNIQUES
63.
Measuring Strikeand Dip of Planar Structures
Method 1 contact method
FIELD MEASUREMENTS AND TECHNIQUES
64.
Measuring Strikeand Dip of Planar Structures
Method 2
FIELD MEASUREMENTS AND TECHNIQUES
65.
Measuring Strikeand Dip of Planar Structures
Method 3
where large areas of moderately dipping bedding planes are
exposed or where surfaces are too uneven to measure in any
other way.
FIELD MEASUREMENTS AND TECHNIQUES
66.
Measuring Strikeand Dip of Planar Structures
Conventions for writing down strike and dip
Conventions for recording strike and dip. (a)
Strike/dip/quadrant of dip direction, that is, 032/43 SE
(or212/43 SE). (b) Strike/dip; the strike direction is chosen
that, when used as a viewing direction, gives a dip to the
right, that is, 032/43. (c) Strike/dip; the strike corresponds to
the direction in which the index finger of the right hand
points when the thumb points down dip, that is, 212/43. (d)
Dip direction/dip, that is, 122/43.
FIELD MEASUREMENTS AND TECHNIQUES
(a) (b)
(c) (d)
67.
Measuring LinearFeatures
Trend, plunge and pitch (or rake)
FIELD MEASUREMENTS AND TECHNIQUES
( a ) ( b )
68.
Folds
Foldhinge lines: Measure the plunge and trend of the line on
the folded surface that joins points of greatest curvature
Axial planes: The axial plane is the surface geometrically
containing the hinge lines of successive folded surfaces in a
fold
Fold asymmetry // Fold shape
FIELD MEASUREMENTS AND TECHNIQUES
69.
Folds
Datachecklist for folds
• Type (antiform, synform, recumbent).
• Fold hinge line orientation (plunge, plunge direction).
• Axial plane (e.g. strike, dip).
• Symmetry when viewed in the plunge direction (s, z, m).
• Direction to larger-scale antiform indicated by
asymmetry or bedding cleavage.
• Fold class
• Associated structures (cleavage, jointing, veining).
• Sketch/photograph taken in the down-plunge direction
FIELD MEASUREMENTS AND TECHNIQUES
70.
Faults
Majorfaults are more likely to be found, but even those with
displacements of tens of metres may be missed where
exposure is poor.
Suspect a fault where:
• there are unaccountable changes in lithology;
• sequences are repeated;
• part of the sequence is absent;
• strikes of specific beds cannot be projected to the next
exposure;
• joint spacing suddenly decreasing to a few centimetres; or
• a zone of veining occurs.
FIELD MEASUREMENTS AND TECHNIQUES
71.
faults
Topographyis often a good guide. Faults may result in spring
lines, boggy hollows, seepages or, in semi-arid countries, a
line of taller greener trees, flanked by lower flat-topped
acacia. However, beware; although most fault zones erode a
little faster than the adjacent rocks to form longitudinal
depressions, some faults in limestones may form low ridges
owing to slight silicification, which helps to resist erosion.
Faults are more easily traced on aerial photographs, where
the vertical exaggeration of topography seen under a
stereoscope accentuates those minor linear features called
lineaments, features often to find on the ground; many of
them are probably faults.
FIELD MEASUREMENTS AND TECHNIQUES
72.
faults
Intextbooks much is made of slickenlines, and if they are
seen they should be noted, but do not put much faith in
them, they merely reflect the last phase of movement. Most
faults have moved several times, although not always in the
same direction.
FIELD MEASUREMENTS AND TECHNIQUES
73.
Thrusts
Ifthe thrust surface itself is exposed, the position should be
clearer. There may be shearing along the surface, or there
may be mylonite. Where mylonite does occur it may be thick
enough to map as a formation in itself and form a useful
marker.
Joints
Joints, like faults, are rock fractures. Joints, however, lack
discernible displacement. They occur in every type of rock –
sedimentary, pyroclastic, plutonic, hypabyssal, volcanic and
metamorphic.
Unconformities
FIELD MEASUREMENTS AND TECHNIQUES
What is GPS?
•Why GPS?
Location, Location, Location and INFORMATION!!
• What is GPS?
The Global Positioning System (GPS) A Constellation of
Earth-Orbiting Satellites Maintained by the United States
Government for the Purpose of Defining Geographic Positions
On and Above the Surface of the Earth. It developed by the US
Department of Defense as a worldwide navigation resource for
military and civilian use.
77.
What is GPS?
•At times, locating yourself on a map can be time-consuming,
especially where the base map lacks detail such as on open
moorland or in deserts.
• For this reason geologists are increasingly making use of
GPS to locate themselves in the field. GPS is a multi-
satellite-based radio-navigation, timing and positioning
system. It allows a person with a ground receiver to locate
themselves anywhere on Earth in three dimensions (latitude,
longitude and height above a global datum WGS-84) night
or day.
78.
What is GPS?
•GPS was developed by the US government for military use,
but since 1995 has also become available for civilian use.
Initially its precision was deliberately degraded for civilian
use, but since year 2000 civilians have been allowed greater
functionality (but still not the full military accuracy, which
is code protected). GPS is not the only available satellite
navigation system; there are the Russian GLONASS and the
European Union’s GALILEO project (which is still under
development). However, the cheapest navigation devices for
field mapping are basic hand-held GPS units; these are
called autonomous systems.
79.
What is GPS?
•However, there are a number of very useful functions a GPS
can perform to improve the efficiency and safety of field
mapping:
• Always enter the location of your basecamp in the GPS
memory, so if you get totally lost, at least you can use the
GPS to walk in the right direction back to camp.
• If you walk continually with the GPS in your hand it will
track its position and it can be used in electronic compass
mode. This is useful for walking rapidly over monotonous
open moorland along a set bearing, especially in
disorientating misty conditions.
80.
What is GPS?
•You can simply log the grid references of all the outcrops that you have
made notes of in your notebook by storing waypoints on the GPS and
then also noting the waypoint number in your notebook. It is good
practice to write these locations off the GPS into a notebook back at
basecamp every evening, just in case you lose the GPS or erase its
memory by accident.
• You can log the locations of specimen finds (fossils, minerals, etc.) as
waypoints so that you can easily find these locations at a later date to
collect more samples.
• If you wish to find an outcrop that you have seen on Google Earth
imagery you can enter in the grid reference of that outcrop into the GPS
and then use the GPS in the field to walk
• rapidly to that outcrop. Most GPS units will show a directional arrow
pointing to the pre-entered ground location whilst you are walking with
the GPS held out in front of you.
81.
What is GPS?
•Advice on GPS
• Make sure you purchase a GPS that contains the map coordinate
library for the country you plan to use it in.
• Before leaving home get familiar with your GPS and read the
manual so you understand how to change the GPS
latitude/longitude positional output to your local map grid
coordinate system.
• Test how long the GPS will work on a full battery charge by
leaving it on continually until it stops working.
• On arrival in your mapping area, visit an identifiable location on
your base map and check that the GPS works and gives the
correct location against your map coordinates.
82.
What is GPS?
•A Brief History of the Global Positioning System
• Since the late 1950’s both military and civilian agencies have actively
pursued the idea of position determination and navigation using
satellites. This resulted in the development of several military systems
which used specialized equipment responsive to particular mission
requirements, but usually with varying degrees of accuracy. In order to
integrate these independent efforts, the Department of Defense in 1973
issued a memorandum naming the Air Force as the Executive Service
for the initial development of a Defense Navigation Satellite System
(DNSS). This system was eventually designated the Navigation Satellite
Timing and Ranging Global Positioning System, or NAVSTARGPS. The
designed purpose of this system is to provide U.S. military forces and its
allies a means to navigate worldwide without dependence on ground
based navigation aids. The system is specifically designed to provide
guidance and weapons tracking for aircraft, ships, armor and missiles
(so-called “smart weapons” systems).
83.
What is GPS?
•During the early design phase of the GPS it was determined that only 17
satellites were actually needed to provide coverage for the entire earth.
However, the Pentagon decided that 24 satellites would provide enough
redundancy to prevent failures or gaps in the global system. Today the
GPS system is made up of 29 satellites of a version called “Block II.”
The first GPS satellite, a Phase 1, Block I satellite, was launched in 1978.
Nine more of these developmental satellites were deployed as part of the
Block I system. Then 23 Block II production satellites were launched in
the 1980’s and 1990’s. The launch of the 24th satellite in 1994 completed
the functional system we use today. The USAF NAVSTARGPS Joint
Program Office, Space and Missile Systems Center in Colorado oversees
overall operations of the System, and formally declared the GPS as
having met the requirement for Full Operational Capability on April 27,
1995. At that time the system had cost US taxpayers $14 billion to
develop and deploy.
84.
What is GPS?
•In the 1980’s civilian scientists began to use GPS for non-
military purposes, such as data collection. Since then GPS
use in the private sector around the world has exploded.
Many companies now provide products and services
utilizing GPS products and services. In a study conducted
by the Rand Corporation in the 1990’s, the projected
civilian uses for the GPS were expected to exceed those of
the military by a ratio of 8:1. It was the dramatic growth in
civilian sector use of the GPS that brought a premature end
to the military’s intentional dithering of the signal received
by civilian GPS receivers (called “Selective Availability”) on
May 2, 2000 in a decree signed by former President Clinton.
85.
The History ofGPS
The History of the Global Positioning System
• 1969—Defense Navigation Satellite System (DNSS)
formed
• 1973—NAVSTAR Global Positioning System
developed
• 1978—first 4 satellites launched Delta rocket
launch
• 1993—24th satellite launched; initial operational
capability
• 1995—full operational capability
• May 2000—Military accuracy available to all users
86.
Components of theSystem
GPS system consists of three Segments: User Segment, Control
Segment and Space Segment
87.
Space segment
Space segment
•24 satellite vehicles
• Six orbital planes
– Inclined 55o with respect to equator
– Orbits separated by 60o
• 20,200 km elevation above Earth
• Orbital period of 11 hr 55 min
• Five to eight satellites visible from
any point on Earth Block I Satellite
Vehicle
88.
Space segment
GPS SatelliteVehicle
• Weight
– 2370 pounds
• Height
– 16.25 feet
• Width
– 38.025 feet including wing span
• Design life—10 years
Block IIR satellite vehicle assembly at Lockheed Martin, Valley
Forge, PA
89.
Ground control segment
Groundcontrol segment
• Master control station
– Schreiver AFB, Colorado
• Five monitor stations
• Three ground antennas
• Backup control system
90.
User segment
User segment
•GPS antennas & receiver/processors
• Position
• Velocity
• Precise timing
• Used by
– Aircraft
– Ground vehicles
– Ships
– Individuals
91.
Four Primary Functionsof GPS
1) Position and waypoint coordinates. Using the GPS a receiver can provide position
or waypoint information for its current location or for any remote location on the
earth, and display that information in a variety of coordinates.
2) The distance and direction between a receiver’s position and a stored waypoint,
or between two remote waypoints.
3) Velocity reports: Distance to and between waypoints; tracking to a waypoint;
heading (direction of travel); speed; estimated time of arrival.
4) Accurate time measurement: GPS has become the universal timepiece, allowing
any two receivers (as well as any two clocks or watches) to be precisely
synchronized to each other anywhere in the world.
92.
How A GPSReceiver Determines Its Position
How A GPS Receiver Determines Its Position
• One satellite tells you that you are 20 miles from Frederick, Maryland.
• If the GPS receiver obtains two satellites, it tells you that you are also 20 miles
from Baltimore.
• A third satellite tells you that you are 20 miles from Washington DC.
• A fourth satellite is required to determine exact location and elevation
Sources of GPSError
• Clock Error
– Differences between satellite clock and receiver clock
• Ionosphere Delays
– Delay of GPS signals as they pass through the layer of
charged ions and free electrons known as the ionosphere.
• Multipath Error
– Caused by local reflections of the GPS signal that mix
with the desired signal
Sources of GPSError
• Standard Positioning Service (SPS ): Civilian Users
• Source Amount of Error
Satellite clocks: 1.5 to 3.6 meters
Orbital errors: < 1 meter
Ionosphere: 5.0 to 7.0 meters
Troposphere: 0.5 to 0.7 meters
Receiver noise: 0.3 to 1.5 meters
Multipath: 0.6 to 1.2 meters
Selective Availability (see notes)
User error: Up to a kilometer or more
• Errors are cumulative
97.
Selective Availability (S/A):
SelectiveAvailability (S/A):
• The Defense Department dithered the satellite time message, reducing position
accuracy to some GPS users.
• S/A was designed to prevent America’s enemies from using GPS
• In May 2000 the Pentagon reduced S/A to zero meters error.
• S/A could be reactivated at any time by the Pentagon.
• S/A errors can put you on the wrong side of a stream, or
• even a different city block or street!
– Exp. 300 feet is a lot of real estate!!!
98.
Different “Grades” ofGPS receivers
• Recreational Grade GPS ~$100-$800
-Accurate to within 5 meters (possibly better)
-Suitable for hunting, recreational and some business uses
• Mapping Grade GPS - $5,000-7,000
-Accurate to within 1 meter (3 feet)
-Suitable for many natural resource applications, city planning
• Survey Grade GPS - ~$20,000
– Accurate to within 1 cm, suitable for building bridges…
99.
Signal Accuracy (systemperformance)
There are 2 types of GPS Signals:
a- P-code: (“Precise” code) (Precise Positioning System)
• This is only available to the military and some selected public officials.
• Very precise, not degraded.
• 22 meters horizontal accuracy
• 27.7 meters vertical accuracy
• Designed for military use
•
b- C-code: (“Civilian” Code) (Standard Positioning System).
• Less precise
• Signal can be degraded (by scrambling the signal) especially in times of conflict.
• This is what the GARMIN GPSMAP76 (and all public GPS receivers)
• 100 meters horizontal accuracy
• 156 meters vertical accuracy
• Designed for civilian use
• No user fee or restrictions
100.
Differential GPS
• Methodof removing errors that affect GPS measurements
– A base station receiver is set up on a location where the coordinates
are known
– Signal time at reference location is compared to time at remote
location
• Time difference represents error in satellite’s signal
• Real-time corrections transmitted to remote receiver
– Single frequency (1-5 m)
– Dual frequency (sub-meter)
101.
Wide Area AugmentationSystem (WAAS)
The precision and accuracy of the Global Positioning System still limits its use for
aircraft landings and in-flight navigation. As described earlier, satellite position
errors, clock drift, and the earth’s atmosphere all enhance GPS position errors
(both vertically and horizontally). However, the Federal Aviation Administration
(FAA) realized the value in enhancing the GPS to provide for better aircraft
navigation. Currently under development (the system is operational, but has not yet
been approved for commercial civil aviation),
the Wide Area Augmentation System (WAAS) is an experimental system designed to
enhance and improve satellite navigation over the continental United States, and
portions of Mexico and Canada. Unlike the GPS, which is funded and maintained
by the U.S. military, the WAAS is funded by the FAA and Department of
Transportation. It is specifically meant for civilian and commercial applications
within the United States.
Application of GPSTechnology
• Location - determining a basic position
• Navigation - getting from one location to another
• Tracking - monitoring the movement of people and things
• Mapping - creating maps of the world
• Timing - bringing precise timing to the world
• Private and recreation
– Traveling by car
– Hiking, climbing, biking
– Vehicle control
• Agriculture
• Aviation
– General and commercial
– Spacecraft
106.
One objectof geological mapping is to elucidate the structure
and structural history of the region studied. This can only be
done if measurements are made of: the attitude of planar
structures such as bedding and foliation; linear features
including the intersection of bedding and cleavage; the
plunges of minor folds and the directions of overturning.
It is assumed that the READER already knows what these
structures are, although many budding geologists do not
know the best way of measuring them.
FIELD MEASUREMENTS AND TECHNIQUES
107.
Structural Elements
Measuring Strikeand Dip of Planar Structures
Measurements of strike and dip of bedding, foliation and
jointing are fundamental. Without them, a geological map
means little.
Strikes and dips can be measured in a number of different
ways. Suit your method to the type of exposure.
Limestones, for instance, often have uneven bedding surfaces,
and a method that allows you to measure strike and dip over a
wide area of surface will give more representative values than
one where only a point on the surface is measured.
Metamorphic rocks offer additional problems. Measurements
of cleavage or other foliations often have to be made on very
small parts of a surface, sometimes even overhanging ones.
FIELD MEASUREMENTS AND TECHNIQUES
108.
Structural Elements
Measuring Strikeand Dip of Planar Structures
One point must be emphasised: you must plot measurements
onto your map immediately after you have taken them so that
any mistakes made in reading your compass – and they do
happen – are obvious. This is not the only reason for plotting
data directly; the readings on the map define the structure
and greatly assist with chasing contacts and the completion of
the map.
the immediate plotting of structural measurements is where
structures are locally complex: then you may have to draw an
enlarged sketch in your notebook and plot the measurements
on it.
FIELD MEASUREMENTS AND TECHNIQUES
109.
Structural Elements
Measuring Strikeand Dip of Planar Structures
Method 1
This, the contact method, is commonest of all. Use it where
the surface is smooth and even. If there are small
irregularities, lay your map case on the rock surface and make
your measurements on that, but sometimes such a small area
of bedding (or cleavage, fault surface, etc.) is exposed that
direct contact is the only method than can be used.
FIELD MEASUREMENTS AND TECHNIQUES
With practice you can usually estimate
strike and dip with sufficient accuracy, but
where surfaces are close to horizontal,
strike may be difficult to estimate.
110.
FIELD MEASUREMENTS ANDTECHNIQUES
Structural Elements
Measuring Strike and Dip of Planar Structures
Method 2
On large uneven surfaces of relatively low dip, estimate a
strike line of a metre or more in length (if necessary, mark it
with a couple of pebbles), then stand over it with your
compass opened out and held parallel with it at waist height.
In a stream or on a lake shore nature may help, for the water
line makes an excellent strike line to measure. The same
method can be used to measure the strike of foliation or of
veins on flat outcrop surfaces.
111.
FIELD MEASUREMENTS ANDTECHNIQUES
Structural Elements
Measuring Strike and Dip of Planar Structures
Method 3
This gives reliable measurements of strike and dip in regions
where large areas of moderately dipping bedding planes are
exposed or where surfaces are too uneven to measure in any
other way. Extreme examples are the dip slopes often seen in
semi-arid countries, but the method can also be used on
smaller uneven surfaces, including joint planes.
112.
FIELD MEASUREMENTS ANDTECHNIQUES
Structural Elements
Measuring Strike and Dip of Planar Structures
Recording Strike and Dip
Whether you enter your strike and dip readings in your
notebook as well as on your map is debatable, but if you lose
your field map, you will have to start all over again from
scratch anyway.
Conventions for writing down strike and dip
The most unambiguous way to do this is to write down three
items in this format: 032/43 SE. The first item, 032, is the
direction of strike (Figure 6.8). Either one of the two
possibilities, 032 or 212, can be given.
(a) (b)
(c) (d)
113.
FIELD MEASUREMENTS ANDTECHNIQUES
Structural Elements
Measuring Linear Features-Trend, plunge and pitch (or rake)
lineations appear as lines on an inclined geological surface, for
instance where the trace of bedding can be seen on a cleavage
plane.
Such lineations can often be measured more easily by their
pitch (rake), that is, the angle the lineation makes with the
strike of the surface on which it occurs
This measurement has to be accompanied by the strike and dip
readings of the plane on which the lineation lies.
114.
FIELD MEASUREMENTS ANDTECHNIQUES
Structural Elements
Folds
Fold hinge lines
Measure the plunge and trend of the line on the folded
surface that joins points of greatest curvature
Axial planes
Fold asymmetry
Fold shape
FIELD MEASUREMENTS ANDTECHNIQUES
Structural Elements
Faults
Major faults are more likely to be found, but even those with
displacements of tens of metres may be missed where
exposure is poor.
Many faults have to be mapped by inference. Suspect a fault
where:
there are unaccountable changes in lithology;
sequences are repeated;
part of the sequence is absent;
strikes of specific beds cannot be projected to the next
exposure;
joint spacing suddenly decreasing to a few centimetres; or
a zone of veining occurs.
117.
FIELD MEASUREMENTS ANDTECHNIQUES
Structural Elements
Faults
Topography is often a good guide. Faults may result in spring
lines, boggy hollows, seepages or, in semi-arid countries, a line
of taller greener trees, flanked by lower flat-topped acacia.
However, beware; although most fault zones erode a little
faster than the adjacent rocks to form longitudinal
depressions,
The slip (real displacement)
Dip/strike
slickenlines
118.
FIELD MEASUREMENTS ANDTECHNIQUES
Structural Elements
Thrusts- Joints- Unconformities
Thrusts are low-angle reverse faults. They can be very large
and important structures, but sometimes can completely
escape notice. They often become more obvious from the map
pattern.
Joints, like faults, are rock fractures. Joints, however, lack
discernible displacement. They occur in every type of rock –
sedimentary, pyroclastic, plutonic, hypabyssal, volcanic and
metamorphic. Do record joints, but do not clutter your map
with them.
Stratigraphic unconformities show younger rocks lying on
older rocks below, but their junction represents a break in
sedimentation.
119.
FIELD MEASUREMENTS ANDTECHNIQUES
Specimen Collecting
Collect representative specimens of every formation and rock-
type you show on your map.
The size of specimen you collect must depend on the purpose
you wish to put it to, not on what you think you can carry.
choose specimens showing both weathered and unweathered
surfaces
You may have to spend considerable time in breaking out a
good specimen with hammer and chisel.
Metamorphic specimens may need to be oriented so that
directional thin sections can be cut.
120.
FIELD MEASUREMENTS ANDTECHNIQUES
Specimen Collecting
Marking specimens
Marking rough, wet and often friable rock specimens with a
unique and permanent specimen number is often not a
trouble-free task. Light-coloured, smooth specimens are best
marked with a black waterproof permanent marker pen. Dark-
coloured rocks can be numbered in the field by painting on a
unique number with permanent quick-drying
. In camp, wash your specimens to clean them and to remove
any loose surface material, then dry them. When dry, paint on
a small patch using white or yellow enamel model paint, and
when that’s dry, number the specimen by using a fine
permanent black marker pen.
121.
FIELD MEASUREMENTS ANDTECHNIQUES
Specimen Collecting
Samples of fossils
Some fossils are easy to remove from their rock matrix, others
are not. Many are deeply embedded with only a small portion
showing; scrape away enough rock with a knife to see whether
the specimen is worth collecting, and if so then break out the
rock containing it.
Mark all specimens with the way-up in which they were
found.
Pack delicate specimens in boxes or tins and pad them with
cotton wool, tissue paper or newspaper or use expanded
polystyrene ceiling tiles cut to fit the boxes.
122.
FIELD MEASUREMENTS ANDTECHNIQUES
Field Photography
A camera is an essential tool for a field geologist. Because you
will need to capture many images to remind yourself of field
landscapes, rock outcrops or close-ups of small specimens.
Many images will be required to illustrate your technical
report and perhaps an interesting Powerpoint talk about your
fieldwork programme.
It is very easy with digital photography to take thousands of
field photographs and rely on your own memory regarding
where each was taken; this technique is usually disastrous.
Treat photography as part of the data collection process and
write down in your notebook the frame number, geographical
location and view direction of at least the key important
images.
When photographing rock exposures, always include a SCALE
123.
FIELD MEASUREMENTS ANDTECHNIQUES
Using digital cameras for field photography
there are advantages and disadvantages of digital systems that
the geologist needs to be aware of.
The advantages of digital photography are:
An immediate display of the image, allowing a quality check to
be made before moving on to the next locality.
Because the image is stored electronically, the digital image
can be later improved using software such as Photoshop
Elements in terms of cropping, brightness, contrast,
sharpening, colour hue, and so on.
124.
FIELD MEASUREMENTS ANDTECHNIQUES
Using digital cameras for field photography
The disadvantages of digital cameras for fieldwork are:
The field ruggedness of many digital cameras remains a
consideration; like all electronic instruments they do not like
moisture, and sea water is fatal. It is not recommended to buy
an expensive system with interchangeable lenses for active
fieldwork because dust and moisture may enter the camera’s
electronics and totally disable the system.
It is yet another electronic device that you are carrying into
the field that will require battery power, either rechargeable
or disposable.
Images are stored on memory cards that have finite storage
capacity. You will either need a bank of cards safely stored
back at base camp or a secure field laptop computer onto
which you can download each day’s set of images.
127.
To make ageological map you need a topographic
base map on which to plot your geological
observations in the field. You will also need a second
map on which to replot your interpretation of the
geology as a ‘fair copy map’ to submit to your
employer or supervisor, when your work is
complete.
GEOLOGICAL MAPS AND BASE MAPS
128.
GEOLOGICAL MAPS ANDBASE MAPS
Types of Geological Map
Geological maps fall into four main groups. These
are: reconnaissance maps; maps made of regional
geology; large-scale maps of limited areas; and maps
made for special purposes. Small-scale maps
covering very large regions are usually compiled
from information selected from one or more of these
groups.
129.
GEOLOGICAL MAPS ANDBASE MAPS
Geological reconnaissance maps
Reconnaissance maps are made to find out as much as
possible about the geology of an area as quickly as
possible. They are usually made at a scale of 1:250 000 or
smaller, sometimes very much smaller. Some
reconnaissance maps are made by photogeology, that is by
interpreting geology from aerial photographs, with only a
minimum of work done on the ground to identify rock
types and to identify dubious structural features, such as
lineaments. Reconnaissance maps have even been made by
plotting the main geological features from a light aircraft or
helicopter with, again, only brief confirmatory visits to the
ground itself.
130.
GEOLOGICAL MAPS ANDBASE MAPS
Regional geological maps
Reconnaissance may have given the outline of rock
distribution and general structure; now the geology must
be studied in more detail, most commonly at a scale of 1:50
000 or 1:25 000, although any resulting map will probably
be published at 1:100 000. Regional geological maps should
be plotted on a reliable base.
Some geological features seen on aerial photographs
cannot even be detected on the ground while others can
even be more conveniently followed on photographs than
in surface exposures. All geological mapping should
incorporate any techniques which can help in plotting the
geology and which the budget will allow, including
geophysics, pitting, augering, drilling and even the use of
satellite images where available.
GEOLOGICAL MAPS ANDBASE MAPS
Detailed geological maps
Scales for detailed geological maps may be anything from
1:10 000 and larger. Such maps are made to investigate
specific problems which have arisen during smaller-scale
mapping, or from discoveries made during mineral
exploration, or perhaps for the preliminary investigation of
a dam site or for other engineering projects.
133.
GEOLOGICAL MAPS ANDBASE MAPS
Specialised maps
Specialised maps are many and various. They include large-
scale maps of small areas made to record specific
geological features in great detail. Some are for research,
others for economic purposes, such as open pit mine plans
at scales from 1:1000 to 1:2500; underground geological
mine plans at 1:500 or larger; and engineering site
investigations at similar scales. There are many other types
of map with geological affiliations too. They include
geophysical and geochemical maps; foliation and joint
maps; and sampling plans. Most are superimposed over an
outline of the geology, or drawn on transparencies to be
superimposed on geological maps, to study their
relationship with the solid geology.
GEOLOGICAL MAPS ANDBASE MAPS
Topographic Base Maps
They area available at at 1:25 000, 1:50 000 and 1:250
000.scales and contains features as forest areas, or colour
layered to indicate contour intervals, or contour-shaded
and hachured to emphasise topography.
GEOLOGICAL MAPS ANDBASE MAPS
Geographic Coordinates and Metric Grids
Geographic coordinates
Geographic coordinates represent the lines of latitude and
longitude which sub-divide the terrestrial globe. To make a
map, part of the curved surface of the globe is projected on
to a flat surface. This may result in one or both sets of
coordinates being shown as curved lines, depending on the
type of projection being used. In Transverse Mercator’s
projection, however, the one most commonly used for the
large-scale maps on which geologists work, latitude and
longitude appear as intersecting sets of straight parallel
lines.
138.
GEOLOGICAL MAPS ANDBASE MAPS
Metric grids
The metric grid printed on maps is a geometric not a
geodetic device. The grid is superimposed on the flat map
projection and has (almost) no relationship to the surface
of the globe: it is merely a system of rectangular
coordinates, usually printed as 1 km squares on maps from
1:10 000 to 1:50 000 and 10 km squares on maps of smaller
scales. Geologists also usually find it convenient to plot
their compass bearings from grid lines, yet many still adjust
their compasses to offset the difference between magnetic
and true north when they should adjust them for the
difference between magnetic and grid north.
GEOLOGICAL MAPS ANDBASE MAPS
Position Finding on Maps
In the field a geologist should be able to position himself to
better than 1 mm of his correct position on the map, whatever
scale he is using; i.e. to within 10 m on the ground or better on a
1:10 000 map, and to within 25 m on a 1:25 000 sheet. Now, GPS
is very useful to find your locations and Not only are the
instruments useful in establishing the position of your geological
observations, they can also point you along your way when lost.
But, sometimes may not always be available for a number of
reasons: deep valleys, forest, you have run out of batteries, or
perhaps you just cannot afford one. In any case, a geologist
should know how to find out where he is without one. Also,
Satellites images and aerial photographs are very helpful to
locate yourself in the field but they need your skills to read
them.
GEOLOGICAL MAPS ANDBASE MAPS
Read your map
Even if you are using a GPS, consult your map whilst mapping in
order to monitor continually your position on the map. This will
save valuable field time because arriving at a place and then having
to locate yourself from scratch can be a very time-consuming
business. Carry your map under your arm, not in the rucksack, and
inspect it at regular intervals under the transparent protective
cover of your map case. When navigating,
• Hold your map in its correct orientation, using your compass if
necessary.
• Look around for features on the ground and check if they are
shown onthe map.
Before leaving a locality, look around for more exposures and
consider whereyour next stop will be. Then, estimate mentally its
approximate location on the map. That could save time when you
get there.
143.
GEOLOGICAL MAPS ANDBASE MAPS
Read your map
There are many methods to find your position on the map (but the
space is not enough here to explain their details, you can search for
details) such as:
• Pacing
• Location by pacing and a compass bearing
• Offsets
• Intersection of bearing and linear feature
• Compass resection: intersection of three back-bearings
• Compass and hand-level intersections
• Compass and altimeter intersections
• Sighting additional survey points
• Global Positioning System (GPS)
144.
GEOLOGICAL MAPS ANDBASE MAPS
Use of Air Photography as a Mapping Tool
The value of aerial photographs to the geologist cannot be overestimated.
In reconnaissance, large tracts can be mapped quickly with only a
minimum amount of work done on the ground. In more detailed
investigations, examination of stereopairs of photographs under a
stereoscope can reveal many structures which are difficult to recognise in
the field, and some which cannot be seen at all at ground level.
Photographs are as much a tool to the field geologist as his hammer and
handlens. Even good base maps do not obviate the need for photographs;
they should be used together. Aerial photographs can also be used where
no base maps are available by building up an ‘uncontrolled mosaic’ as a
substitute map on which geology can be plotted. It is not an accurate map,
but it will serve its purpose for want of anything better. Information can
also be plotted directly on to photographs in the field and then
transferred to a base map later. This is particularly useful when the
topographic detail on your map is so poor that finding your position in the
field is difficult and time-consuming.
GEOLOGICAL MAPS ANDBASE MAPS
Use of Air Photography as a Mapping Tool
Such aerial photographs are taken sequentially by the aircraft flying along
a series of parallel flight paths, which may be along common linear
bearings or along arcs of a circle, depending on the navigation method
employed. Multiple vertical air photographs are taken with a repeat time
interval, such that each photograph along a flight line overlaps the next by
around 60% and each line of photographs overlaps the next by around
30%
148.
GEOLOGICAL MAPS ANDBASE MAPS
Plotting on aerial photographs
Mapping information can be plotted directly on to air
photographs in the field using a transparent overlay and
then later transferred onto a base map.
Numerous types of GIS software exist that can geo-
reference air photographs, allow you to make
measurements directly from the image and also to mosaic
multiple images together (e.g. Global Mapper, Pitney
Bowes MapInfo, Erdas Imagine, ER Mapper, Manifold and
ESRI ArcGIS).
149.
GEOLOGICAL MAPS ANDBASE MAPS
Plotting on aerial photographs
The surface of a photograph is not easy to write on in the field, and
if you do write on photographs from a film library, you will not be
popular.
The best method of recording information is on an overlay of
‘Permatrace’, ‘Mylar’ or similar transparent tracing material. Cut a
piece for an overlay to the Locating your position on a photograph
is usually easy; it can be done either by inspection of a single
photograph by identifying a nearby feature, or if in difficulty by
using an adjacent photograph as a stereopair and viewing with a
pocket stereoscope to give a 3D image.
Note, however, that the 3-D image gives a very considerable
vertical exaggeration to the topography. Small hills look like high
hills, high hills look like saw-tooth mountains, and this exaggeration
must be taken into account when locating yourself.
GEOLOGICAL MAPS ANDBASE MAPS
Suitability of Images for Geological Mapping
Historically the photography used for detailed geological mapping
has been obtained from large-format film cameras mounted on
aircraft or balloons. The vast majority of these low-altitude large-
format film images were taken using high-resolution black-and-
white film.
remote-sensing satellites for geological mapping has developed
significantly since the advent of NASA’s Landsat programme in 1972
and SPOT (Satellite pour l’Observation de la Terre) in 1986. The
ground pixel resolution of the images produced has gradually
improved from 50m, to 25m, to 5m and better. Today, advanced
satellite imaging systems exist – such as the USA’s ASTER (Advanced
Spaceborne Thermal Emission and Reflection Radiometer), IKONOS
and WORLDVIEW or India’s IRS (Indian Remote Sensing) – that are
capable of producing geologically very useful imagery at a detailed
mapping scale.
152.
GEOLOGICAL MAPS ANDBASE MAPS
Suitability of Images for Geological Mapping
Free to view geo-referenced true-colour satellite and digital air imagery is
available via the internet using web platforms such as Google Earth and
Microsoft Virtual Earth.
153.
GEOLOGICAL MAPS ANDBASE MAPS
Technological Aids to Mapping
Geological mapping involves the mastery of a wide range of
skills:
observational and interpretive skills,
a broad knowledge of rocks and geological processes,
plus navigational and cartographic skills.
The equipment and data resulting from these advances
help geologists produce very accurate 3D topographic base
maps, and achieve improved locational accuracy whilst in
the field; and geologists now have the potential to visualise
their final map in 3D.
154.
GEOLOGICAL MAPS ANDBASE MAPS
Digital Terrain Models
Over the past decade new ways of creating detailed and
accurate digital topographic models of the Earth’s
surface have been developed, and these are proving a
great assistance to geological mapping.
These computer landscape models are known as Digital
Terrain Models (DTMs) or Digital Elevation Models
(DEMs); they are mathematical approximations of the
complex 3D topographic surface of a given study area.
These DTMs are creating a revolution in the way we look
at the Earth’s surface.
155.
GEOLOGICAL MAPS ANDBASE MAPS
Digital Terrain Models
Terrain models are used by geologists to:
• Create a detailed landscape ‘picture’ of the study area as
an aid to reconnaissance prior to the field programme. Terrain
analysis techniques can also, for example, be used to
remotely calculate topographic cross-sections or slope angle
maps.
• Produce an accurate base map for field mapping.
• Help create 3D landscape visualisations. The final geology
map can be draped onto the 3D landscape model to display
the relationships between geological structures, lithologies
and landscape morphology.
• Assist in global tectonic/isostatic studies, by measuring
large-scale land movements as a consequence of regional
tectonic uplift or earthquakes.
GEOLOGICAL MAPS ANDBASE MAPS
Basic principles of DTMs
To create a DTM of any area of the Earth’s surface, the area is
divided into square survey cells and the average topographic
elevation of each cell (above a datum) is determined.
The quality of any DTM depends on the size of the survey cell
and the precision of the average elevation value. In computer
terms, a DTM in its simplest form is just a list of millions of x,
y and z data values, with x and y being the geographical
coordinates of the centre of the cell and z its elevation value.
The footprint size of a DTM cell may range from 25×25m for
regional reconnaissance surveys, to 1×1m for detailed
applications. For geological purposes the ‘bare Earth’ DTM
model is preferred, where the cell elevation value is the
average ground level stripped of vegetation and man-made
structures.
160.
GEOLOGICAL MAPS ANDBASE MAPS
Methods of visualising DTM data
A DTM containing millions of individual cell values requires dedicated GIS
software to process such large amounts of data. Software such as ArcGIS,
Mapinfo, Surfer, Global Mapper and so on are all able to create landscape
visualisations from DTM data files. Such datasets can be visualised in a number
of ways
Image maps – The DTM is viewed as a digital raster image from vertically above.
The colour or greytone assigned to each individual cell is controlled by the z
(elevation) value of that cell.
Shaded relief maps – A 3D surface model is created from the DTM, which is
normally viewed as a digital raster image from vertically above. Artificial sunlight
is shone across the 3D surface from a point source ‘sun’; the position of the ‘sun’
can be moved by the software operator to any compass direction and vertical
azimuth. This creates light and shaded areas for ground slopes facing towards or
away from the ‘sun’. Shaded relief is a very powerful technique used by
geologists to reveal the intricate details of a complex landscape and also to
accentuate subtle landscape lineaments.
3D surfaces – The software creates a solid 3D model of the DTM surface by
interpolating between the individual DTM points.
GEOLOGICAL MAPS ANDBASE MAPS
Techniques for acquiring digital terrain data
Digitising topographic contours from paper-based maps.
Photogrammetric analysis of stereoscopic aerial photos or satellite images.
Measuring the time it takes radar reflections to return from the Earth’s surface,
acquired from aircraft surveys. The huge advantage with radar data is that they
can be recorded either by using short-wavelength pulses as first reflections from
vegetation digital surface model (DSM) or by using long wavelength pulses from
the underlying ground surface (DTM). This allows geologists to ‘see through’ thick
vegetation cover to reveal bedrock outcrops. In tropical regions of permanent
cloud and thick vegetation, radar-derived DTMs are revolutionising geological
mapping.
Using lasers (Light Detection and Ranging, LIDAR) fired from scanners housed on
aircraft. As with radar above, the time it takes laser reflections to travel from a
moving aircraft to the Earth’s surface and back can be converted into distance
measurements.
Using differential GPS, Global Satellite Navigation Surveying System (GNSS) or
Real-Time Kinematic (RTK) surveying techniques.
165.
GEOLOGICAL MAPS ANDBASE MAPS
Terrain analysis techniques
However, other techniques for the analysis of terrain models can be used to
assist mapping:
Slope angle analysis – The first derivative of the 3D landscape can be calculated
to produce a map of ground slope angles from the DTM. This is particularly useful
in landslide mapping, highlighting areas of steep slopes. The second derivative of
the 3D landscape surface can be calculated to highlight rapid changes in slope
angles. These ‘breaks-of-slope’ can be used to track geological outcrop
boundaries and fault lines.
Slope aspect models – The compass direction in which a slope faces is called its
aspect. Maps of slope aspect can be calculated from the DTM; these are of
particular use in mapping periglacial freeze-thaw regions and snow avalanches.
Slopes that face towards the sun are more prone to melt during the summer
months.
Derivation of drainage systems – Using the 3D landscape model and the principle
that rainwater falling on a surface always flows down slope, ‘virtual’ precipitation
can be modelled onto the DTM. Such computer modelling can then reveal the
predicted patterns of stream or river channels that develop on the landscape,
and determine individual river catchments, drainage basins and floodplain areas
at risk of flooding.
Geological mapping isthe process of
making observations of geology in the
field and recording them.
The information recorded must be
factual, based on objective examination
of the rocks and exposures, and made
with an open mind
METHODS OF GEOLOGICAL MAPPING
173.
Obviously the thoroughnesswith which a
region can be studied depends upon
the type of mapping on which you are
engaged. A reconnaissance map is based on
fewer observations than, say, a regional map,
but those observations must be just as
thorough.
Whatever the type of mapping, whatever your
prior knowledge of an area, map with equal
care and objectivity
METHODS OF GEOLOGICAL MAPPING
174.
Strategy for theMapping Programme
reconnaissance work, to gain an initial impression of:
1. the rock-types present;
2 .the general ‘structural grain’; and
3. the issues of topography, where the rock
exposures exist, routes, access, and so on.
A sensible approach is to plan these early trips to
make full use of the paths and roads shown on the
map, so that excessive time is not spent with
locating yourself or with struggling through dense
vegetation. Streams may give good rock exposures,
but higher ground may provide better panoramas of
the area’s geology.
METHODS OF GEOLOGICAL MAPPING
175.
METHODS OF GEOLOGICALMAPPING
Strategy for the Mapping Programme
Greenly and Williams (1930) describe three different
strategies for producing a geological map. These,
known as
following contacts,
traversing and
exposure mapping
176.
METHODS OF GEOLOGICALMAPPING
Mapping by Following Contacts
Although you may not have made a geological map
yet, you have probably already seen one. Such maps
display often dramatic and intricate patterns of
colour, each corresponding to a different geological
unit, or formation.
Lines are drawn on geological maps to show the
limits of the individual formations. These lines are
often referred to as contacts.
177.
METHODS OF GEOLOGICALMAPPING
Mapping by Following Contacts
A primary objective of mapping geology is to trace
contacts between different rock formations, groups
and types and to show on a map where they occur.
One way of doing this is to follow a contact across
the ground as far as it is possible to do so.
Occasionally, in some well-exposed regions and with
some types of geology, a contact can be seen
directly; elsewhere contacts are not continuously
exposed and have to be inferred.
Sometimes contacts can be followed more easily and
more accurately on aerial photographs
178.
METHODS OF GEOLOGICALMAPPING
Traversing
Traversing is basically a method of controlling your
progress across country, so that you do not have to
relocate yourself from scratch every time you make
an observation at an outcrop.
A traverse is made by walking a more or less
predetermined route from one point on the map to
another, plotting the geology on the way. Traverses
are an excellent way of controlling the density of
your observations.
They should be planned to cross the general
geological grain of the part of the region you are
working in
179.
METHODS OF GEOLOGICALMAPPING
Traversing
a number of roughly parallel traverses may be
walked across country at widely spaced intervals.
Contacts and other geological features are
extrapolated between them.
Traversing can also be used to map areas in detail
where rocks are well exposed, especially those
where there is almost total exposure. In such cases,
traverses are closely spaced. GPS is an obvious help
in traversing.
180.
METHODS OF GEOLOGICALMAPPING
Controlling traverses
If a traverse made on compass bearings consists of a
number of legs, either start and finish on known
points if possible; otherwise close the traverse by
returning to the starting point. Invariably, when you
plot this ‘closed’ traverse you will find that the last
bearing does not fall exactly where it should do,
owing to an accumulation of minor errors of
direction and distance measurement. This closure
error must be corrected by distributing it over the
whole traverse, not by fudging the last leg.
181.
METHODS OF GEOLOGICALMAPPING
Cross-section traverses
Whatever mapping method you do use, it can be
useful where a succession is doubtful or structurally
complex to traverse across the geological grain,
plotting a cross-section as you go. Draw it in your
notebook or on squared, but also show the traverse
line on your field map. The advantages of drawing
sections in the field are obvious: problems come to
light immediately and can be promptly investigated.
182.
METHODS OF GEOLOGICALMAPPING
Stream and ridge traverses
Streams and ridges are features which are usually
identifiable on even poor quality maps. Streams
often give excellent semi-continuous exposures and
in some mountain areas may be so well spaced that
a major part of the geology of that area can be
mapped by traversing them, especially where slopes
are partly covered by colluvium. Position finding on
streams is often relatively easy from the shape and
direction of bends, and the position of islands, water
falls and stream junctions, or sometimes by resecting
on distant points.
183.
METHODS OF GEOLOGICALMAPPING
Road traverses
A rapid reconnaissance of an unmapped area can
often be made along tracks and roads and by
following paths between them. Roads in
mountainous regions, in particular, usually exhibit
excellent and sometimes almost continuous
exposures in cuttings. In some places roads zigzag
down mountainsides to repeat exposures of several
different stratigraphic levels. A rapid traverse of all
roads is an excellent way of introducing yourself to
any new area you intend to map in detail.
184.
METHODS OF GEOLOGICALMAPPING
Exposure Mapping
Mapping by exposures is the mainstay of much detailed
mapping at scales of 1:10000 or larger. The extent of
each exposure, or group of exposures, is indicated on the
field map by colouring them in with the coloured pencil
chosen for that formation
Do not be too fussy about plotting the outline of an
exposure unless you are mapping at a very large scale
A properly prepared field map should leave no doubt of
the quality of the evidence on which it is based
there is no single mapping method to cover every
eventuality. Sometimes you may have to use several
different methods in different parts of a large mapping
area.
185.
METHODS OF GEOLOGICALMAPPING
Mapping in Poorly Exposed Regions
If an area is poorly exposed, or the rocks are hidden
by vegetation, climb to convenient high ground and
mark on your map the positions of all the exposures
you can see (this is where binoculars prove useful);
then visit them. Of all rocks, mica schists probably
form the poorest exposures but even they may show
traces on footpaths where soil has been worn away
by feet, or by rainwash channelled down them.
186.
METHODS OF GEOLOGICALMAPPING
Geophysical Aids to Mapping
Geophysics can play an important role in providing
very useful information for any mapping programme.
Every geologist should at least know about the wide
variety of techniques on offer, the basic physical
principles of each and what they are likely to be able
to detect. The application of most techniques
requires a trained geophysicist to apply and interpret
the data, but some methods can be used after a few
hours of basic training.
187.
METHODS OF GEOLOGICALMAPPING
Geophysical Aids to Mapping
Applied geophysical techniques fall into two broad
categories – passive and active.
Passive techniques just measure already existing
natural Earth fields using a receiver.
Active techniques are geophysical experiments
where the geophysicist is in charge of some kind of
active energy source and he or she measures the
interaction of that source with the Earth using a
transmitter and receiver system.
188.
METHODS OF GEOLOGICALMAPPING
There are four main passive systems
Geophysical Aids to Mapping
Gravity measurements
The gravity at any point on the Earth’s surface varies due to
the distance away from the centre of the Earth, tidal effects,
local terrain and local density variations in the Earth’s crust.
Using a very expensive gravity meter, very small spatial
variations in gravity can be measured. Applying numerical
corrections for latitude, height above sea level, tides and local
terrain we arrive at a value of Bouguer gravity. Bouguer
gravity values relate to local crustal density variations.
Negative Bouguer gravity means that the local crustal density
is lower than average (e.g. acid igneous rocks or sedimentary
basins). Positive Bouguer gravity values are the opposite,
indicating that the local crustal rock densities are higher than
average (e.g. basic igneous rocks).
189.
METHODS OF GEOLOGICALMAPPING
There are four main passive systems
Geophysical Aids to Mapping
Magnetic measurements
The Earth has its own magnetic field, but other magnetic
fields can be produced by subsurface rocks containing the
mineral magnetite. By mapping the Earth’s field using a
portable magnetometer the presence of magnetite can be
detected in buried geology by mapping local anomalies in the
overall background Earth’s field. Magnetometry is popular in
archaeological mapping but is also regularly used in field
geological mapping to map basic igneous dykes and sills or
metalliferous orebodies containing magnetite
190.
METHODS OF GEOLOGICALMAPPING
There are four main passive systems
Geophysical Aids to Mapping
Electrical self-potential
If the local geology contains metalliferous minerals below the
groundwater table, electrochemical reactions can produce a
natural electrical voltage rather like a car battery. These
voltages, typically less than 1V, can be mapped using a simple
voltmeter and two non-polarising electrodes
191.
METHODS OF GEOLOGICALMAPPING
There are four main passive systems
Geophysical Aids to Mapping
Radiometry
Acid igneous rocks, rich in potassium feldspar, contain
sufficient 40K (potassium-40) to enable them to be
distinguished from rocks with less K-feldspar nearby if a
sufficiently sensitive instrument is used and the soil cover is
thin. A gamma-ray spectrometer (scintillometer) will detect
these differences although the older Geiger counter cannot.
192.
METHODS OF GEOLOGICALMAPPING
active systems include
Geophysical Aids to Mapping
Seismic refraction
The travel times and velocities of compressional P-waves and
shear S-waves are measured through the shallow subsurface.
Usually a sledgehammer acts as the seismic source and a
recording system of 48 geophones is used to measure the
travel times. By interpreting the travel times and ray paths
taken through different geological layers, simple estimates of
the depth to bedrock under the superficial cover can be
made.
193.
METHODS OF GEOLOGICALMAPPING
active systems include
Geophysical Aids to Mapping
Seismic reflection
Seismic reflection is the main technique employed in the
multi-million-dollar hydrocarbon industries on land and sea.
‘Images’ of the subsurface in 2D or 3D are produced by
bouncing compressional P-waves off each geological layer in
turn down to many kilometres depth. The reflection method
is highly complex and financially beyond most mapping
exercises.
194.
METHODS OF GEOLOGICALMAPPING
active systems include
Geophysical Aids to Mapping
Electrical resistivity
Resistivity can be used to find the faulted contact between
two rock units of different resistivities or the presence of
metallifeous ores, but a popular application of electrical
resistivity is for hydrogeological exploration. The presence of
groundwater makes a rock electrically conductive, so shallow
zones of high conductivity within an ‘image’ can imply the
presence of groundwater.
195.
METHODS OF GEOLOGICALMAPPING
active systems include
Geophysical Aids to Mapping
Electromagnetic ground conductivity
Metal detectors’ are one type of ground conductivity
instrument, but for geological mapping more specialised
systems with greater depths of penetration are employed.
Systems such as the EM-31 or GEM-2 are often linked up to
GPS units and set to automatically take a ground conductivity
reading every second together with its location. By walking
over a mapping area with such a system, a ground
conductivity map can be made as an aid to geological
mapping
196.
METHODS OF GEOLOGICALMAPPING
active systems include
Geophysical Aids to Mapping
Ground probing radar (GPR)
Although ground probing radar (GPR) is widely used in
archaeological mapping it has limited use in geological
mapping.
, the three that are most commonly used regularly in
combination with geological mapping are magnetometry,
radiometry and E/M ground conductivity.
197.
METHODS OF GEOLOGICALMAPPING
Photogeology
Photogeology is the systematic interpretation of
geology from aerial photographs. It can be used as a
method of geological reconnaissance with only
limited ground checking, or as an adjunct to
orthodox geological mapping. This described in the
previous section. The following figure is an example
to mapping from aerial photographs.
198.
METHODS OF GEOLOGICALMAPPING
Photogeological features
• Tone results from ground reflectivity. It varies with changing light conditions.
Sudden changes of tone on a single photograph may indicate a change in rock-type
owing to a change in vegetation or weathering characteristics.
• Texture is a coarser feature caused by erosional characteristics. Limestones
have a rough texture; soft shales are often recognisable by a micro-drainage
pattern.
• Lineaments are any straight, arcuate or regularly sinuous features of
geologically uncertain significance seen on photographs. They may show in the
drainage as vegetation changes: thin lines of lusher vegetation in arid bushland,
perhaps resulting from faults, master joints, contacts or for some other geological
reason allowing water to seep closer to the surface. The cause of some lineaments
may never be discovered.
• Vegetation is an excellent guide to geology and changes can usually be more
easily seen on colour photographs than on the ground. It contributes to both tone
and texture.
• Alluvium, swamps, marshes and so on are quite distinctive on photographs
and their boundaries can usually be mapped better from photographs than on the
ground.
199.
METHODS OF GEOLOGICALMAPPING
Photogeological features
• Check your interpretation on the ground and against your field map (Fig.
6.1). Amend as necessary and transfer your photogeological information to your
field map in the appropriate colours to distinguish photogeological data from other
information. If you are mapping directly onto transparent overlays to photographs
in lieu of a field map, show any information mapped or confirmed on the ground in
black. Always distinguish the two sources of information. After the mapping
programme is complete your interpreted photogeological overlay can be digitally
scanned and geo-referenced to form a layer in a GIS database.

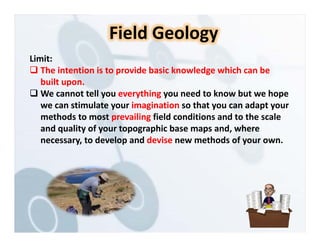
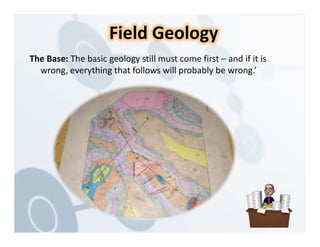
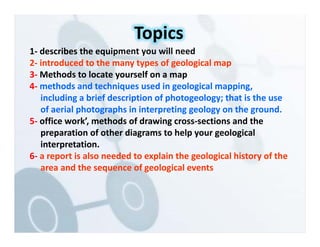
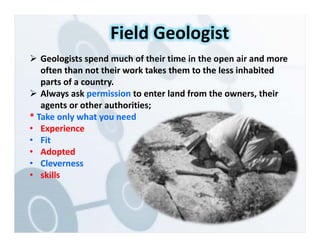
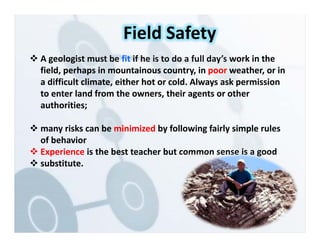
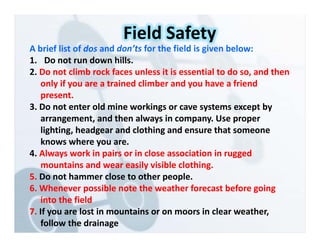
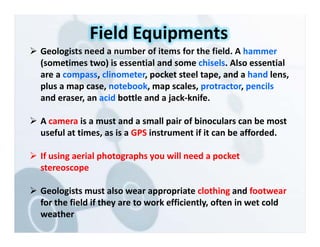
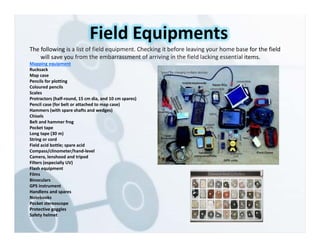
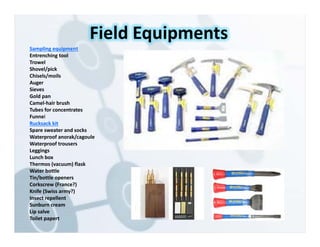
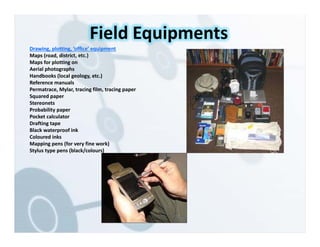
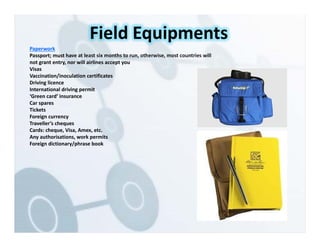

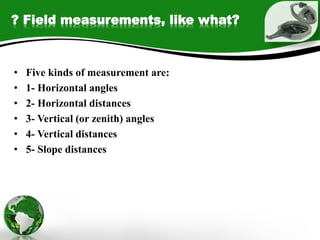
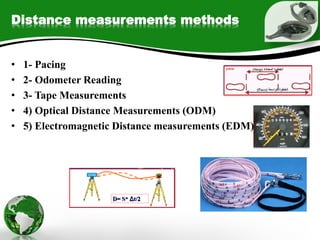
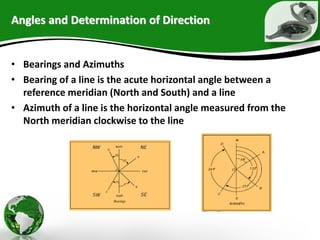
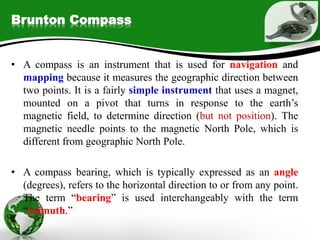
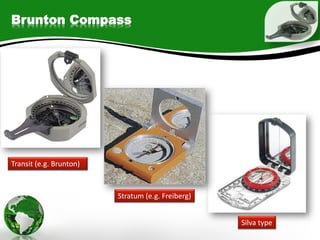
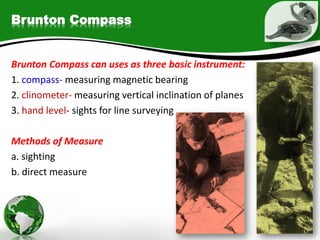
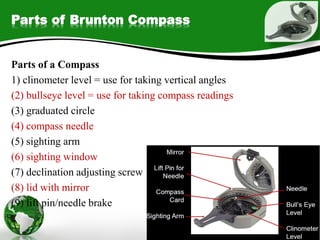
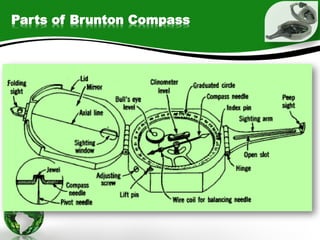
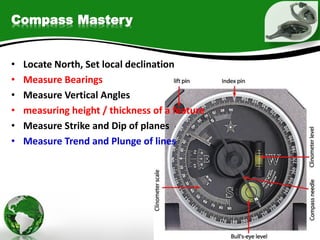
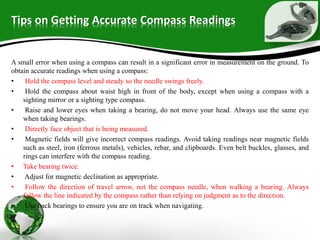
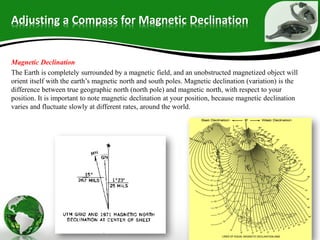
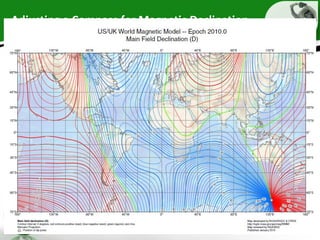
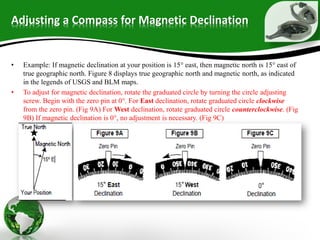
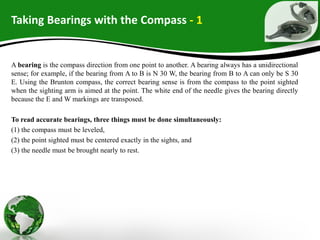
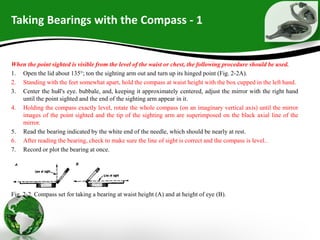
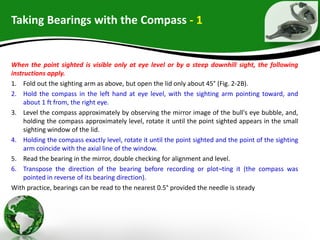
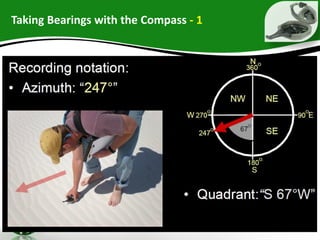
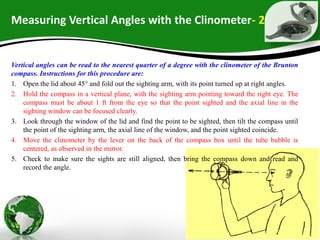
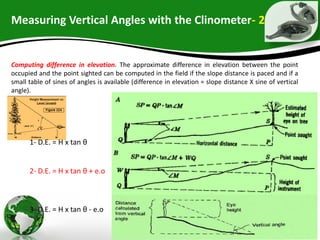
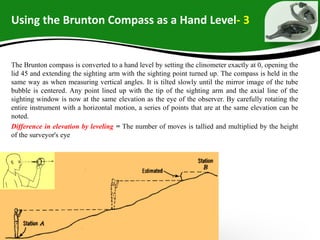
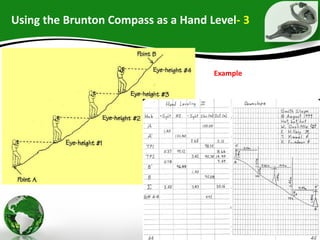
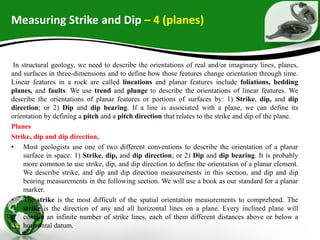
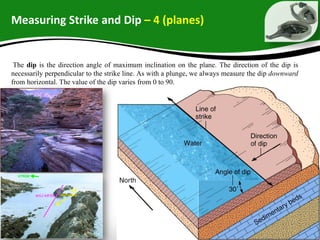
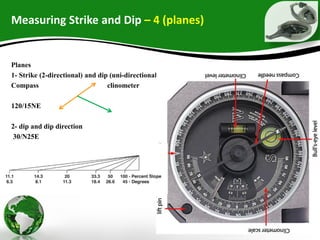
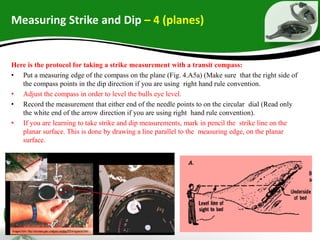
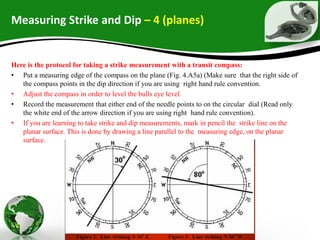
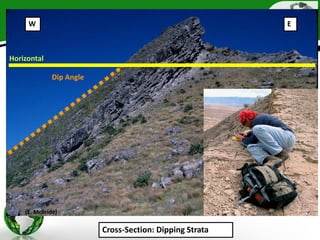
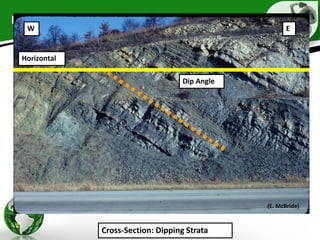
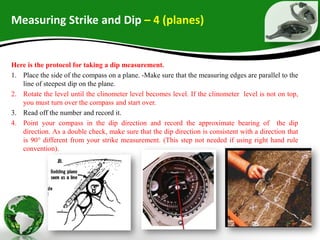
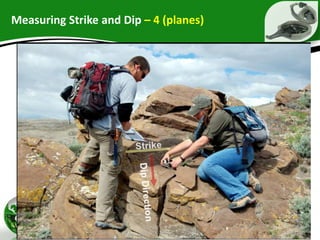
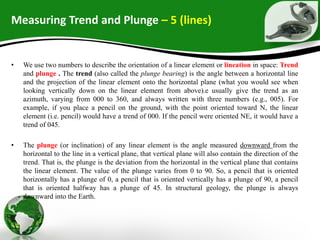
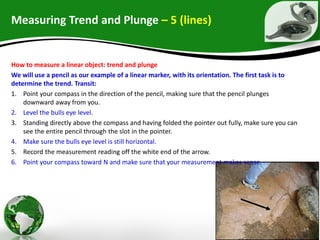
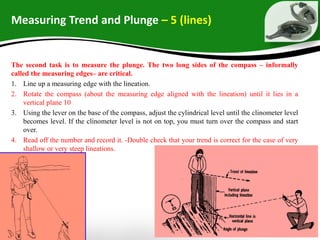
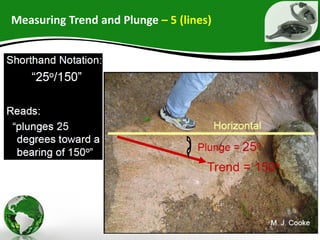
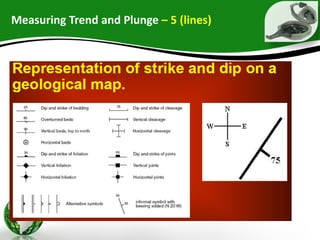


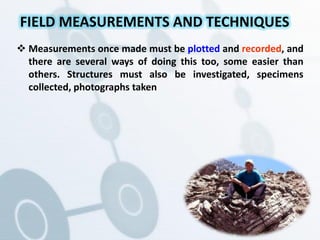
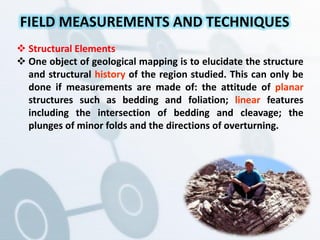
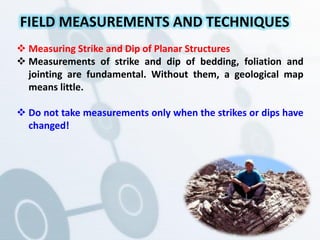
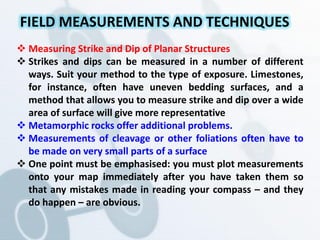
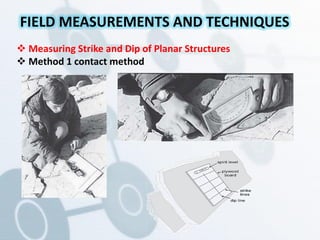
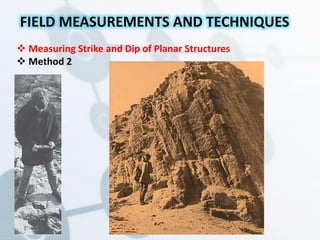
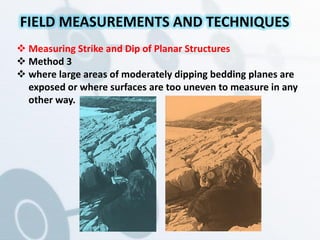
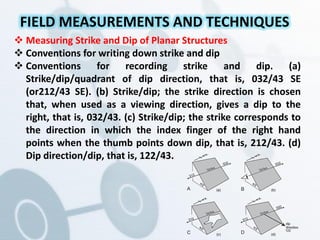
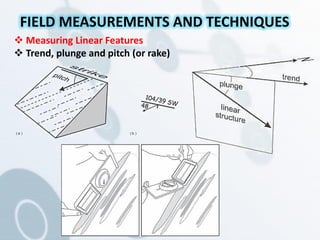
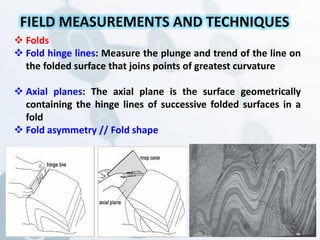
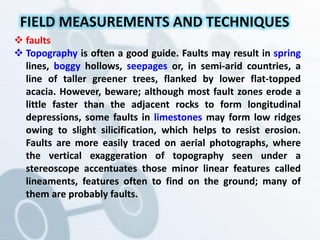

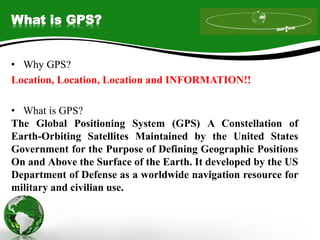

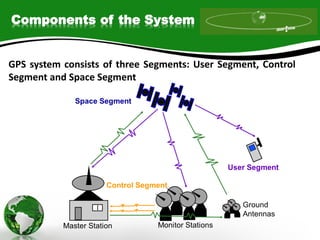
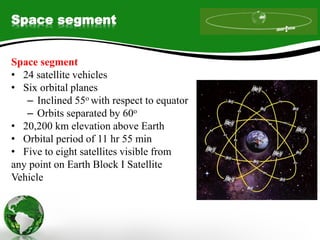
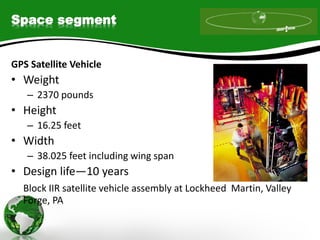
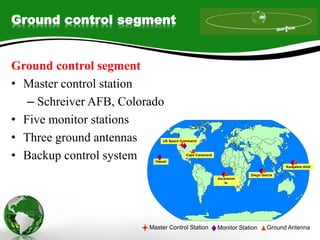
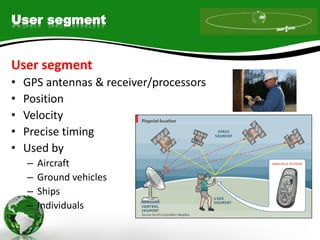
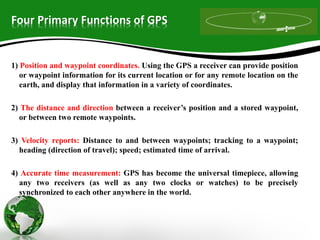
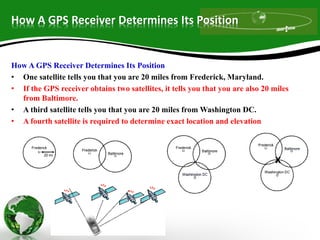
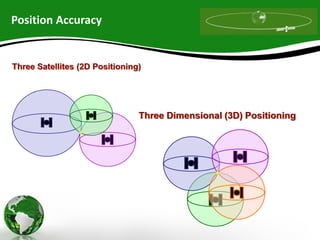
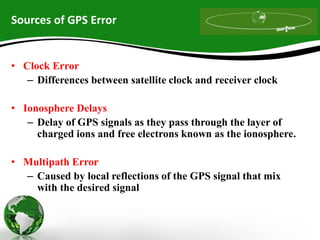
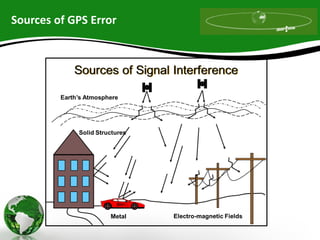
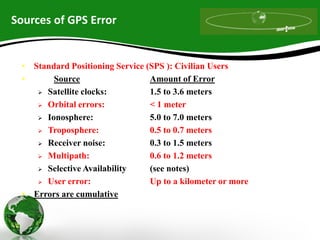
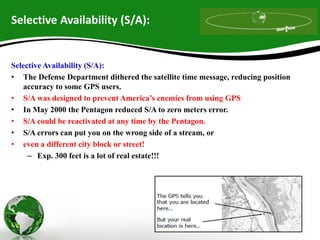
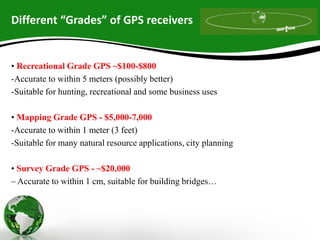
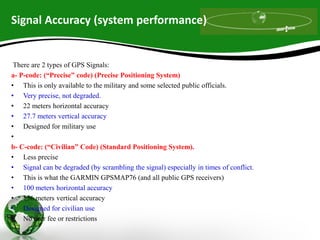
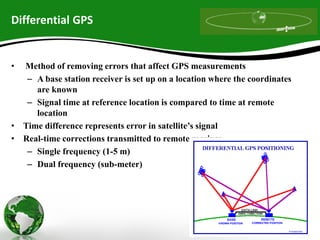

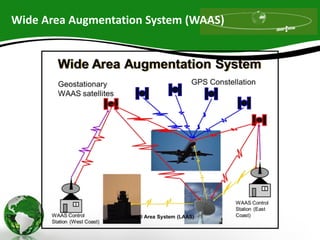
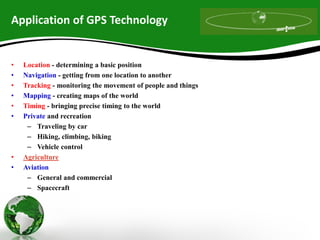


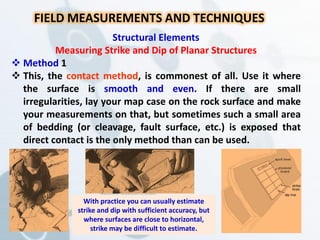
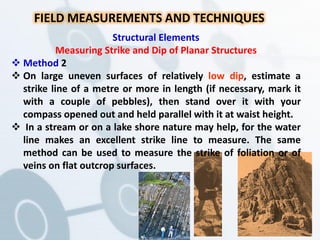
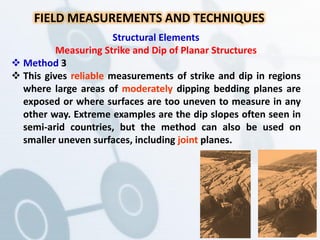
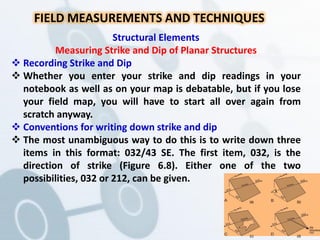
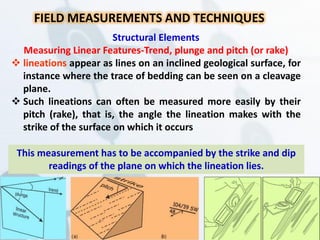
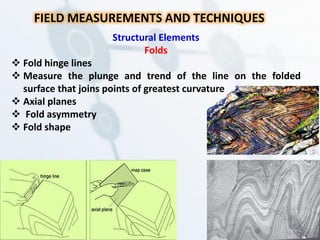
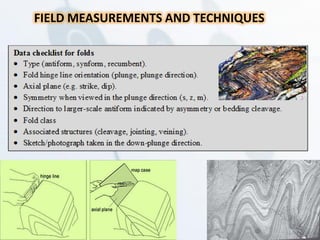
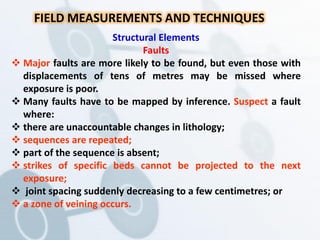
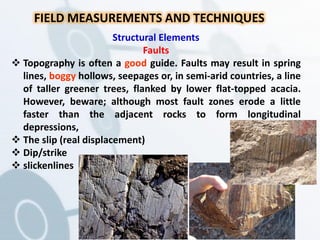

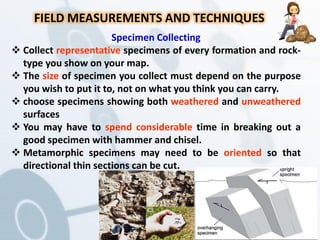
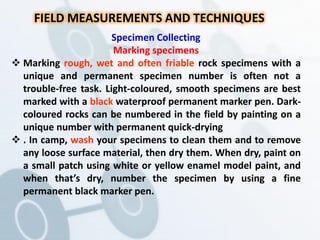
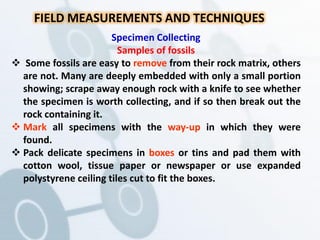

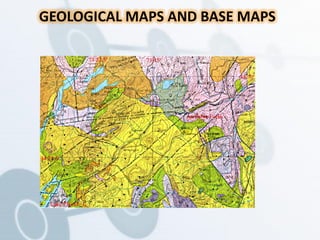
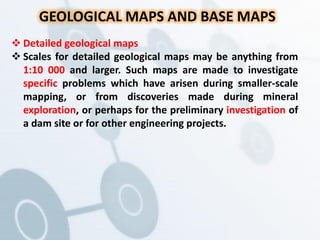
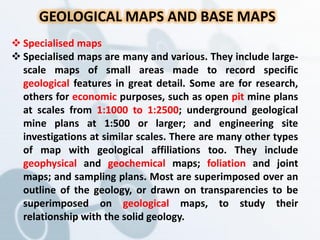
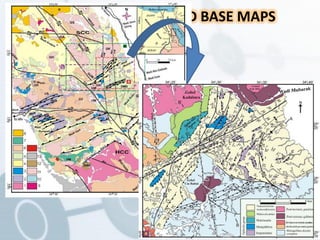
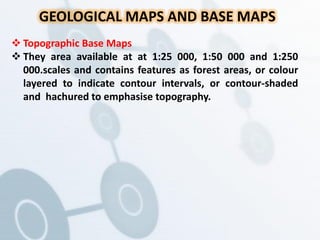
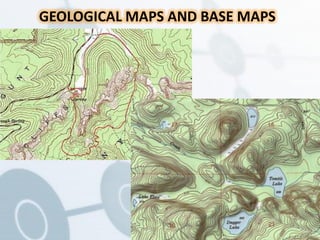

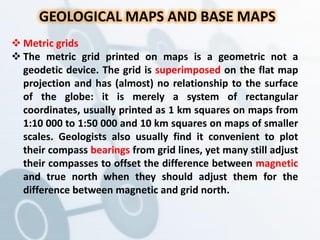
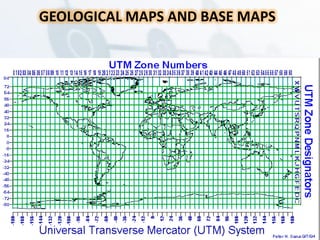
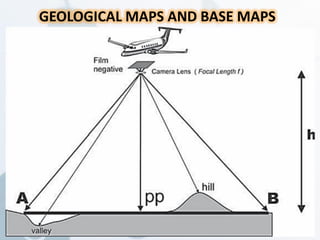
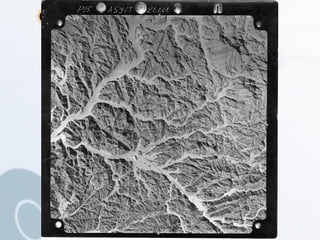
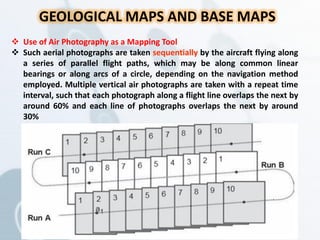
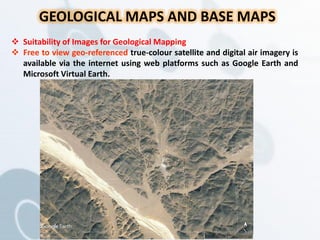
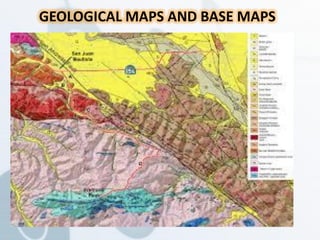
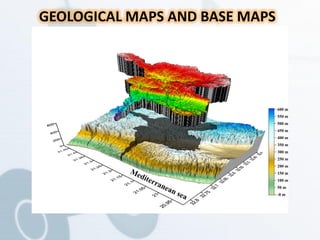
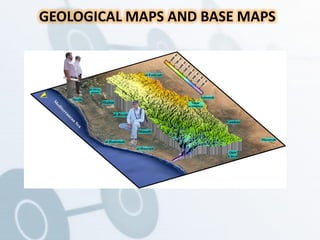
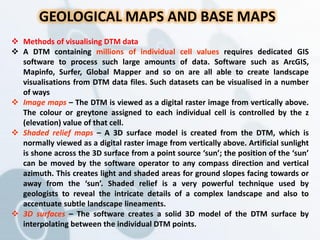
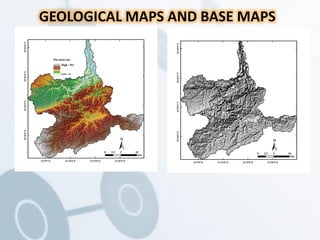
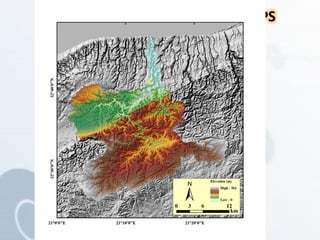

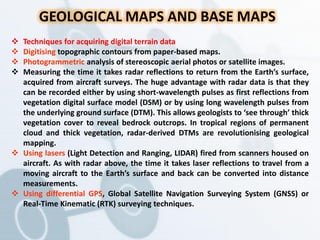
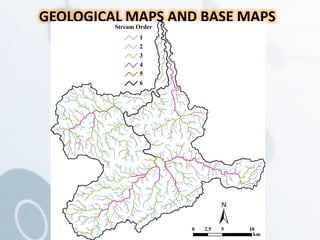


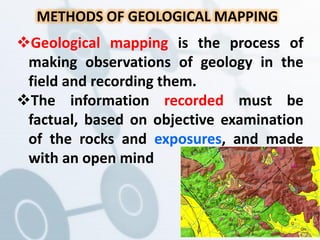

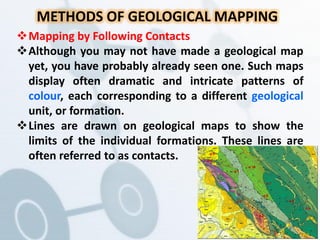
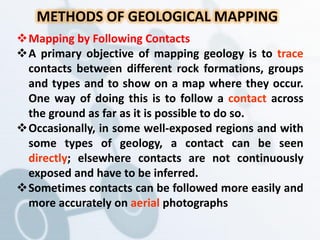
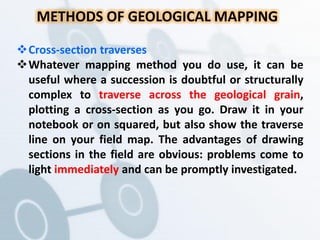
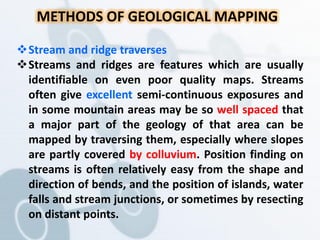
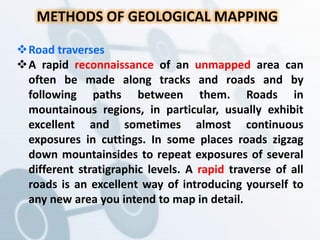

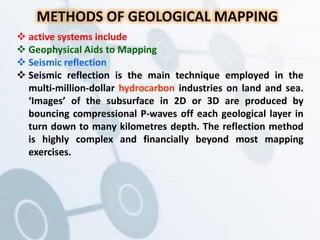
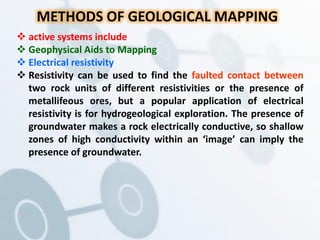

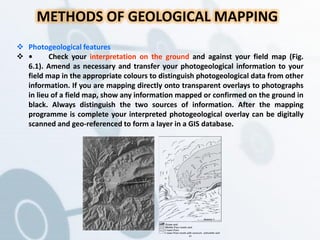


![Module-II SURVEYING-I [BTCVC304]](https://cdn.slidesharecdn.com/ss_thumbnails/module-ii-191020180034-thumbnail.jpg?width=640&height=640&fit=bounds)


