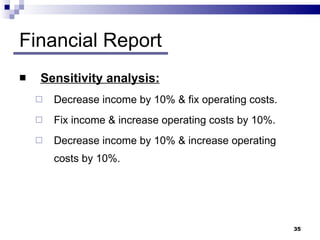
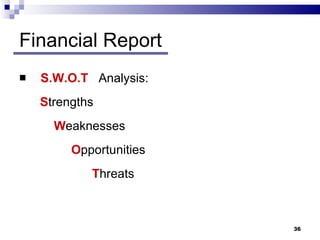
Feasibility Studies
Definition  A process where,  prior to the execution of any given project,   all aspects of the said project Marketing Technical  Financial are assessed and evaluated under the  prevailing conditions of the local economy  where the project is to be executed.
Contents  A feasibility study report should include: Index. Introduction.  Executive summary. Marketing report. Technical report. Financial report. Appendixes.
Index (Table of contents) Serves as an easy reference to various topics in the feasibility report. Format: Main title  page no. Subtitle  page no.   It’s important to write the  accurate page no. in front of each title.
Introduction (Preface) A short & precise description of the project.
Executive summary It summarizes the significant results of each part of the feasibility study (i.e. marketing, technical & financial) It should be  short & precise containing all the important results of the study, in order to enable executives to make an initial decision.
Marketing Report Product Description  Product Identification.  Technical Specification. Applied Standards. Targeted Customers.
Marketing Report Market Survey  Market Size Historical Demand (5 years Min). Future Demand( Specify Projection Method). Market Gap. Identification of competitive brands. Prices. Market Share. Producers. Agents.
Marketing Report Market Survey  Local Production List of local producing Plants (Name, Licensed Capacity, and Actual Capacity) List of Plants under Construction. Local Import Quantity. Value. Source of Import.
Marketing Report Results  Proposed production Capacity. Projected Market Share. Recommended Marketing Strategies. Targeted Market Segment. Competitive Edge. Projected Selling Prices. Promotion Plans. Sales Strategies (i.e. Targeted Markets, Distribution Channels, and Points of Sales).
Technical Report Production Process: Process Description. Process Flow Chart.
Process Flow Chart (Phase I) RAW MATERIALS LEAD ORE PHASE II SCRAP BATTERIES OTHER LEAD SCRAP B.PLATES / DROSS / OXIDE / PASTE ETC BATTERY BREAKING SYSTEM METALLIC LEAD LEAD PASTE POLY PROPYLENE CHIPS WASHING&DRYING Sold To Third party
Process Flow Chart (Phase II) SMELTING SECTION HEAVY SLAG / /METALLIC PHASE III FLUE DUST C WITH CHEMICALS POLUTION CONTROL/ EXHAUST SYSTEM CRUDE LEAD FURNACE SLAG SEGRAGATION SAMPLE FOR TEST LIGHT SLAG DISPOSAL
Process Flow Chart (Phase III) REFINING SECTION SAMPLE ANALYSIS STORES CHARGING / MELTING MOULDING KETTLES REFINING PROCESS BLENDING & ALLOYING LEAD ALLOYS PURE LEAD – 99.97(MIN) SOFTENING ANALYSIS AT EVERY STAGE
Technical Report Production Capacity: Capacity at full Production. Yearly Targeted Production. Full Production Capacity 10,000 MT/year Yearly Production Schedule Year 1 Year 2 Year 3 Year 4 Year 5 Quantity % Quantity % Quantity % Quantity % Quantity % 5,000 50 6,000 60 7,000 70 8,000 80 10,000 100
Technical Report Land and location: Proposed location (Justification). Total Area Required. Land Value or Annual Rent. Buildings: Production Building. Stores and Warehouses. Administration Offices. Total Buildup Area. Landscape. Specification  Analysis of Offers.
No. Building type Area (m 2 ) Cost /m 2   (S.R) Total cost (S.R) 1 Production bldg. 2500 600 1,500,000 2 Offices 500 1000 500,000 3 Raw material warehouse 2000 300 600,000 4 Finished goods store 1000 400 400,000 Total  Build up area 6000 3,000,000
Technical Report Machinery and Equipments: Production Lines. Auxiliary Equipments.  Lap Equipments. Installation and Commissioning Schedules Analysis of Offers (Technical and Cost Analysis). Cost of Selected Machinery and Equipments.
Equipments & machineries analysis : Electricity  (Kwh) Water (m 3 ) Fuel  (l) Air (m 3 ) No.   Equipment  type Unit cost No. of Units  Total cost Utilities requirement  1 Rotary Furness 20,000 1 20,000 100 2 0.5 20
Technical Report Raw Materials: Production raw materials. Packaging materials. List By :  Type – Source – Quantity per unit of production - Unit Price  - Yearly Requirement – Total Cost
Raw material cost / Unit : No. Item  Source  Cost / U (S.R) Q / U of production Cost / U of production (S.R) 1 Scrap batteries Local  200/mt 1.8mt/mt 360 2 Soda ash Imported  1000/mt 0.1mt/mt 100 3 Iron chips Local  1000/mt 0.04mt/mt 40 4 Wooden palettes Local  160 each 0.5/mt 80 5 Straps  Local  5/lm 4lm/mt 20 Total cost of raw material for each ton of finished product  S.R 600
Yearly total cost of Raw material : year 1 2 3 4 5 Targeted production 5,000 6,000 7,000 8,000 10,000 Unit cost 600 600 600 600 600 Total cost 3,000,000 3,600,000 4,200,000 4,800,000 6,000,000
Technical Report Transportation Equipments: Forklift. Trucks and Vans. Buses. Cars.  Furniture: Office Equipments Office Furniture. Accommodation Furniture.  Utilities: Electrical Power. Water. Fuel. List yearly Requirements and cost.
Technical Report Manpower Requirements: Management Staff. Technical Staff: Production. Maintenance. Lab. Supporting Staff:  Labors. Drivers. Security. Proposed Salary Scale. Proposed yearly total manpower cost (Salaries & benefits) Proposed Organization chart.
Yearly manpower requirements : No. Position  Year 1 Year 2 Year 3 Year 4 Year 5 1 G. Manager 1 1 1 1 1 2 P. Manager 1 1 1 2 2 3 M. Manager 1 1 1 2 2 4 Operator 10 12 14 16 20 5 Labor  10 12 14 16 20
Proposed salary scale : No. Position  Basic salary/ month benefits Total monthly package Annual cost 1 G. Manager 10,000 5,000 15,000 180,000 2 P. Manager 8,000 4,000 12,000 144,000 3 M. Manager 6,000 3,000 9,000 108,000 4 Operator 1,500 500 2,000 24,000 5 Labor  900 300 1,200 14,400
Organization Chart Executive General Manager Marketing Manager Accounts Supervisor Accountant Secretary Financial Manager Cashier Warehouse  Human Resources Manager Administration Supervisor shifts supervisor operating Supervisor Government  Affairs Personnel Supervisor Production Manager Lab Supervisor Sales man
Financial Report Total Investment: Fixed Capital: Fixed Assets. Land. Buildings. Machinery and Equipments. Vehicles. Furniture.  Pre-operating Expenses.  Cost of Feasibility Studies. Cost of Engineering Drawings. Licenses and Registrations. Recruitment cost. Pre-operating Salary.
Financial Report Total Investment: Working Capital:  Months of 1 st  operational year Total Operating Cost.( Based on business nature ) Salaries and benefits. Row materials. Utilities. Maintenance Cost. Consumables. Marketing Expenses. Transportation cost. Rent. Other Acquired Services: Legal.  CPA.
Financial Report Sources of Funds: Paid up capital. Loans. Governmental loans. Commercial loans. Partners loan.
Financial Report Financial Statements: In order to prepare the financial statements, the following schedules have to be prepared: Loan’s repayment schedule. Yearly income statement. Depreciation & Amortization schedule. Annual Maintenance table.
Financial Report Financial Statements: Profit & loss statement. Cash flow statement. Balance sheet.
Financial Report Financial Indicators: ROI  :  Net Profit before tax / total investment. ROE  :  Net Income / Owners Equity. IRR :  the discount rate that makes estimated NPV of an investment = 0 Break   even point  :  Fixed cost/(Selling Price – Variable cost) Payback   period  :  length of time until the sum of cash flow = Initial Investment
Financial Report Sensitivity analysis: Decrease income by 10% & fix operating costs. Fix income & increase operating costs by 10%. Decrease income by 10% & increase operating costs by 10%.
Financial Report S.W.O.T  Analysis: S trengths W eaknesses O pportunities T hreats
Appendix  Classified files of all working documents organized in alphabetical order for easy reference.
General Tips Use simple English language. Avoid using long paragraphs. Use appropriate charts to represent data. Line Chart Pie Chart Bar Chart Sometimes called a frequency polygon showing trends through time. Sometimes called a histogram showing comparisons through certain time. Shows percentages of division of the whole or parts of the whole
General Tips Use facts & not assumptions. Indicate your source of information. Review the study for any contradictions in figures or information or any illogical sequences. Be always in touch with your clients through: Progress reports. Draft reports of various parts of the feasibility study. Submit draft of F.S for remarks and approval. Be honest. Always remember a great presentation leaves good impression on your client.

Feasibility studies

  • 1.
  • 2.
    Definition Aprocess where, prior to the execution of any given project, all aspects of the said project Marketing Technical Financial are assessed and evaluated under the prevailing conditions of the local economy where the project is to be executed.
  • 3.
    Contents Afeasibility study report should include: Index. Introduction. Executive summary. Marketing report. Technical report. Financial report. Appendixes.
  • 4.
    Index (Table ofcontents) Serves as an easy reference to various topics in the feasibility report. Format: Main title page no. Subtitle page no. It’s important to write the accurate page no. in front of each title.
  • 6.
    Introduction (Preface) Ashort & precise description of the project.
  • 7.
    Executive summary Itsummarizes the significant results of each part of the feasibility study (i.e. marketing, technical & financial) It should be short & precise containing all the important results of the study, in order to enable executives to make an initial decision.
  • 8.
    Marketing Report ProductDescription Product Identification. Technical Specification. Applied Standards. Targeted Customers.
  • 9.
    Marketing Report MarketSurvey Market Size Historical Demand (5 years Min). Future Demand( Specify Projection Method). Market Gap. Identification of competitive brands. Prices. Market Share. Producers. Agents.
  • 10.
    Marketing Report MarketSurvey Local Production List of local producing Plants (Name, Licensed Capacity, and Actual Capacity) List of Plants under Construction. Local Import Quantity. Value. Source of Import.
  • 11.
    Marketing Report Results Proposed production Capacity. Projected Market Share. Recommended Marketing Strategies. Targeted Market Segment. Competitive Edge. Projected Selling Prices. Promotion Plans. Sales Strategies (i.e. Targeted Markets, Distribution Channels, and Points of Sales).
  • 12.
    Technical Report ProductionProcess: Process Description. Process Flow Chart.
  • 13.
    Process Flow Chart(Phase I) RAW MATERIALS LEAD ORE PHASE II SCRAP BATTERIES OTHER LEAD SCRAP B.PLATES / DROSS / OXIDE / PASTE ETC BATTERY BREAKING SYSTEM METALLIC LEAD LEAD PASTE POLY PROPYLENE CHIPS WASHING&DRYING Sold To Third party
  • 14.
    Process Flow Chart(Phase II) SMELTING SECTION HEAVY SLAG / /METALLIC PHASE III FLUE DUST C WITH CHEMICALS POLUTION CONTROL/ EXHAUST SYSTEM CRUDE LEAD FURNACE SLAG SEGRAGATION SAMPLE FOR TEST LIGHT SLAG DISPOSAL
  • 15.
    Process Flow Chart(Phase III) REFINING SECTION SAMPLE ANALYSIS STORES CHARGING / MELTING MOULDING KETTLES REFINING PROCESS BLENDING & ALLOYING LEAD ALLOYS PURE LEAD – 99.97(MIN) SOFTENING ANALYSIS AT EVERY STAGE
  • 16.
    Technical Report ProductionCapacity: Capacity at full Production. Yearly Targeted Production. Full Production Capacity 10,000 MT/year Yearly Production Schedule Year 1 Year 2 Year 3 Year 4 Year 5 Quantity % Quantity % Quantity % Quantity % Quantity % 5,000 50 6,000 60 7,000 70 8,000 80 10,000 100
  • 17.
    Technical Report Landand location: Proposed location (Justification). Total Area Required. Land Value or Annual Rent. Buildings: Production Building. Stores and Warehouses. Administration Offices. Total Buildup Area. Landscape. Specification Analysis of Offers.
  • 18.
    No. Building typeArea (m 2 ) Cost /m 2 (S.R) Total cost (S.R) 1 Production bldg. 2500 600 1,500,000 2 Offices 500 1000 500,000 3 Raw material warehouse 2000 300 600,000 4 Finished goods store 1000 400 400,000 Total Build up area 6000 3,000,000
  • 19.
    Technical Report Machineryand Equipments: Production Lines. Auxiliary Equipments. Lap Equipments. Installation and Commissioning Schedules Analysis of Offers (Technical and Cost Analysis). Cost of Selected Machinery and Equipments.
  • 20.
    Equipments & machineriesanalysis : Electricity (Kwh) Water (m 3 ) Fuel (l) Air (m 3 ) No. Equipment type Unit cost No. of Units Total cost Utilities requirement 1 Rotary Furness 20,000 1 20,000 100 2 0.5 20
  • 21.
    Technical Report RawMaterials: Production raw materials. Packaging materials. List By : Type – Source – Quantity per unit of production - Unit Price - Yearly Requirement – Total Cost
  • 22.
    Raw material cost/ Unit : No. Item Source Cost / U (S.R) Q / U of production Cost / U of production (S.R) 1 Scrap batteries Local 200/mt 1.8mt/mt 360 2 Soda ash Imported 1000/mt 0.1mt/mt 100 3 Iron chips Local 1000/mt 0.04mt/mt 40 4 Wooden palettes Local 160 each 0.5/mt 80 5 Straps Local 5/lm 4lm/mt 20 Total cost of raw material for each ton of finished product S.R 600
  • 23.
    Yearly total costof Raw material : year 1 2 3 4 5 Targeted production 5,000 6,000 7,000 8,000 10,000 Unit cost 600 600 600 600 600 Total cost 3,000,000 3,600,000 4,200,000 4,800,000 6,000,000
  • 24.
    Technical Report TransportationEquipments: Forklift. Trucks and Vans. Buses. Cars. Furniture: Office Equipments Office Furniture. Accommodation Furniture. Utilities: Electrical Power. Water. Fuel. List yearly Requirements and cost.
  • 25.
    Technical Report ManpowerRequirements: Management Staff. Technical Staff: Production. Maintenance. Lab. Supporting Staff: Labors. Drivers. Security. Proposed Salary Scale. Proposed yearly total manpower cost (Salaries & benefits) Proposed Organization chart.
  • 26.
    Yearly manpower requirements: No. Position Year 1 Year 2 Year 3 Year 4 Year 5 1 G. Manager 1 1 1 1 1 2 P. Manager 1 1 1 2 2 3 M. Manager 1 1 1 2 2 4 Operator 10 12 14 16 20 5 Labor 10 12 14 16 20
  • 27.
    Proposed salary scale: No. Position Basic salary/ month benefits Total monthly package Annual cost 1 G. Manager 10,000 5,000 15,000 180,000 2 P. Manager 8,000 4,000 12,000 144,000 3 M. Manager 6,000 3,000 9,000 108,000 4 Operator 1,500 500 2,000 24,000 5 Labor 900 300 1,200 14,400
  • 28.
    Organization Chart ExecutiveGeneral Manager Marketing Manager Accounts Supervisor Accountant Secretary Financial Manager Cashier Warehouse Human Resources Manager Administration Supervisor shifts supervisor operating Supervisor Government Affairs Personnel Supervisor Production Manager Lab Supervisor Sales man
  • 29.
    Financial Report TotalInvestment: Fixed Capital: Fixed Assets. Land. Buildings. Machinery and Equipments. Vehicles. Furniture. Pre-operating Expenses. Cost of Feasibility Studies. Cost of Engineering Drawings. Licenses and Registrations. Recruitment cost. Pre-operating Salary.
  • 30.
    Financial Report TotalInvestment: Working Capital: Months of 1 st operational year Total Operating Cost.( Based on business nature ) Salaries and benefits. Row materials. Utilities. Maintenance Cost. Consumables. Marketing Expenses. Transportation cost. Rent. Other Acquired Services: Legal. CPA.
  • 31.
    Financial Report Sourcesof Funds: Paid up capital. Loans. Governmental loans. Commercial loans. Partners loan.
  • 32.
    Financial Report FinancialStatements: In order to prepare the financial statements, the following schedules have to be prepared: Loan’s repayment schedule. Yearly income statement. Depreciation & Amortization schedule. Annual Maintenance table.
  • 33.
    Financial Report FinancialStatements: Profit & loss statement. Cash flow statement. Balance sheet.
  • 34.
    Financial Report FinancialIndicators: ROI : Net Profit before tax / total investment. ROE : Net Income / Owners Equity. IRR : the discount rate that makes estimated NPV of an investment = 0 Break even point : Fixed cost/(Selling Price – Variable cost) Payback period : length of time until the sum of cash flow = Initial Investment
  • 35.
    Financial Report Sensitivityanalysis: Decrease income by 10% & fix operating costs. Fix income & increase operating costs by 10%. Decrease income by 10% & increase operating costs by 10%.
  • 36.
    Financial Report S.W.O.T Analysis: S trengths W eaknesses O pportunities T hreats
  • 37.
    Appendix Classifiedfiles of all working documents organized in alphabetical order for easy reference.
  • 38.
    General Tips Usesimple English language. Avoid using long paragraphs. Use appropriate charts to represent data. Line Chart Pie Chart Bar Chart Sometimes called a frequency polygon showing trends through time. Sometimes called a histogram showing comparisons through certain time. Shows percentages of division of the whole or parts of the whole
  • 39.
    General Tips Usefacts & not assumptions. Indicate your source of information. Review the study for any contradictions in figures or information or any illogical sequences. Be always in touch with your clients through: Progress reports. Draft reports of various parts of the feasibility study. Submit draft of F.S for remarks and approval. Be honest. Always remember a great presentation leaves good impression on your client.