Download to read offline


![Electroencephalography
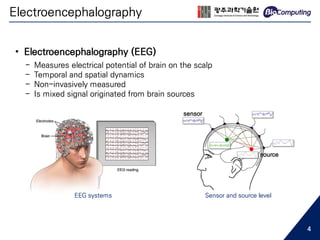
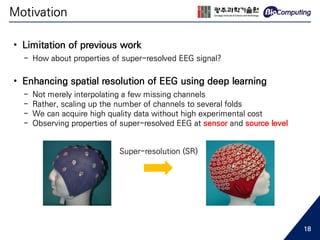
• Low spatial resolution EEG...
- May cause aliasing in spatial frequency [1]
Topological difference between 16 channels and 64 channels EEG
64 channels16 channels
6](https://image.slidesharecdn.com/sjhanmasterthesis180530-190719133936/85/Feasibility-of-EEG-Super-Resolution-Using-Deep-Convolutional-Networks-6-320.jpg)
![Electroencephalography
• Low spatial resolution EEG...
- Increasing the electrode number helps decrease localization error [2]
Mean source localization error for 5 subjects
7](https://image.slidesharecdn.com/sjhanmasterthesis180530-190719133936/85/Feasibility-of-EEG-Super-Resolution-Using-Deep-Convolutional-Networks-7-320.jpg)
![Deep Learning
• The success of deep learning ...
- Backpropagation appeared (1986) [3]
- Weight initialization by restricted Boltzmann machine (2010) [4]
- High accuracy in speech recognition (2012) [5]
- High accuracy in image classification (2012) [6]
- Image localization, detection, segmentation, ... super-resolution!
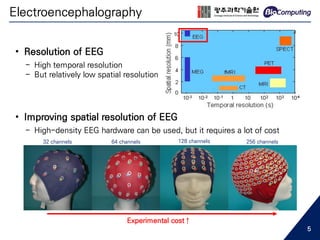
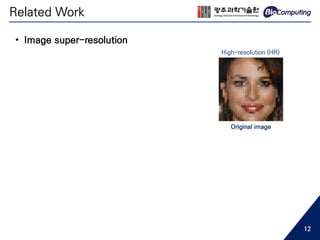
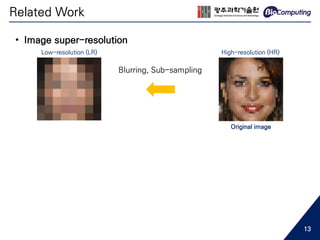
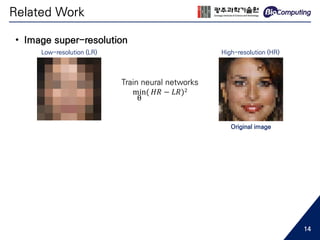
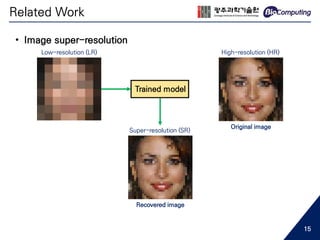
Super-resolution (SR)
Recovering a high-resolution image
from a single low-resolution image
• Image super-resolution
8](https://image.slidesharecdn.com/sjhanmasterthesis180530-190719133936/85/Feasibility-of-EEG-Super-Resolution-Using-Deep-Convolutional-Networks-8-320.jpg)
![• Image super-resolution
SRCNN, Dong et al. 2015 [7] DRCN, Kim et al. 2015 [8]
ESPCN, Shi et al. 2016 [9]
SRGAN, Ledig et al. 2016 [10]
Related Work
9](https://image.slidesharecdn.com/sjhanmasterthesis180530-190719133936/85/Feasibility-of-EEG-Super-Resolution-Using-Deep-Convolutional-Networks-9-320.jpg)
![• Image super-resolution
SRCNN, Dong et al. 2015 [7] DRCN, Kim et al. 2015 [8]
ESPCN, Shi et al. 2016 [9]
SRGAN, Ledig et al. 2016 [10]
How to optimize effectively and efficiently
by reconstructing networks’ structure
Related Work
10](https://image.slidesharecdn.com/sjhanmasterthesis180530-190719133936/85/Feasibility-of-EEG-Super-Resolution-Using-Deep-Convolutional-Networks-10-320.jpg)
![• Image super-resolution
SRCNN, Dong et al. 2015 [7] DRCN, Kim et al. 2015 [8]
ESPCN, Shi et al. 2016 [9]
SRGAN, Ledig et al. 2016 [10]
To satisfy human’s visual perception
with a new concept of loss function
Related Work
11](https://image.slidesharecdn.com/sjhanmasterthesis180530-190719133936/85/Feasibility-of-EEG-Super-Resolution-Using-Deep-Convolutional-Networks-11-320.jpg)
![• Audio super-resolution
- V. Kuleshov, 2017 [11]
- Regarded as generative model
- Temporally up-scaled
- Bandwidth extension, thus predicting higher frequencies
Related Work
16](https://image.slidesharecdn.com/sjhanmasterthesis180530-190719133936/85/Feasibility-of-EEG-Super-Resolution-Using-Deep-Convolutional-Networks-16-320.jpg)
![• EEG super-resolution
- I. A. Corley, 2018 [12]
- Mental imagery open dataset, 3 classes
- Spatially up-scaled, 16 to 32 channels (2x), 8 to 32 channels (4x)
- Evaluated SR performance by classification results
Related Work
17](https://image.slidesharecdn.com/sjhanmasterthesis180530-190719133936/85/Feasibility-of-EEG-Super-Resolution-Using-Deep-Convolutional-Networks-17-320.jpg)

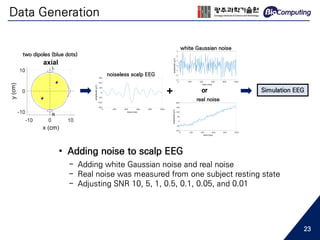
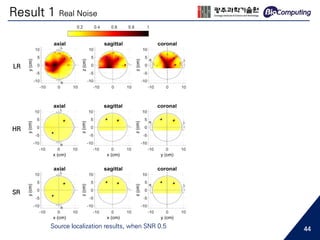
![Source Localization
+ Simulation EEG
noiseless scalp EEG
white Gaussian noise
real noise
or
two dipoles (blue dots)
• Source Localization
- Array-gain minimum variance beamformer [13]
- Beamforming scanned at a 7 mm scanning interval
- On 10,000 voxels
24](https://image.slidesharecdn.com/sjhanmasterthesis180530-190719133936/85/Feasibility-of-EEG-Super-Resolution-Using-Deep-Convolutional-Networks-24-320.jpg)
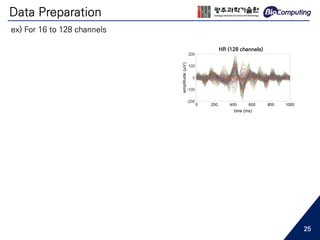
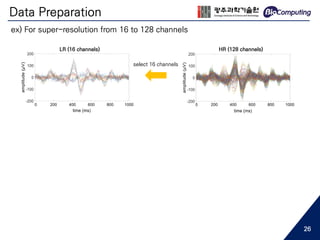

![Data Preparation
HR (128 channels)LR (16 channels)
select 16 channels
interpolated with
the average of its neighbor
LR (128 channels)
train neural networks
min
θ
( 𝐻𝑅 − 𝐿𝑅)2
- This is an ill-posed problem
- For good starting initialization [7]
16 to 32 (2x)
16 to 64 (4x)
16 to 128 (8x)
ex) For super-resolution from 16 to 128 channels
0 200 400 600 800 10000 200 400 600 800 1000
0 200 400 600 800 1000
28](https://image.slidesharecdn.com/sjhanmasterthesis180530-190719133936/85/Feasibility-of-EEG-Super-Resolution-Using-Deep-Convolutional-Networks-28-320.jpg)
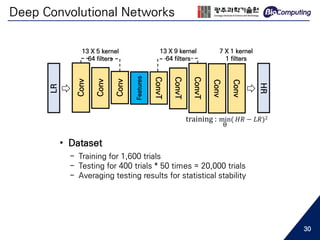
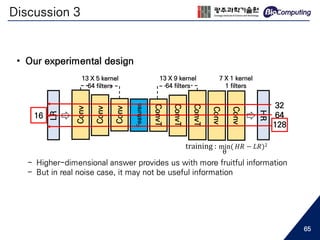
![Deep Convolutional Networks
LR
Conv
Conv
Conv
Features
ConvT
ConvT
ConvT
Conv
Conv
HR
13 X 5 kernel
64 filters
13 X 9 kernel
64 filters
7 X 1 kernel
1 filters
training : min
θ
( 𝐻𝑅 − 𝐿𝑅)2
• Settings
- Convolution for down-sampling
- Transposed convolution for up-sampling
- Adam optimizer (first-order gradient optimization) [14]
- He initializer [15]
- Linear activation function (y = x) was used
29](https://image.slidesharecdn.com/sjhanmasterthesis180530-190719133936/85/Feasibility-of-EEG-Super-Resolution-Using-Deep-Convolutional-Networks-29-320.jpg)


![Publication
• EEG super-resolution
[1] Sangjun Han, Moonyoung Kwon, Sung Chan Jun, “Feasibility Study of EEG Super-Resolution Using Deep Convolutional
Networks,” IEEE International Conference on Systems, Man, and Cybernetics, Oct 2018 (Submitted)
[2] Sangjun Han, Moonyoung Kwon, Sunghan Lee, Sung Chan Jun, “EEG Spatial Super-Resolution Using Deep Convolutional
Linear Networks : a Simulation Study,” Korean Society of Medical & Biological Engineering, Nov 2017 (Best Paper)
• EEG emotion classification using deep learning
[3] Sunghan Lee, Sangjun Han, Sung Chan Jun, “EEG-based Classification of Multi-class Emotional States Using One-
dimensional Convolutional Neural Networks,” 7th Graz BCI Conference, July 2017
[4] Sunghan Lee, Sangjun Han, Sung Chan Jun, “Four-Class Emotion Classification Using One-dimensional Convolutional
Neural Networks - An EEG Study,” Society for Neuroscience, Nov 2017
• Improving sleep quality by acoustic stimulation
[5] Jinyoung Choi, Sangjun Han, Moonyoung Kwon, Hyeon Seo, Sehyeon Jang, Sung Chan Jun, “Study on Subject-Specific
Parameters in Sleep Spindle Detection Algorithm,” The IEEE Engineering in Medicine and Biology Conference, July 2017
[6] Jinyoung Choi, Sangjun Han, Kyungho Won, Sung Chan Jun, “Effect of Acoustic Stimulation after Sleep Spindle Activity,”
Sleep Medicine, Oct 2017
[7] Jinyoung Choi, Sangjun Han, Kyungho Won, Sung Chan Jun, “The Neurophysiological Effect of Acoustic Stimulation with
Real-time Sleep Spindle Detection,” The IEEE Engineering in Medicine and Biology Conference, July 2018
Refereed Conference Paper
71](https://image.slidesharecdn.com/sjhanmasterthesis180530-190719133936/85/Feasibility-of-EEG-Super-Resolution-Using-Deep-Convolutional-Networks-71-320.jpg)
![References
[1] D. M. Tucker, “Spatial Sampling of Head Electrical Fields: The Geodesic Sensor Net,” Electroencephalography and
Clinical Neurophysiology, vol. 87, pp. 154–163, September 1993.
[2] A. Sohrabpour, Y. Lu, P. Kankirawatana, J. Blount, H. Kim, and B. He, “Effect of EEG Electrode Number on Epileptic
Source Localization in Pediatric Patients,” Clinical Neurophysiology, vol. 126, pp. 472-480, December 2015.
[3] D. E. Rumelhart, G. E. Hinton, and R. J. Williams, “Learning Representations by Back-propagating errors,” Nature,
vol. 323, pp. 533-536, October 1986.
[4] G. E. Hinton, “A Practical Guide to Training Restricted Boltzmann Machines,” Lecture Notes in Department of
Computer Science, University of Toronto, August 2010.
[5] D. George, Y. Dong, D. Li and A. Alex, “Context-Dependent Pre-Trained Deep Neural Networks for Large-
Vocabulary Speech Recognition,” IEEE Transactions on Audio, Speech, and Language Processing, vol. 20, no. 1, pp. 30-
42, January 2012.
[6] K. Alex, S. Ilya and H. Geoffrey, “ImageNet Classification with Deep Convolutional Neural Networks,” in Proceedings
of the Neural Information Processing Systems, December 2012.
[7] C. Dong, C. C. Loy, and X. Tang, “Image Super-Resolution Using Deep Convolutional Networks,” IEEE Transactions
on Pattern Analysis and Machie Intelligence, vol. 38, pp. 295–307, June 2015.
[8] J. Kim, J. K. Lee, and L. M. Lee, “Deeply-Recursive Convolutional Network for Image Super-Resolution,” Conference
on Computer Vision and Pattern Recognition, pp. 1637–1645, June 2016.
[9] W. Shi, J. Caballero, F. Huszar, J. Totz, A. P. Aitken, R. Bishop, D. Rueckert, and Z. Wang, “Real-Time Single Image
and Video Super-Resolution Using an Efficient Sub-Pixel Convolutional Neural Network,” Conference on Computer
Vision and Pattern Recognition, pp. 1874–1883, June 2016.
[10] C. Ledig, L. Theis, F. Huszar, J. Caballero, A. Cunningham, A. Acosta, A. Aitken, A. Tejani, J. Totz, Z. Wang, amd W.
Shi, “Photo-Realistic Single Image Super-Resolution Using a Generative Adversarial Network,” Conference on Computer
Vision and Pattern Recognition, pp. 4681–4690, July 2017.
[11] V. Kuleshov, S. Z. Enam, and S. Ermon, “Audio Super-Resolution Using Neural Nets,” Workshop of International
Conference on Learning Representation, April 2017.
[12] I. A. Corley, and Y. Huang, “Deep EEG Super-Resolution: Upsampling EEG Spatial Resolution with Generative
Adversarial Networks,” IEEE EMBS International Conference on Biomedical & Health Informatics, March 2018
[13] K. Sekihara, and S. S. Nagarajan, Adaptive Spatial Filters for Electromagnetic Brain Imaging, 1st ed., Springer-Verlag
Berlin Heidelberg, 2008.
[14] P. Kingma, and J. Ba, “ADAM: A Method for Stochastic Optimization,” International Conference on Learning
Representation, arXiv:1412.6980, May 2015.
[15] K. He, X, Zhang, S. Ren, and J. Sun, “Delving Deep into Rectifiers: Surpassing Human-Level Performance on
ImageNet Classification,” International Conference on Computer Vision, pp. 1026–1034, December 2015. 72](https://image.slidesharecdn.com/sjhanmasterthesis180530-190719133936/85/Feasibility-of-EEG-Super-Resolution-Using-Deep-Convolutional-Networks-72-320.jpg)


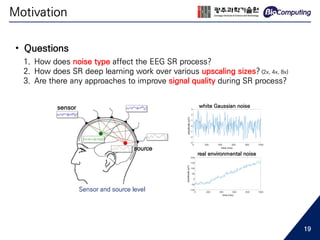
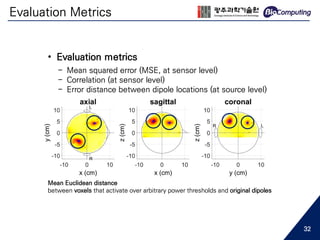
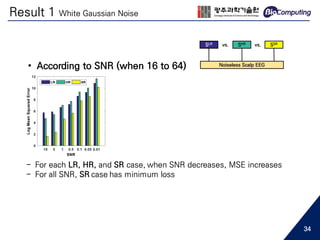
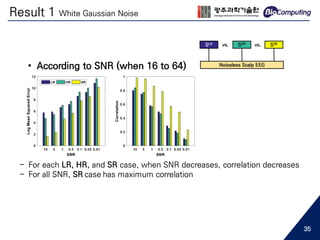
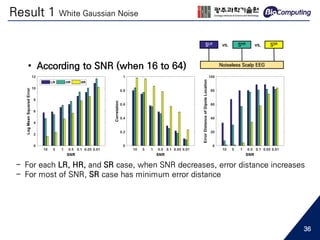
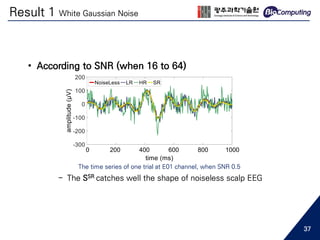
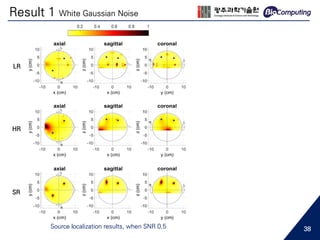
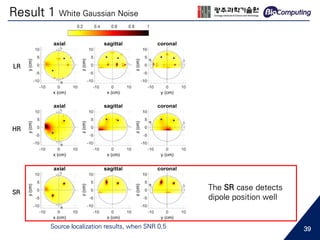
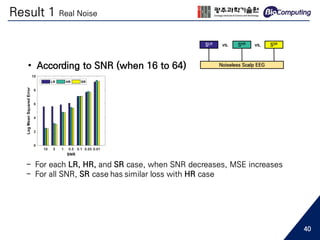
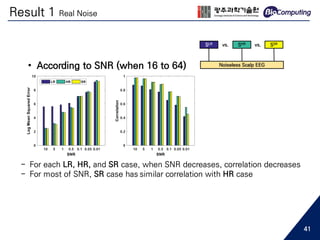
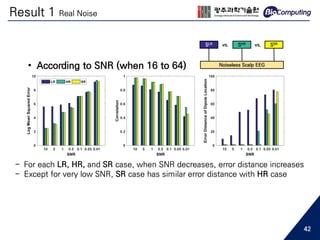
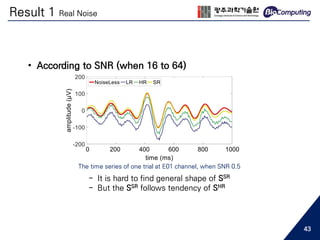
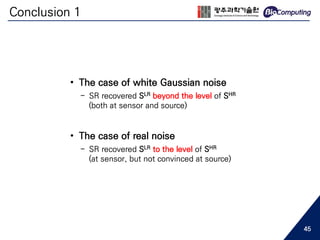
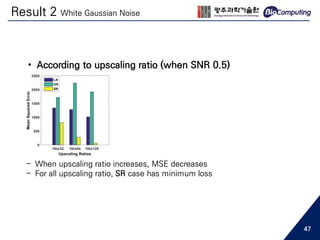
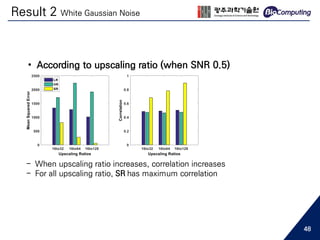
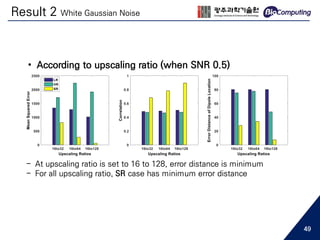
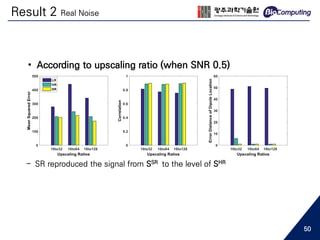
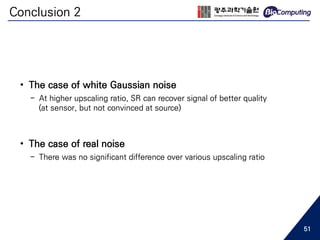
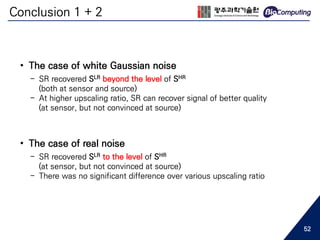
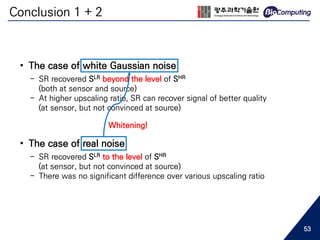
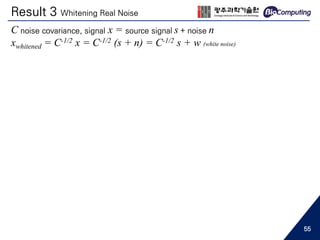
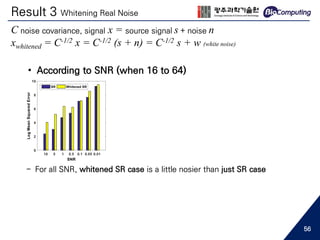
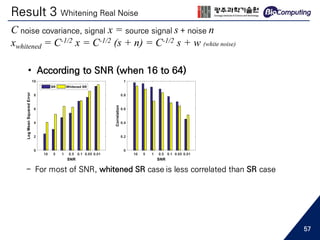
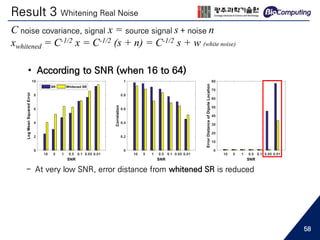
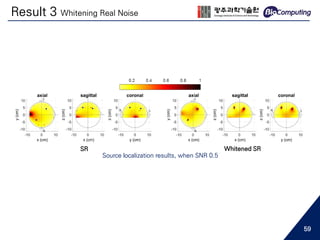
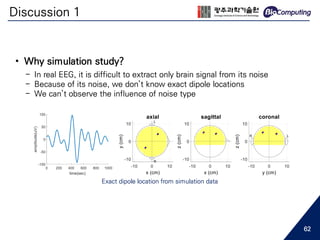
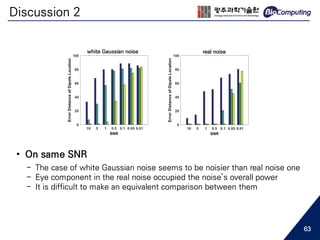
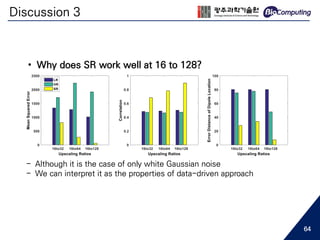
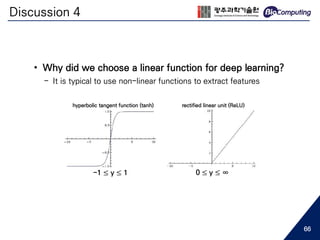
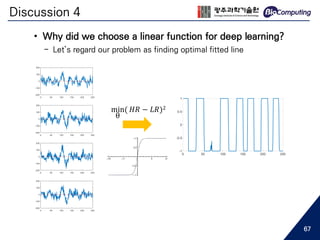
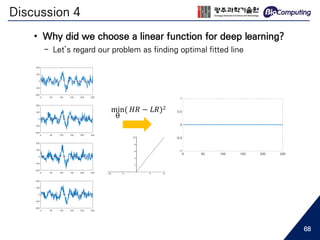
This document summarizes a master's thesis presentation on using deep convolutional networks for EEG spatial super-resolution. The study used simulated EEG data to test how different noise types and upscaling ratios affect the super-resolution process. Key findings include that super-resolution recovered low-resolution signals beyond the level of high-resolution signals for white noise, but only to the level of high-resolution signals for real noise. Higher upscaling ratios yielded better quality signals for white noise. Whitening real noise helped super-resolution, especially for source analysis at low SNR. The study used simulations to isolate the effects of noise types since real EEG noise sources cannot be extracted.


![[Research] Detection of MCI using EEG Relative Power + DNN](https://cdn.slidesharecdn.com/ss_thumbnails/20180619a-gisteegaddiagnosisdkimconference-180622113717-thumbnail.jpg?width=640&height=640&fit=bounds)