Download to read offline


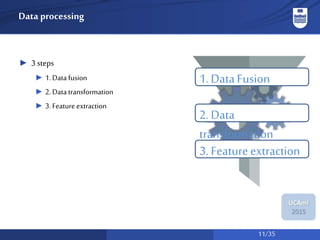
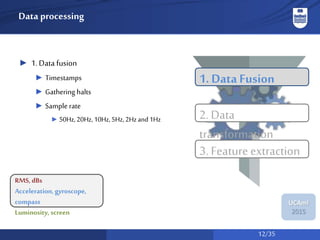
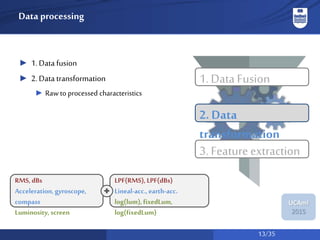
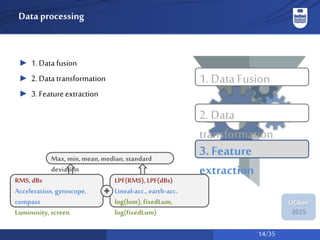

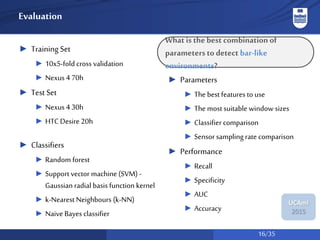
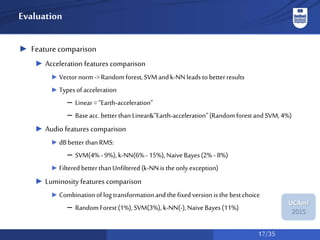
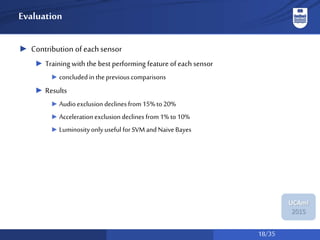
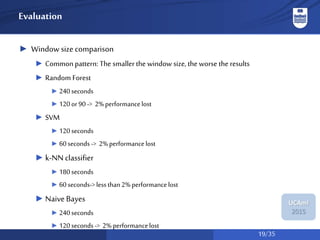


The document discusses a system for social activity recognition using smartphone sensors, focusing on capturing data related to various environments. It details the data processing methods and evaluations of different classifiers to determine the best features and parameters for recognizing user activities in bar-like settings. Future work aims to enhance generalization to new users and improve recognition accuracy through further data collection and analysis.


![[SeNAmI'12] Towards a fuzzy-based multi-classifier selection module for activ...](https://cdn.slidesharecdn.com/ss_thumbnails/senami12towardsafuzzy-basedmulti-classifierselectionmoduleforactivityrecognitionapplications-120611064457-phpapp02-thumbnail.jpg?width=640&height=640&fit=bounds)


![ANIMAL_CELL_,_TISSUE_AND_ORGAN_CULTURE[1].pptx](https://cdn.slidesharecdn.com/ss_thumbnails/animalcelltissueandorganculture1-260204172026-4462b440-thumbnail.jpg?width=640&height=640&fit=bounds)


