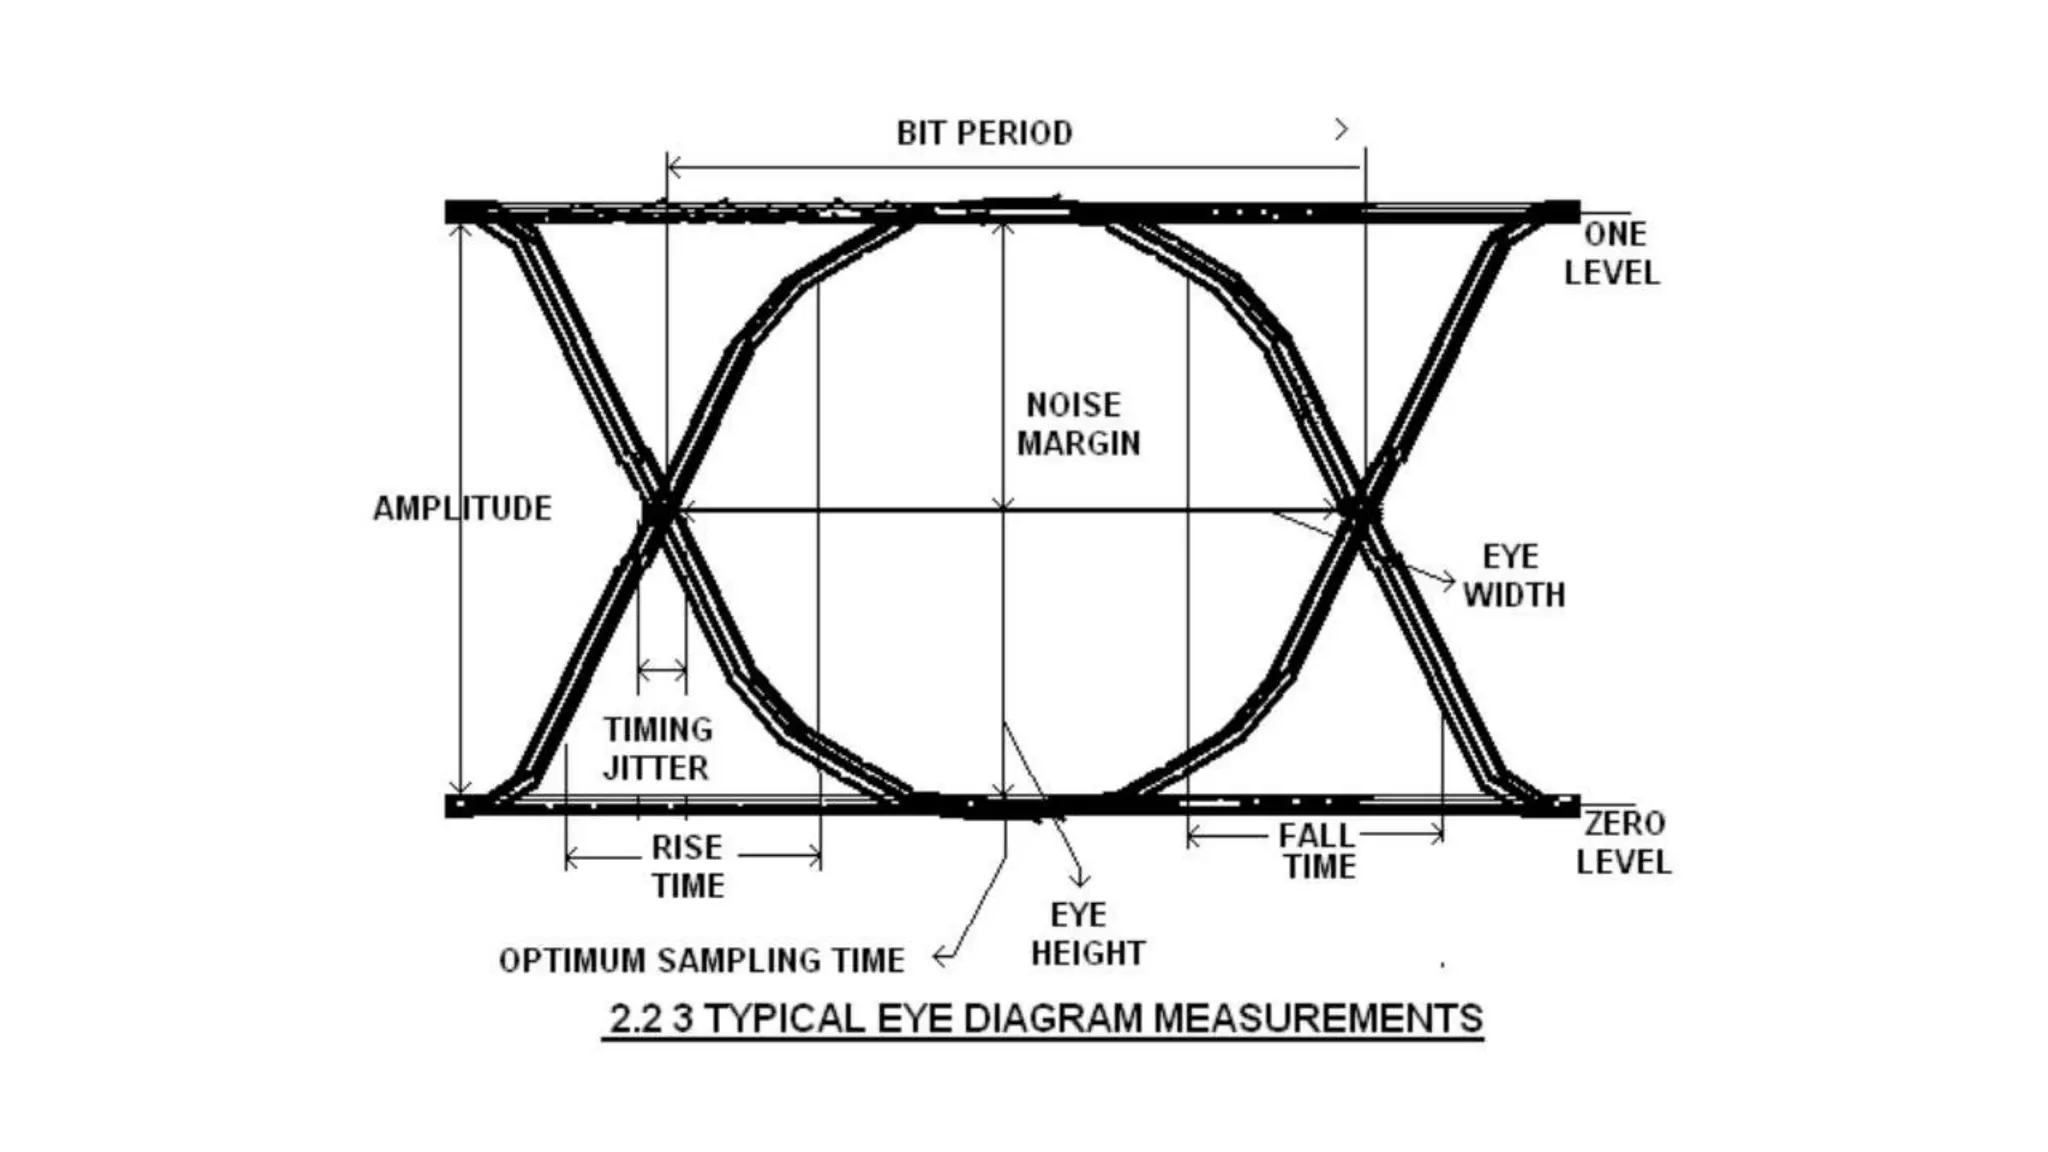
An eye diagram displays the effects of intersymbol interference (ISI) in a data communication system. It is created by superimposing successive waveforms on an oscilloscope. The amount of ISI is seen by how open the eye pattern is - a wide open eye indicates less ISI, while a less open eye shows more ISI. An eye diagram provides information about the bit error rate, signal-to-noise ratio, optimal sampling time, and sensitivity to timing errors.