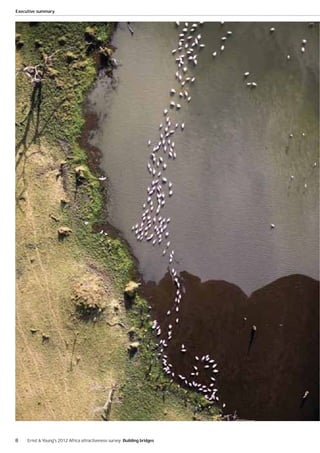
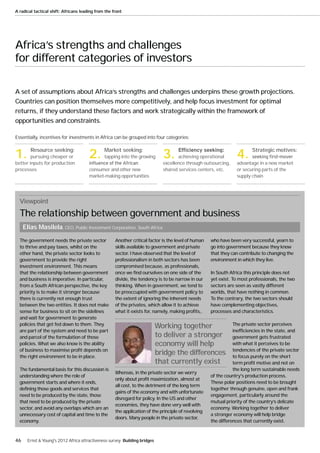
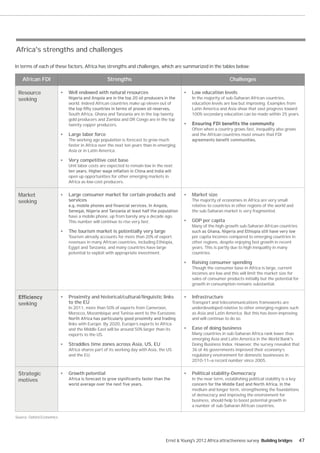
Downloaded 61 times

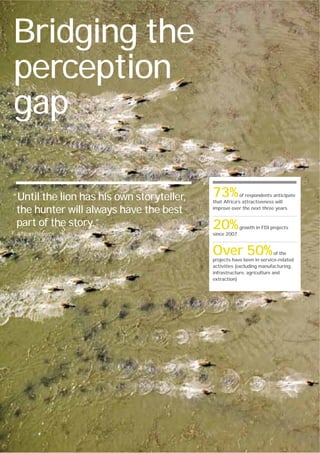
![Bridging the perception gap
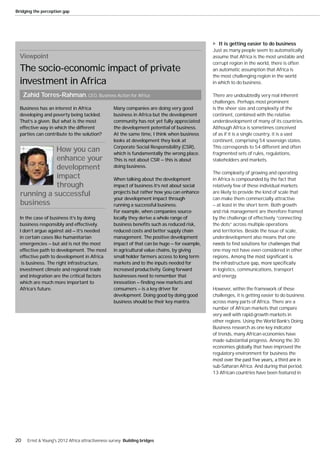
Looking forward: factors sustaining growth
and an ever-improving environment for doing business, but also because of three key lead
indicators: improvements in human development trends, growing levels of disposable income
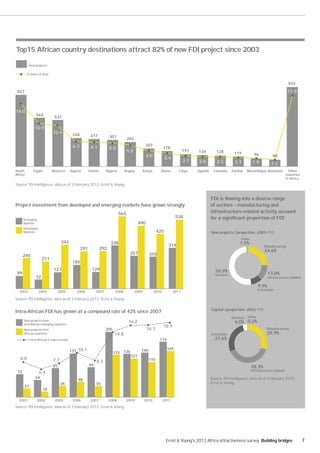
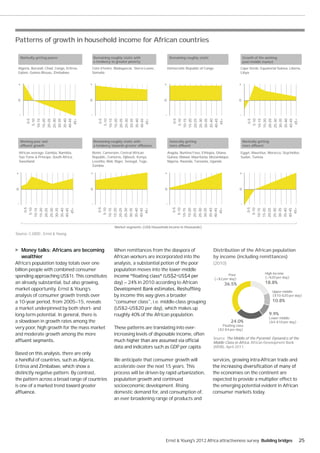
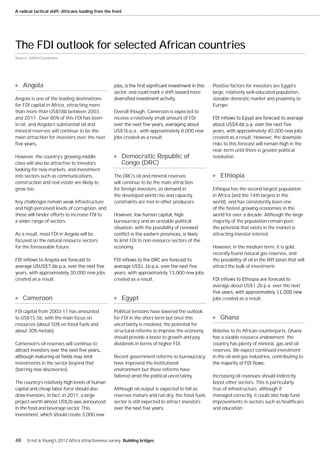
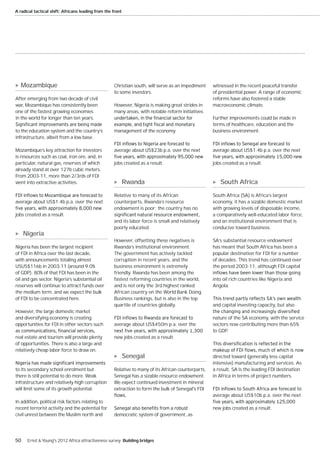
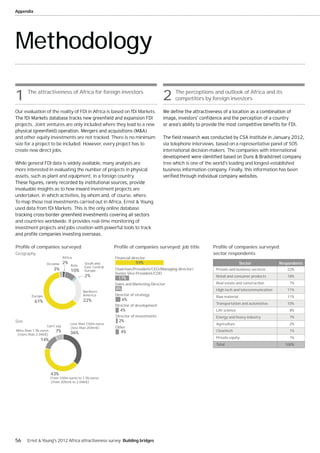
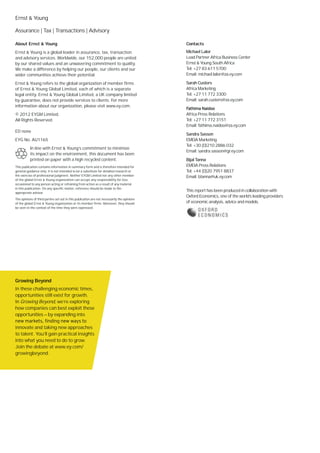
Development: human development The declining rate of poverty in Africa
numbers are trending up
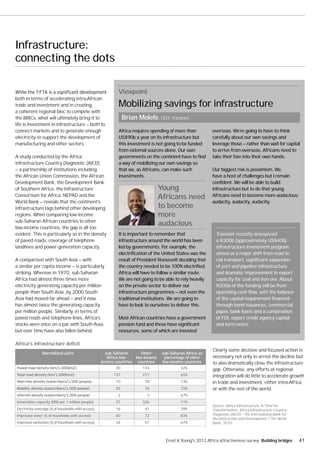
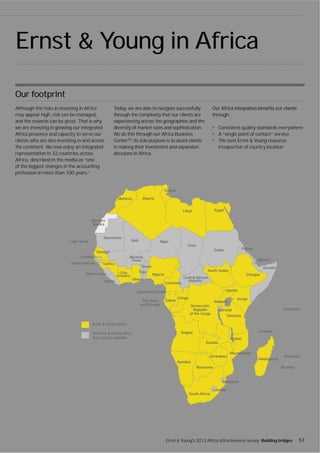
60
Improvements in the quality of life are not Sub-Saharan Africa
only a key indicator of the ultimate impact
of economic growth, but also of its long-
term sustainability. While there is obviously 50
still a long way to go, the signs are that
progress is being made in the areas of
health, education and general welfare in 40
many parts of Africa. An analytical study by
Xavier Sala-i-Martin and Maxim Pinkovskiy 38%
backs up the view that the quality of life in
30
Africa is steadily improving.6 In their paper,
African Poverty is Falling… Much Faster
than You Think!, they reveal that there 1990 1995 2000 2005 2010 2015
has been a sharp and widespread reduction
in poverty and income inequality in Africa Actual $1.25/day Projected $1.25/day
since 1995. Source: Development Prospects Group, World Bank.
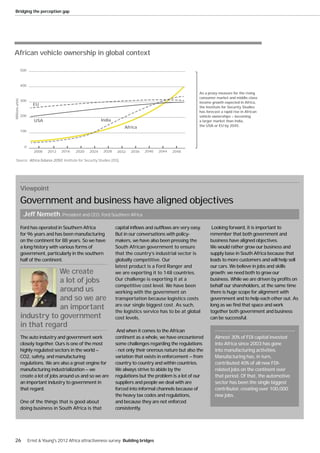
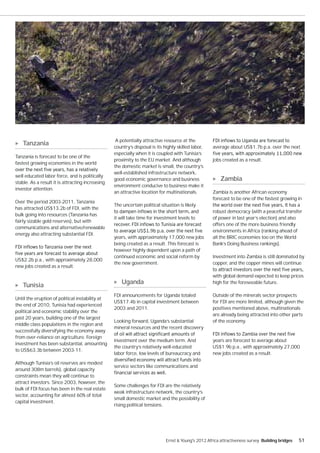
Human Development Index (HDI) value - Africa The steady overall improvement in human
development is illustrated by the upward
trend in the United Nations’ Human
Development Index 2011, particularly
over the past two decades. As a result,
0.498 and according to the World Bank:
0.492
0.482
0.468 0.496
0.488 “Progress on the Millennium Development
0.475
0.422
0.437 countries (such as Cape Verde, Ethiopia,
0.391 Ghana and Malawi) are likely to reach
0.405 most of the goals, if not by 2015, then
0.371 soon thereafter. Africa’s poverty rate
was falling at about 1 percentage point
a year, from 59% in 1995 to 50% in 2005
1980 1985 1990 1995 2000 2005 2006 2007 2008 2009 2010 2011 (see graph [above]). Child mortality rates
are declining, HIV/AIDS is stabilizing, and
Source: Human Development Index (HDI) value: HDRO calculations based on data from UNDESA (2011),
Barro and Lee (2010), UNESCO Institute for Statistics (2011), World Bank (2011) and IMF (2011). primary education completion rates are
rising faster in Africa than anywhere else.”7
6. African Poverty is falling,..Much Faster than You Think!,
Bureau of Economic Research Working Paper 15775, 7. Africa’s Future and the World Bank’s in Support to It. The
February 2010. World Bank,
24 Ernst & Young's 2012 Africa attractiveness survey Building bridges](https://image.slidesharecdn.com/eyafricaattractiveness2012-13370168545204-phpapp01-120514123556-phpapp01/85/EY-Africa-Attractiveness-2012-26-320.jpg)
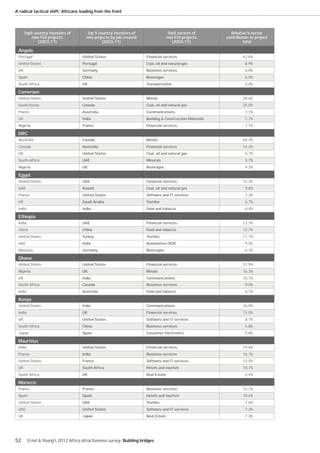


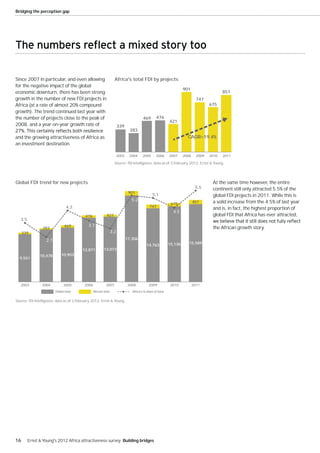
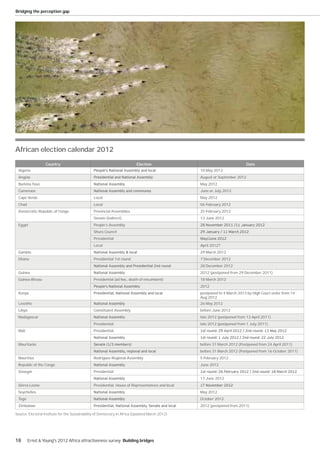
Ernst & Young's 2012 Africa Attractiveness Survey highlights a robust growth in foreign direct investment (FDI) across Africa, with an increase of 27% from 2010 and nearly 20% compounded growth since 2007. However, the report emphasizes the need to improve the continent's perception, boost regional integration, and address poor infrastructure to unlock Africa's full economic potential. The survey reveals a significant gap between the positive views of current investors and the negative perceptions held by potential investors, indicating a need for more effective storytelling about Africa's growth and opportunities.


