1) A survey was conducted of 287 consumers in Kolkata to understand the importance of 9 attributes when purchasing bakery products from chains.
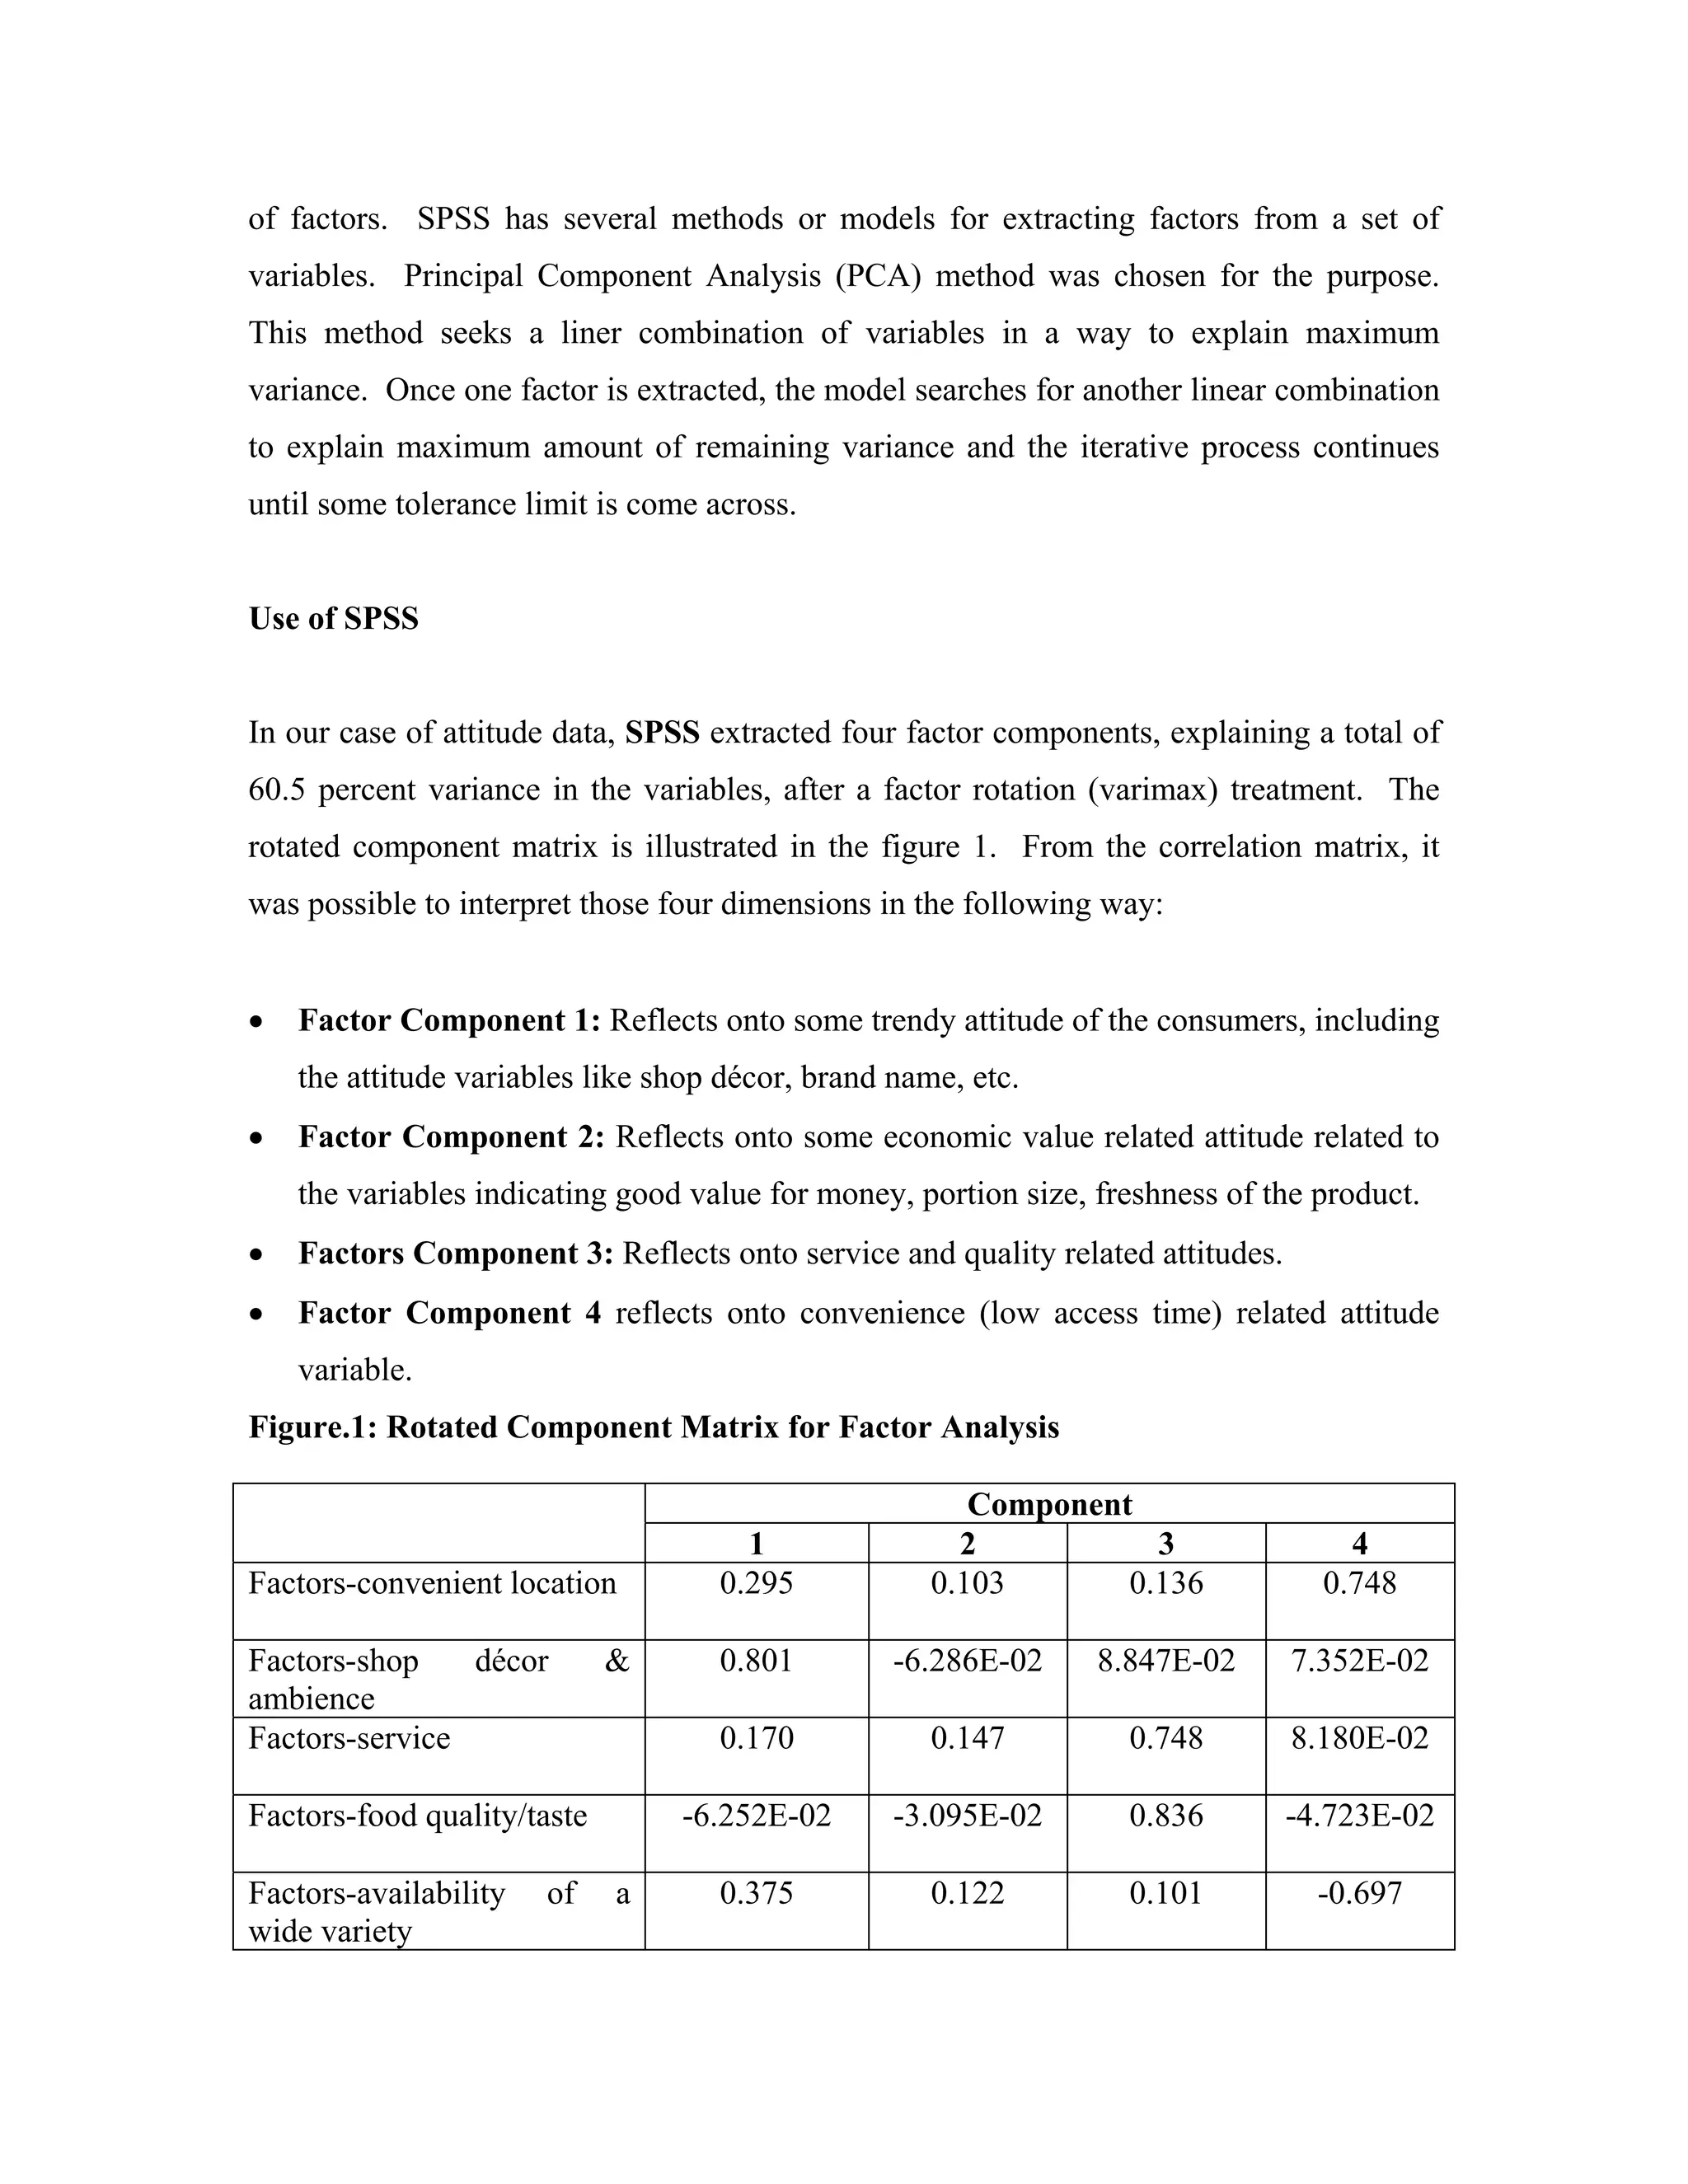
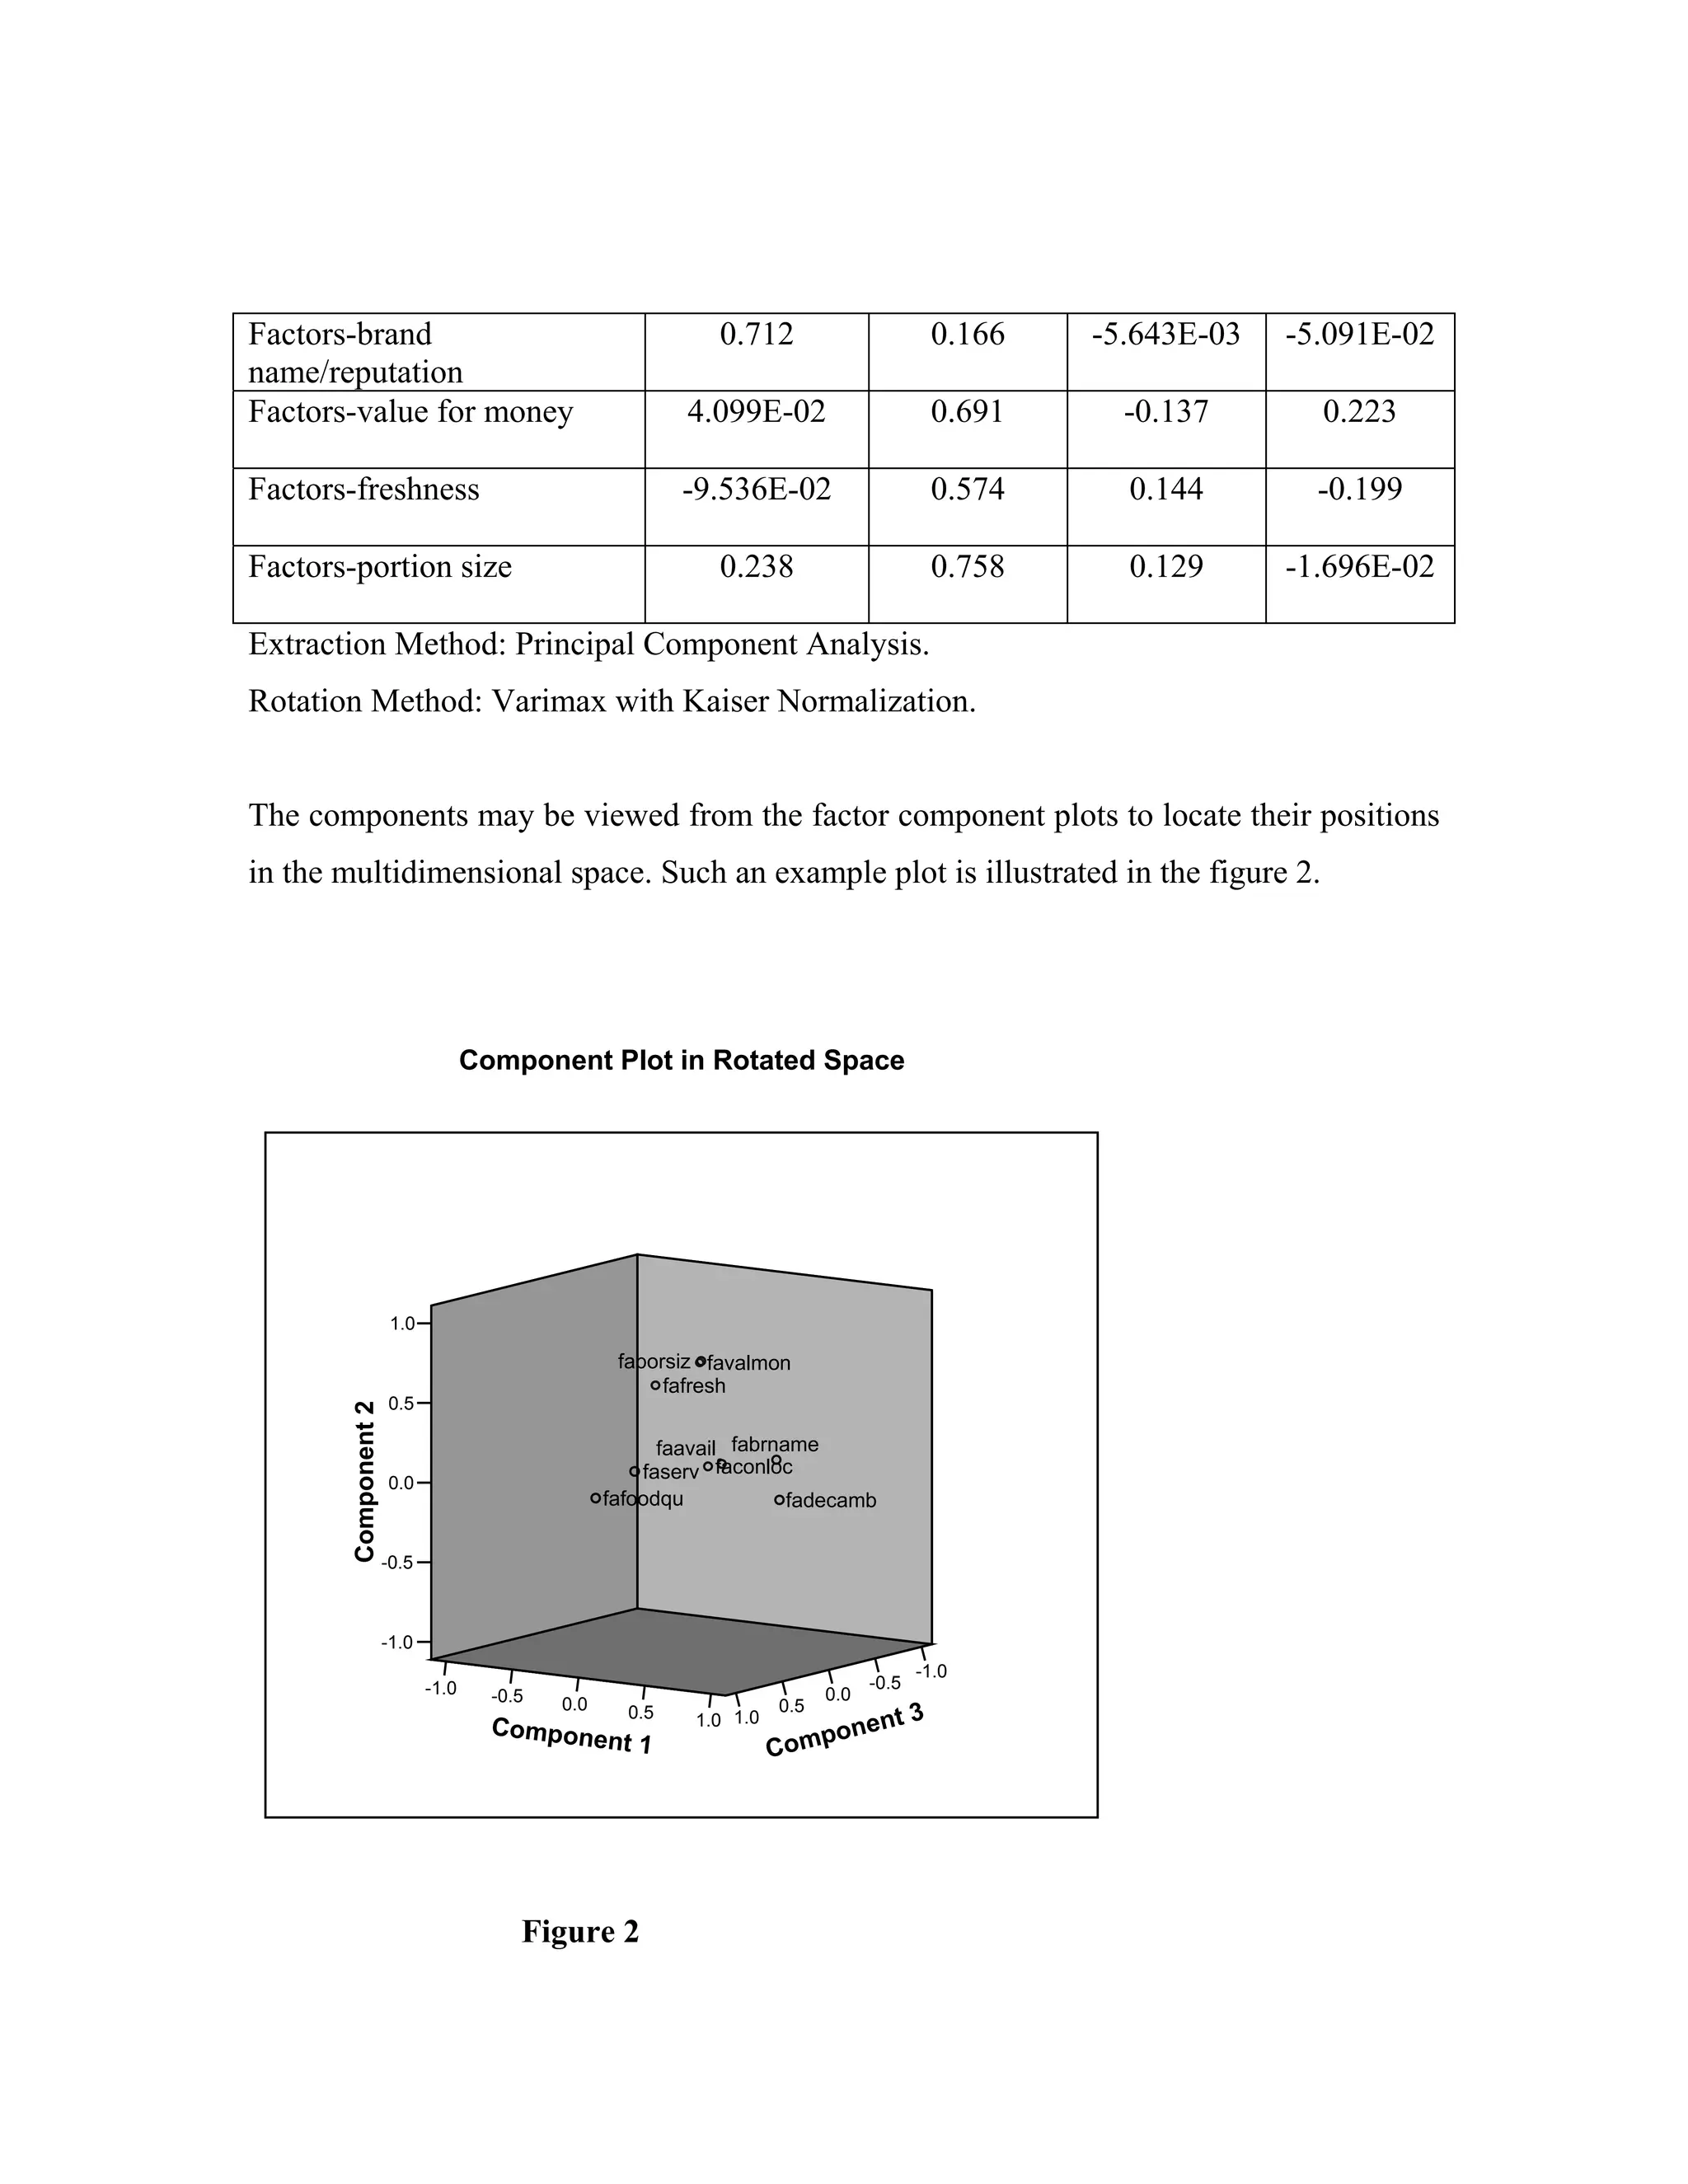
2) Factor analysis using SPSS extracted 4 factors from the attributes that explained 60.5% of the variance: factor 1 reflected trendy attitudes, factor 2 economic value, factor 3 service/quality, and factor 4 convenience.
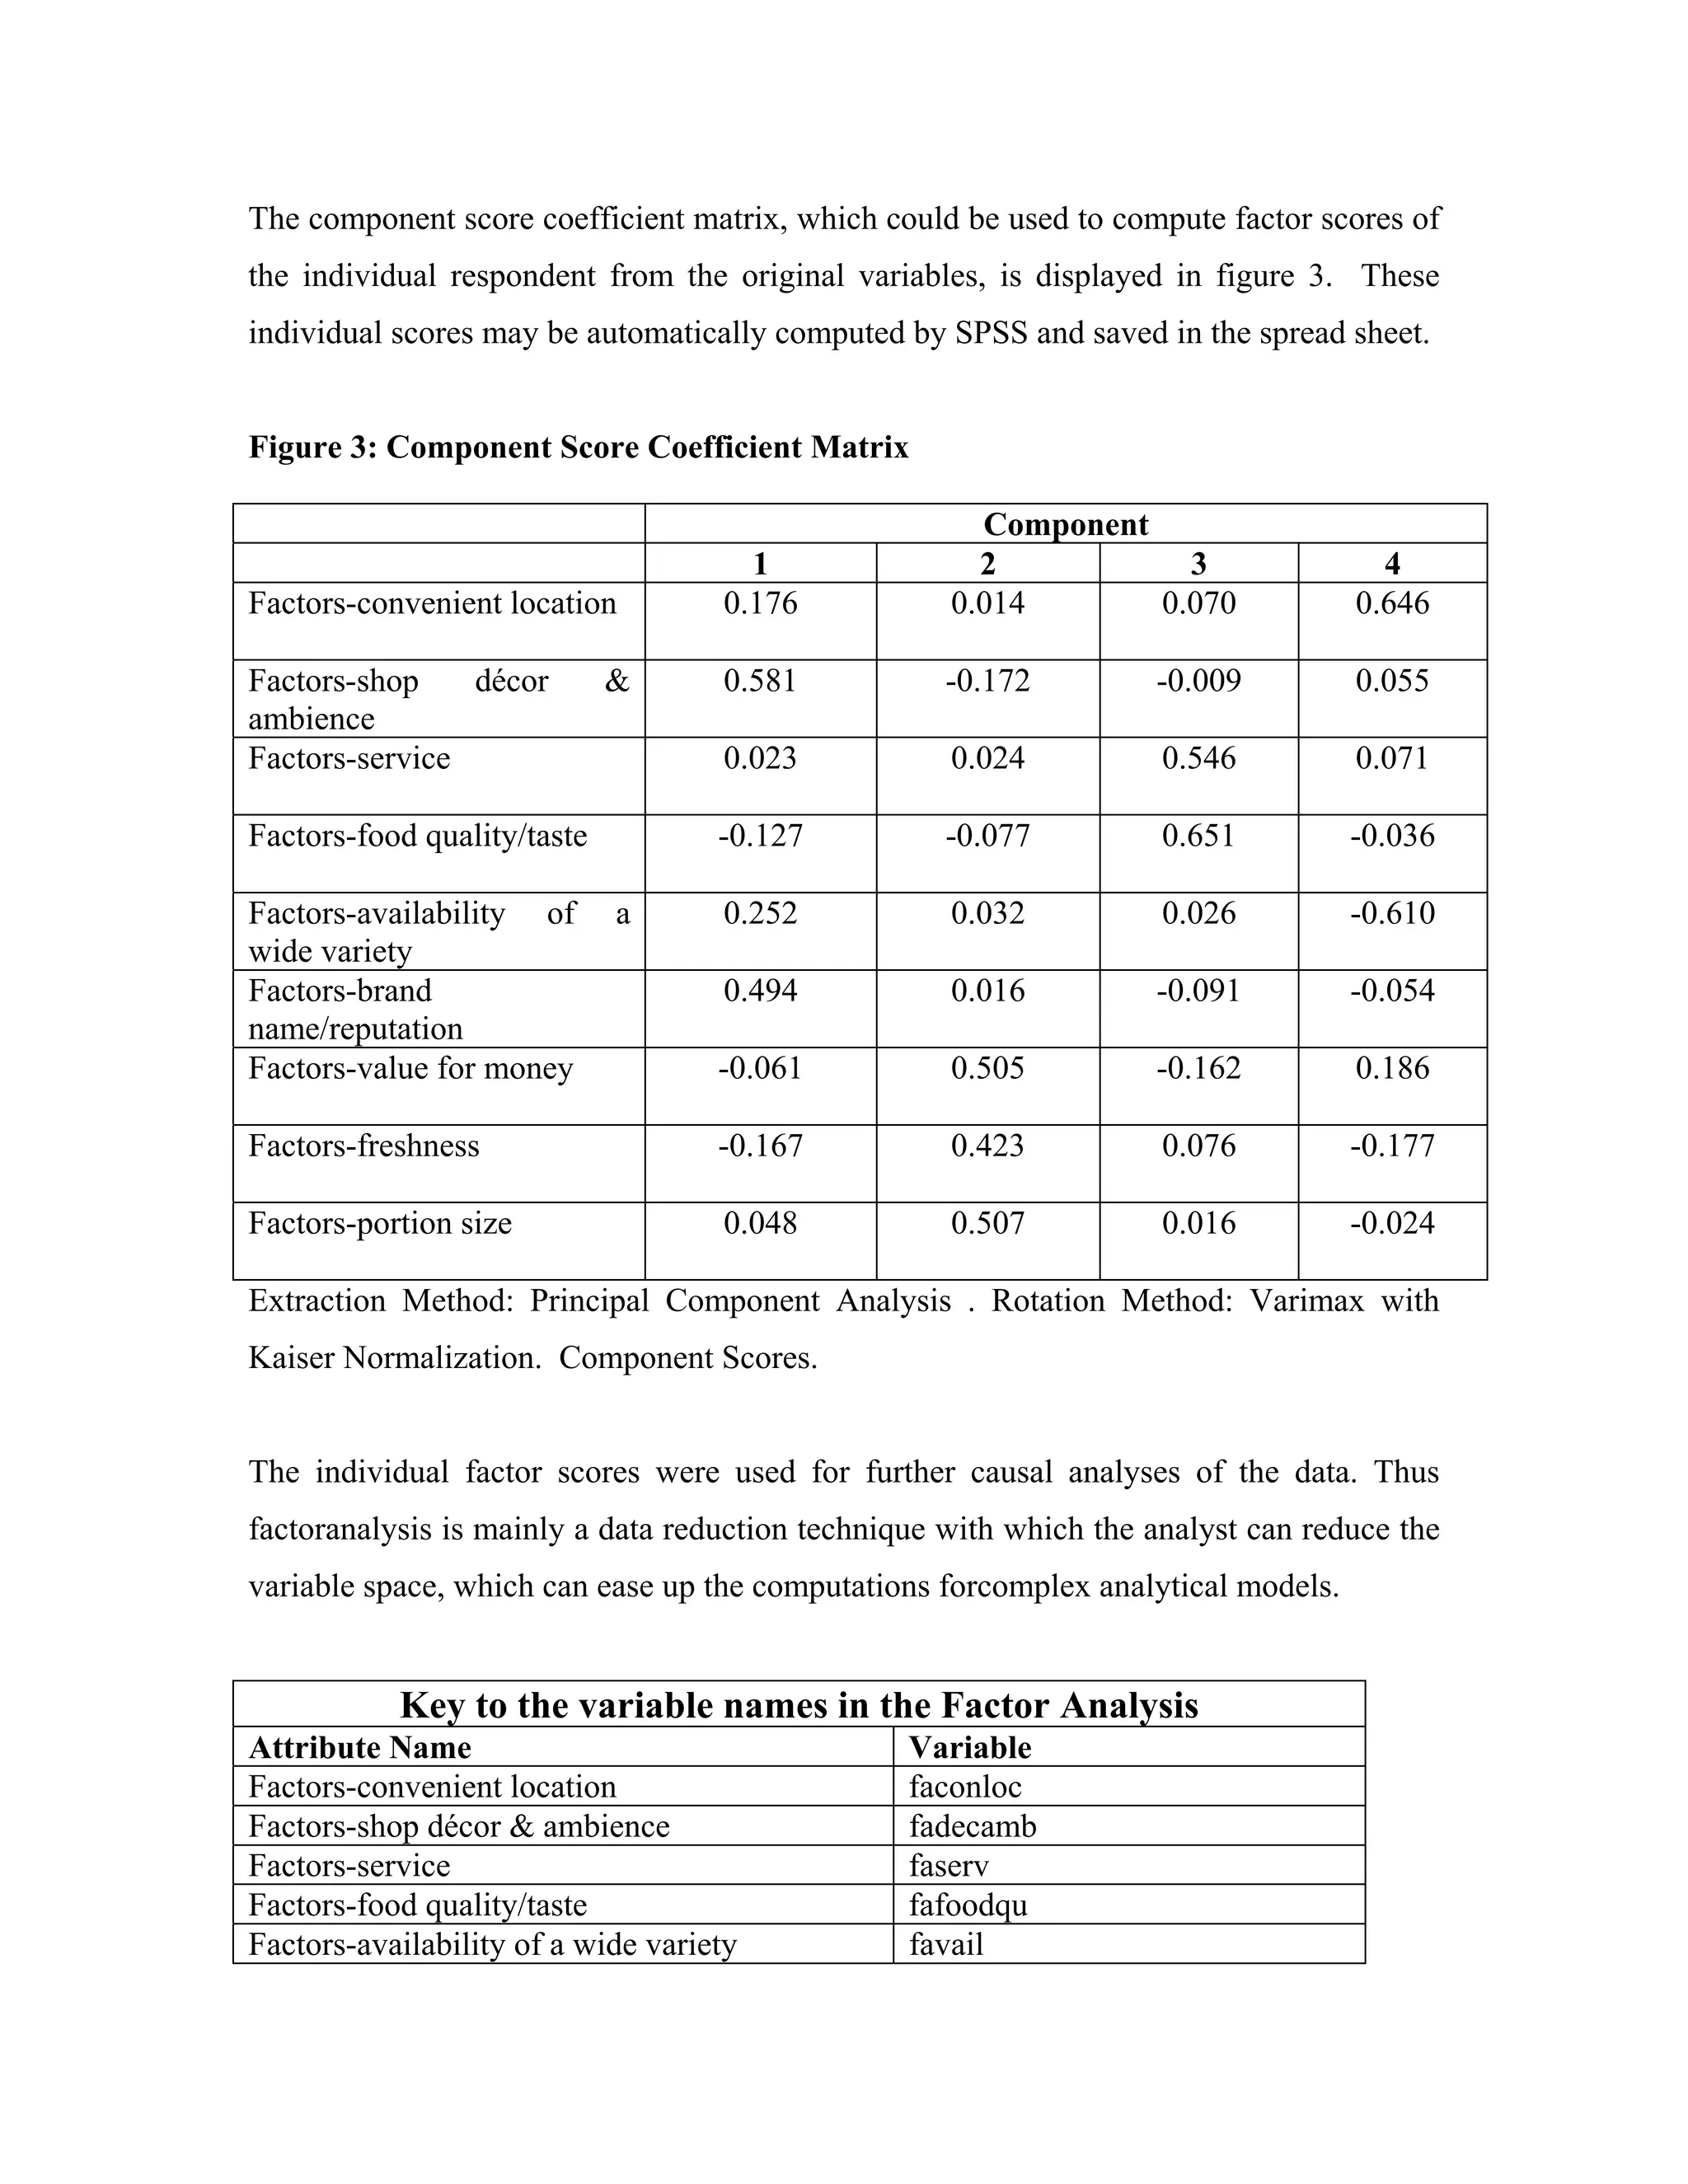
3) The analysis identified the underlying dimensions of consumer attitudes to reduce the number of variables and help explain their purchasing decisions.