SlideShare a Scribd company logo
Exploring and Assessing Project Complexity
Bac Dao, Ph.D., A.M.ASCE1
; Sharareh Kermanshachi, Ph.D., A.M.ASCE2
;
Jennifer Shane, Ph.D., M.ASCE3
; Stuart Anderson, Ph.D., M.ASCE4
; and Eric Hare5
Abstract: The term project complexity is not well understood in the construction industry by either scholars or practitioners. Project com-
plexity, however, is a critical factor in project management that presents additional challenges to achieving project objectives. Therefore, it is
essential that everyone involved in project management thoroughly understand what project complexity is and how to identify, measure, and
manage the various attributes and indicators it comprises. This study provided a constructive approach to identify and assess project complex-
ity. As part of the study, a working definition of project complexity was developed by the research team, and project complexity was described
in terms of project management rather than project physical features. In addition, the research team identified complexity attributes and
developed the indicators that measure those attributes. Project specific data were collected through a survey of companies active in the
construction industry. These data were statistically analyzed to test the significance of complexity indicators in differentiating low-complexity
projects from high-complexity projects. The statistical analysis resulted in 34 significant complexity indicators associated with 22 attributes,
which the research team considers truly representative of project complexity. The research findings can help scholars and practitioners in the
project management field understand critical indicators of project complexity and develop an appropriate strategy to manage project complex-
ity effectively. DOI: 10.1061/(ASCE)CO.1943-7862.0001275. © 2016 American Society of Civil Engineers.
Author keywords: Organizational issues; Project complexity; Complexity attributes; Complexity indicators.
Introduction
In the field of project management, both scholars and practitioners
have referred to problems caused by project complexity or particu-
lar problems arising from complex projects. References to low
project complexity or high project complexity are commonplace
across many industry sectors. However, references to low or high
complexity often seem to be made intuitively and to represent a
relative assessment of complexity by comparison to other types
of projects or to similar projects within an industry sector. There
is no standard definition for complexity that can be applied to
all projects. Furthermore, there is no single understanding of com-
plexity, what it means, and how to measure it. Project complexity is
frequently perceived as a factor related to two project concepts:
project difficulty and project risk. Project difficulty focuses on
how hard it is to achieve project objectives. Project risk focuses
on uncertainties associated with unknowns around the project.
However, although these two concepts are related to project com-
plexity, they were not the subject of this study.
There is a need to study complexity as a separate factor influ-
encing projects. This includes a need to define project complexity,
study the individual and most important attributes of complexity,
and identify the indicators that truly reflect the complexity of a
project. Most attributes of complexity are constantly changing var-
iables such as project type, project size, project location, project
team experience, interfaces within a project, logistics/market con-
ditions, geo-political and social issues, and permitting and appro-
vals. Having a better understanding of project complexity in any
phase of project development as well as a strategy to manage com-
plexity will influence how efficiently and economically projects are
planned, managed, and executed.
The overall goal of the study presented in this paper was to de-
velop a methodology to fully explore and assess project complex-
ity. This goal was achieved by attaining two specific objectives:
(1) define complexity and its attributes and (2) identify and test
the significance of complexity indicators that are the measures
of project complexity. The resulting assessment of project complex-
ity adds significant value to the current body of knowledge for
scholars and helps practitioners with project resource allocation
to complex projects. The research results, from the perspective
of complexity theory and complexity management, make a substan-
tial contribution to the theoretical basis in the field of project
management.
Literature Review
To better understand complexity, the researchers reviewed the pub-
lications relevant to complexity theory, project complexity defini-
tion and identification, impacts of project complexity on project
performance, and complexity management practices. Additionally,
relevant models and tools already developed were investigated for
insights into different approaches to complexity assessment and
management.
1
Postdoctoral Research Associate, Durham School of Architectural
Engineering and Construction, Univ. of Nebraska-Lincoln, 133 Nebraska
Hall, 900 N 16th St., Lincoln, NE 68588 (corresponding author). E-mail:
bdao2@unl.edu
2
Assistant Professor, Dept. of Civil Engineering, Univ. of Texas at
Arlington, 425 Nedderman Hall, 416 Yates St., Box 19308, Arlington,
TX 76019. E-mail: sharareh.kermanshachi@uta.edu
3
Associate Professor, Dept. of Civil, Construction, and Environmental
Engineering, Iowa State Univ., 498 Town Engineering, Ames, IA 50011.
E-mail: jsshane@iastate.edu
4
Professor, Dept. of Civil Engineering, Zachry Chair in Construction
Integration, Texas A&M Univ., 3136 TAMU College Station, TX
77843-3136. E-mail: s-anderson5@tamu.edu
5
Ph.D. Candidate, Dept. of Statistics, Iowa State Univ., 1121 Snedecor
Hall, Ames, IA 50011. E-mail: erichare@iastate.edu
Note. This manuscript was submitted on March 4, 2016; approved on
September 21, 2016; published online on November 16, 2016. Discussion
period open until April 16, 2017; separate discussions must be submitted
for individual papers. This paper is part of the Journal of Construction
Engineering and Management, © ASCE, ISSN 0733-9364.
© ASCE 04016126-1 J. Constr. Eng. Manage.
J. Constr. Eng. Manage., 2017, 143(5): 04016126
Downloaded
from
ascelibrary.org
by
ECOLE
DE
TECHNOLOGIE
SUPERIEURE
on
07/15/19.
Copyright
ASCE.
For
personal
use
only;
all
rights
reserved.
Complexity Theory and Management Practice
Complexity Theory
Complexity theory generally defines what a complex system is
within a specific area of interest (e.g., natural science, biology,
eco-system, computer science, human society, financial market,
etc.) and studies the interaction between the elements in that sys-
tem. The existing theoretical issue of complexity theory is that there
is still no commonly accepted definition of complexity, despite
there being a large number proposed (Chu et al. 2003). As defined
by Valle (2000) and Lucas (2000), a complex system is a whole that
consists of several elements interacting with each other in many
different ways. Numerous interdependent elements in a complex
system continuously interact and spontaneously organize and reor-
ganize themselves into increasingly elaborate structures over time.
Unlike conventional systems (e.g., an aircraft or a computer), a
complex system includes elements that do not necessarily have
fixed relationships, fixed behaviors, or fixed quantities. Lucas
(2000) categorized systems into four levels of complexity: (1) static
complexity that is related to fixed systems and does not change with
time; (2) dynamic complexity that is considered to be cyclically
changed spatially and temporally; (3) evolving complexity refers
to the systems that are changed in spatial and temporal dimensions,
and these systems evolve or alter through time into different com-
plex systems; and (4) self-organizing complexity is the combina-
tion of the internal constraints of closed systems (like machines)
with the creative evolution of open systems (like people). In “The-
ories of Complexity” (Chu et al. 2003), Chu has considered two
fundamental properties generating complexity for a system: radical
openness and contextuality.
With endeavors of quantifying or modeling complexity theory,
scientists have attempted to apply quantitative techniques to
existing systems or organizations. However, most attempts to
quantify complexity deal with either the parts (traditional reduc-
tion) or look to simplify the system to a single or few parameters.
Complexity could be simplified by making its features and proper-
ties reducible, and the modelers can ignore some features without
substantially compromising the validity of the models. However,
readers and/or users have to be aware of inherent limitations of
these models and acknowledge that they cannot represent the full
complexity of the system.
Complexity Theory and Management Practice
In the management area, under certain conditions, the systems of
interest to complexity theory perform in steady, predictable ways.
Under other conditions, they exhibit behavior in which regularity
and predictability is lost. Almost undetectable differences in initial
conditions lead to gradually diverging system reactions until even-
tually the evolution of behavior is quite dissimilar. The systems of
interest are dynamic systems with the capability of changing over
time. Some systems constantly change but do so in a relatively
regular manner, whereas other systems lack this stability. Unstable
systems move further and further away from their starting condi-
tions until or unless these systems are brought up short by some
over-riding constraint (Rosenhead 1998). Stable and unstable
behaviors are part of the traditional range of physical science. In
the management field, Stacey (1992) indicates that a system behav-
ior may also be divided into two zones: (1) a stable zone where, if
the system is disturbed, it returns to its initial state; and (2) an un-
stable zone, where a small disturbance leads to movement away
from the starting point, which in turn generates further divergence.
Which behavior type is exhibited, stable or unstable, depends on
the organizational conditions. Under some appropriate conditions,
systems may operate at the boundary between these zones,
sometimes called a phase transition, or the edge of chaos, in which
they exhibit a sort of bounded instability, that is, the unpredict-
ability of specific behavior within a predictable general structure
of behavior.
Definition of Project Complexity
Through the literature review, more than 30 definitions of complex-
ity were assessed. These 30 definitions went through a screening
process. This screening process eliminated the definitions that were
not related to project management and similar definitions from dif-
ferent studies (the most cited definition was selected). In addition,
the definitions that consist of uncertainty elements were also elim-
inated. The literature often uses uncertainty to describe complexity.
The use of uncertainty has purposely been avoided in this research
because uncertainty is more often associated with risks rather than
complexity. In this section, 10 definitions of complexity in general
and project complexity in particular are introduced. These defini-
tions originated from a wide variety of disciplines, and some of
them are radically different from the others. The result of the
screening process for complexity definitions is shown in Table 1.
Complexity Attribute
The next step in better understanding complexity is to identify the
attributes of complexity. Scholars have focused on the identifica-
tion of complexity attributes more than any other topic in the field
of project complexity. Studies in this area have evolved signifi-
cantly over the past 20 years. Nassar and Hegab (2006) developed
a complexity measure for project schedules. The measure considers
the degree of interrelationships between the activities in the proj-
ect’s schedule. The complex schedule of a project may contribute
to project complexity. However, the complexity measure of a
project schedule is totally different from the complexity measure
of a project. Baccarini (1996) identified two major attributes of
complexity including organizational complexity and technical
complexity. Organizational complexity reflects the view that a
project is a task containing many interdependent elements. Because
this dimension of complexity is related to the structure of the
project, Williams (1999) refers to this factor as structural complex-
ity. Technical complexity deals with complexity related to the
transformation processes, which convert inputs (such as project
resources) into outputs (such as project performance or facility
quality). Technical complexity is usually divided into facility op-
erational requirements, project characteristics, and the level of
knowledge required for the project. Examples of technical com-
plexity are the sophistication of control system, number of opera-
tors, location of project, type of work force skills needed, and right
type of technical expertise. From an analysis of more than 1,300
projects, Puddicombe (2012) proved that technical complexity is
an important characteristic of a project that has distinct effects
on project performance.
Though uncertainty is associated with risk rather than complex-
ity, several scholars still viewed uncertainty as an attribute to
project complexity. Lebcir (M. Lebcir, “A framework for project
complexity in new product development (NPD) projects,” working
paper, University of Hertfordshire, Hertfordshire, U.K.) introduced
uncertainty as one of the factors influencing the complexity of the
project. It has two important dimensions: uncertainty in goals that
means the project is poorly defined at the beginning of its execution
and uncertainty in methods that reflects the lack of knowledge on
how to achieve project goals. Generally, the number of project com-
ponents, degree of activeness within each component, degree of
interactions between project components (or interfaces within a
© ASCE 04016126-2 J. Constr. Eng. Manage.
J. Constr. Eng. Manage., 2017, 143(5): 04016126
Downloaded
from
ascelibrary.org
by
ECOLE
DE
TECHNOLOGIE
SUPERIEURE
on
07/15/19.
Copyright
ASCE.
For
personal
use
only;
all
rights
reserved.
project), and interactions of the project with entities outside of the
project were frequently considered as the attributes that create
complexity of a project.
Assessing and Measuring Project Complexity
Previous studies explained in this literature review show that for all
practical purposes, a project risk framework is not sufficient to
identify and measure all the possible positive and negative effects
associated with risk, uncertainty, or complexities related to the
project. Notably, there is a crucial need for efficient complexity
modeling in order to identify and assess project complexity factors.
By conducting a literature search and structured interviewing of
practitioners, Gidado (1996) has defined project complexity and
identified the factors that influence its effect on project success.
These factors include the inherent complexity, number of technol-
ogies, rigidity of sequence, overlap of phases, and organizational
complexity. In addition, the study proposes an approach that mea-
sures the complexity of the production process in construction.
The Global Alliance for Project Performance Standards
(GAPPS 2007) developed a comprehensive project management
complexity measurement tool called the Crawford–Ishikura Factor
Table for Evaluating Roles (CIFTER). CIFTER provides a seven-
factor model from which project management complexity of
projects is assessed. A total project complexity score is created
by adding the scores from all seven factors outlined in CIFTER.
The total CIFTER score is used to categorize each project as either
below Global Level 1 (scores less than 12), Global Level 1 (scores
12 to 18), or Global Level 2 (score 19 or more). Table 2 shows
influencing factors as well as the method to evaluate them based
on the CIFTER tool. Each of the seven factors in the CIFTER tool
is rated on a point scale of one to four with the total number of
points across the seven factors determining whether a project is
Global 1, Global 2, or neither.
Literature Findings
Several definitions of complexity were found from a wide range of
disciplines as specifically discussed in each section of the literature
review. For the purposes of this research, the myriad definitions
were consolidated to the following central idea for further
discussion: Project complexity is the degree of differentiation of
project elements, interrelatedness between project elements, and
consequential impact on project decisions [CII RT 305-11 (CII
2016a)]. Also, factors of complexity suggested by scholars were
discussed. Although a fair number of papers and books were found
around different methods of measuring complexity, it seems that
very few scholars have studied project complexity as a separate
factor influencing project characteristics in the project management
field. A detailed description of project complexity and complexity
attributes will help scholars understand project complexity and
study it properly.
Table 1. Project Complexity Definitions
Number Authors (year) Definition
1 Dictionaries (1) Consisting of many varied interrelated parts; (2) complicated, involved, intricate.
2 Perrow (1965) The complexity of a task is the degree of difficulty and the amount of thinking
time and knowledge required to perform the task.
3 Gidado (1996) Project complexity is the measure of the difficulty of implementing a planned
workflow in relation to the project objectives.
4 Baccarini (1996) Project complexity consists of many varied interrelated parts and can be operationalized
in terms of differentiation and interdependency.
5 Edmonds (1999) Complexity is that property of a model, which makes it difficult to formulate
its overall behavior.
6 Sbragia (2000) The number of elements in the project, intensity of interactions between elements,
and difficulty of cooperation between the functional areas.
7 Brockmann and Girmscheid (2007) The complexity is the degree of manifoldness, interrelatedness, and consequential
impact of a decision field.
8 Hass (2008) Complexity is characterized by a complicated or involved arrangement of many
inter-connected elements that it is hard to understand or deal with.
9 Vidal and Marle (2008) Project complexity is the property of a project, which makes it difficult to understand,
foresee, and keep under control its overall behavior.
10 Remington et al. (2009) A complex project demonstrates a number of characteristics to a degree, or level of
severity, that makes it difficult to predict project outcomes or manage project.
Table 2. Crawford–Ishikura Factor Table for Evaluating Roles
Number Project management complexity factor Description and scores
1 Stability of the overall project context Very high (1) High (2) Moderate (3) Low (4)
2 Number of distinct disciplines, methods, or approaches involved in
performing the project
Low (1) Moderate (2) High (3) Very high (4)
3 Magnitude of legal, social, or environmental implications from
performing the project
Low (1) Moderate (2) High (3) Very high (4)
4 Overall expected financial impact (positive or negative) on the
project’s stakeholders
Low (1) Moderate (2) High (3) Very high (4)
5 Strategic importance of the project to the organization or the
organizations involved
Very low (1) Low (2) Moderate (3) High (4)
6 Stakeholder cohesion regarding the characteristics of the
product of the project
High (1) Moderate (2) Low (3) Very low (4)
7 Number and variety of interfaces between the project and
other organizational entities
Very low (1) Low (2) Moderate (3) High (4)
© ASCE 04016126-3 J. Constr. Eng. Manage.
J. Constr. Eng. Manage., 2017, 143(5): 04016126
Downloaded
from
ascelibrary.org
by
ECOLE
DE
TECHNOLOGIE
SUPERIEURE
on
07/15/19.
Copyright
ASCE.
For
personal
use
only;
all
rights
reserved.
Research Methodology
Research Approach
For this research, the academic researchers were working closely
with 18 construction industry practitioners to form a research
team. This industry group composed of practicing professional
representatives from owners, contractors, and engineering firms.
The industry practitioners all had at least 10 years of experience
in the construction industry. These practitioners were responsible
for providing research inputs and practical perspectives through
multiple rounds of reviewing and many intensive discussions with
the academic research team members. The research process, the
survey questionnaire, the collected data, and the research results
were reviewed and discussed by these industry practitioners in
the validation process.
To fully explore and assess project complexity, a research frame-
work was developed by the research team to support the interaction
of the primary research objectives. The measurement approach of
this research was developed based on literature findings, the results
of prior research, an industry pilot and review process, and the
preliminary results of statistical analysis. For the complexity meas-
urement approach, the term complexity indicator was selected to
identify complexity measures based on its common use in the con-
struction industry and academia. The research team members who
were working in the construction industry agreed that using the
term complexity indicator provides a common sense descriptor
for not only construction scholars but also for practitioners when
referring to the measurement of project complexity. The study
started with a literature review to identify potential complexity
indicators. The identified indicators were brought to many discus-
sions with the industry research team members. The complexity
indicators were modified and improved upon based on a practical
perspective to ensure that the survey respondents understand the
developed measures and to guarantee that the developed measures
represent an appropriate construct.
The research process was conducted through five tasks. Task 1
started with the in-depth exploration of the concept of complexity
and its attributes. Contemporary literature on the subject of com-
plexity was reviewed, and background experience was gathered.
Research questions and research objectives were identified to direct
the research around the focused point. Task 2 reviewed the devel-
oped definitions of project complexity and described project
complexity by developing a working definition and identifying
potential complexity attributes as a basis for this research. Task 3
proposed an approach to develop the complexity indicators deemed
to measure the associated complexity attributes and the relevant
hypothesis. The data related to testing the hypothesis were col-
lected through a survey in Task 4. In Task 5, the data were reviewed
and descriptively analyzed to interpret their characterizations, and
then statistical methods were applied to analyze the collected data
and test the relevant hypothesis to determine which indicators are
truly representative of project complexity. Fig. 1 provides a visual
description of the research approach.
Project Complexity Definition Development
Throughout the literature review, several definitions of complexity
were found from a wide range of disciplines. One of the difficulties
in addressing the topic of project complexity is that the term is
applied broadly and intuitively. Without a standard definition,
complexity tends to be a catch-all category that is often used
when project results are unpredictable, when a project has many
interacting parts, when details of a project are poorly understood,
or for a myriad of other project conditions outside of what is
typically perceived as “normal.” Project professionals and teams
have an intuitive sense of when a project is complex, but the rea-
sons for that complexity may be widely varied and depend on that
person’s or project team’s experiences, resource availability, stake-
holder considerations, and many other factors, both objective and
subjective. Additionally, the perception of complexity can be com-
pounded by multiple project factors, which if not managed effec-
tively may have a negative impact on the project outcome. To
address these issues, project complexity is described not in terms
of a project’s physical features (e.g., types of materials, quantities
of materials, number of systems, and facility technology) but rather
complexity related to managing projects (e.g., internal project team
interfaces, site logistics, permitting, etc.). This was necessary to
ensure that the research results could be generalized across con-
struction industry sectors and within a construction industry sector
with different types of projects.
After substantial consideration of project complexity defini-
tions, the initially consolidated definition of project complexity
from the literature review, as presented earlier, was modified to cre-
ate a final definition as the basis of this research as follows: “Project
complexity is the degree of interrelatedness between project attrib-
utes and interfaces, and their consequential impact on predictability
and functionality” [CII RT 305-1 (CII 2016b)]. This definition at-
tempts to capture the essence of how project attributes, such as
project scope, team organizational dynamics, project location,
policies and regulations, unfamiliar technologies, and workforce
skill sets, interact both within a project and with entities outside
of the project. Without targeted strategies to manage complexity,
the project’s outcome may be negatively impacted. With proper
management strategies in place to control a diverse set of project
attributes and associated interfaces that lead to increased project
complexity, the probability that projects can be both successful
and predictable is increased.
Complexity Attribute and Indicator Development
With the developed definition of project complexity, a methodol-
ogy was developed to identify the level of project complexity. The
Fig. 1. Research approach
© ASCE 04016126-4 J. Constr. Eng. Manage.
J. Constr. Eng. Manage., 2017, 143(5): 04016126
Downloaded
from
ascelibrary.org
by
ECOLE
DE
TECHNOLOGIE
SUPERIEURE
on
07/15/19.
Copyright
ASCE.
For
personal
use
only;
all
rights
reserved.
term “complexity attribute” was used to represent factors that de-
scribe project complexity. Fifty major complexity attributes were
identified using complexity theory variables, the literature review
results, and industry experience. A description for each attribute
was then created that included (1) attribute definition, (2) examples,
(3) measures, (4) impacts, and (5) mitigation strategies. Creating
these descriptions for each complexity attribute aided in eliminat-
ing or combining attributes and enabled the attributes to be ranked
in an attempt to reduce the number of attributes to a more mean-
ingful and manageable number because of the similarity or duplic-
ability. The ranking process ultimately resulted in a reduced list of
35 complexity attributes. The complexity attributes were then
grouped into categories to aid in understanding the general nature
of the attributes. Eleven categories were proposed including the
following: (1) stakeholder management; (2) project governance;
(3) legal; (4) fiscal planning; (5) interfaces; (6) scope definition;
(7) location; (8) design and technology; (9) project resources;
(10) quality; (11) and execution targets. A category can have a
number of different complexity attributes. Table 3 presents the list
of 35 complexity attributes associated with 11 categories.
The identified complexity attributes presented in Table 3 were
used to develop the complexity indicators thought to measure the
associated attributes. Each attribute-measuring indicator was
then converted to one question for data collection. For complexity
measuring purposes, each attribute has one or more indicators
deemed relevant to measuring it. Ninety-two complexity indicators
were finally identified to measure the 35 associated complexity
attributes. Fig. 2 presents the complexity measurement hierarchy
for a single category. This hierarchical framework is discussed
in more detail in the data collection process section that follows.
Research Hypothesis
To verify the complexity attributes that truly describe project com-
plexity, the significance in differentiating low-complexity projects
from high-complexity projects based on the indicators used to mea-
sure those attributes was tested. If a complexity indicator was not
Table 3. Thirty-Five Identified Complexity Attributes
Category Number Attribute
Stakeholder management 1 Clarity of business objectives
2 Level of stakeholder cohesion
3 Public profile
4 Social and political influences surrounding project location
Governance 5 Joint ventures
6 Level of authorizing approvals and duration of receiving proposals
7 Level of control
8 Owner, partnerships
Legal 9 Legal
10 Permitting and regulatory requirements
Fiscal planning 11 Commercial burdens
12 Fiscal planning or financing (funding stream, uncertain political environment)
Interfaces 13 Interfaces within the project
14 Number of participants
15 Number of suppliers, subcontractors, contractors
Scope definition 16 Change management (dynamics of market and environment)
17 Clarity of scope definition
Location 18 Climate
19 Local content requirements
20 Logistics
21 Number of locations
22 Physical location
Design and technology 23 Design [number of process steps, health and safety executive (HSE) hazards,
number of recycles, exotic materials]
24 Technology
Project resources 25 Direct field labor management
26 Productivity
27 Resource availability
28 Team experience
29 Turnover
Quality management 30 Quality of suppliers, subcontractors, contractors
31 Unfamiliar procurement
Execution targets 32 Cost targets
33 Schedule targets [schedule targets was defined as the level of schedule
aggressiveness (duration or overlap of engineering and construction)
in relation to industry benchmarks]
34 Schedule (schedule was defined as the number of steps/activities/critical
paths/successors/etc. identified to meet the time objectives)
35 Strategic importance of the project
Fig. 2. Complexity measurement hierarchy
© ASCE 04016126-5 J. Constr. Eng. Manage.
J. Constr. Eng. Manage., 2017, 143(5): 04016126
Downloaded
from
ascelibrary.org
by
ECOLE
DE
TECHNOLOGIE
SUPERIEURE
on
07/15/19.
Copyright
ASCE.
For
personal
use
only;
all
rights
reserved.
statistically significant for describing and measuring project com-
plexity, it was excluded from the list. The significance level (α) for
testing the hypothesis is discussed in the research results section.
The primary research hypothesis was proposed to test the signifi-
cance of complexity indicators. The research team produced this
proposed hypothesis:
Null Hypothesis (H0)—The identified project complexity
indicators are not significant in differentiating low-complexity
projects from high-complexity projects.
Alternative Hypothesis (H1)—The identified project complex-
ity indicators are significant in differentiating low-complexity
projects from high-complexity projects.
The assessment of the hypothesis drove the data collection and
analysis techniques. This hypothesis was quantitatively tested for
each indicator that was developed to measure the associated com-
plexity attribute. Ninety-two complexity indicators were developed
to measure 35 complexity attributes presented in Table 3; therefore,
92 corresponding individual hypotheses were tested. Each hypoth-
esis was tested using statistical methods based on factual historical
project data collected through the survey. The hypothesis testing
process resulted in a list of significant complexity indicators that
function as the measures of project complexity.
Data Collection
After developing the project complexity definition, identifying the
complexity attributes, and developing the complexity indicators
used to measure each associated attribute, the research team imple-
mented the data collection process to collect the data that were
usable to test the proposed hypothesis and to determine which
indicators functioned as measures of project complexity. When
considering different data collection approaches, the intent of
the data collection, the type of data collected, possible analysis
processes, sample sizes, interpretation, and advantages/disadvan-
tages of the approach to derive a set of survey questions were taken
into account. The questions used to collect the data were based on
the developed complexity indicators central to the measurement of
complexity attributes.
The data were collected through a survey to test the relevant
hypothesis. Data analysis helped in confirming the definition of
complexity including theoretical concepts and complexity’s attrib-
utes, determining different levels of complexity, and providing the
basis for assessing the impact of project complexity on the use of
best practices. To support the survey, different ways of categorizing
the level of complexity based on the proposed complexity defini-
tion were described. The survey then captured industry project-
focused data on the proposed definition of complexity, levels of
project complexity, and measures of complexity indicators. The
survey was sent to Construction Industry Institute (CII) member
companies, and then follow-up occurred with the survey contact
person (either through e-mails or phone calls) to increase the re-
sponse rate.
The survey questionnaire was developed based upon the com-
plexity measurement hierarchy (Fig. 2). With agreement from the
industry practitioners on using the term complexity indicator to in-
dicate complexity measures, the academic research team members
developed a set of complexity indicators based on literature find-
ings and the inputs from industry practitioners. The measurements
for the indicators were revised through several iterations of survey
development. In the end, the research team decided to use a seven-
point Likert scale for many of the indicators. The seven-point Likert
scale was decided upon for several reasons, including that this is the
scale used for the CII Benchmarking and Metrics (CII 2012), which
has been tested and used for many years by CII, and that it
improved respondents’ ease of use because the survey was quite
long. Additionally, the survey was administered to CII members,
who understand this scale of measurement. The descriptors on the
seven points were modified for each question to be relevant. Ques-
tions that could not be measured using the seven-point Likert
scale were questions the respondent needed to access specific
project data to answer (continuous scale), such as project cost
or full-time equivalent project team members. This effort was co-
ordinated with the expectation of developing statistically via-
ble data.
For data collection purposes, each attribute had one or more
indicators deemed relevant to measuring it. Each complexity indi-
cator was converted to one question, and the survey was developed
to collect data on each question in the complexity matrix. The ques-
tionnaire was then refined by the industry practitioners and the CII
research committee. Many changes were recommended, and it was
decided to use a seven-point scale as a basis for assessing certain
complexity indicators. The research team revised the survey based
on these inputs and piloted the survey to ensure it was viable. After
the survey, the collected data were analyzed. The set of questions
significant in differentiating high-complexity projects from low-
complexity projects determined the corresponding indicators that
are significant in measuring project complexity.
The survey, containing 106 survey questions and requiring 152
responses, was structured into three sections including the follow-
ing: (1) General Project Description, (2) Project Complexity
Metrics, and (3) Best Practice Implementation. Responses were
a number, yes/no, or an ordinal scale (e.g., one to seven with
one being low and seven being high complexity for a measure).
Section 1, General Project Description, consisted of 16 questions
that provided general information and project characteristics of the
surveyed projects such as project type, project cost/schedule, and
design/procurement/construction contract type. Section 2, Project
Complexity Metrics, consisted of 73 questions with 92 responses.
These 92 responses were used to collect data for 92 developed
complexity indicators that measure the 35 associated complexity
attributes. Section 3, Best Practice Implementation, had 13 ques-
tions asking the level of best practice implementation for each
project. At the beginning of the survey, each respondent was asked
to complete the survey for one high-complexity project and one
low-complexity project based on the survey instructions and their
understanding of complexity. The intent of the survey was to assess
the different complexity indicators based on responses between
low-complexity projects and high-complexity projects. Differences
had to be statistically significant to argue that the indicator was a
true reflection of project complexity.
The survey process was conducted online. After the question-
naire framework was developed for the survey, a pilot test was
conducted both using hard copies of the survey and the CII online
survey software to refine the survey questionnaire, test the appro-
priateness of each question, and ensure that the survey is viable.
The survey was pilot tested by several industry research team
members on 10 projects. The responses for the pilot survey were
gathered and analyzed to eliminate any questions or information
that was not appropriate to the survey. These pilot surveys helped
identify several issues with the survey and helped identify poten-
tial statistical analyses that would be conducted on the data
collected from full deployment of the survey. After the question-
naire was validated, the survey transmittal memorandum, survey
instructions, and final questionnaire were uploaded to the CII
online survey system and sent to CII company members. The
questionnaire was sent to 140 CII company members to
collect data.
© ASCE 04016126-6 J. Constr. Eng. Manage.
J. Constr. Eng. Manage., 2017, 143(5): 04016126
Downloaded
from
ascelibrary.org
by
ECOLE
DE
TECHNOLOGIE
SUPERIEURE
on
07/15/19.
Copyright
ASCE.
For
personal
use
only;
all
rights
reserved.
Data Analysis and Research Result
The focus of the statistical analysis was to test the research hypoth-
esis and determine the complexity indicators that are significant in
differentiating low-complexity projects from high-complexity proj-
ects. Several different statistical tests were used based on the type of
question response. One of the primary objectives of this research
was to determine how to measure complexity while focusing on a
large array of measures. Survey respondents were asked two sep-
arate times to evaluate the complexity of their project, once at the
beginning of the survey and once toward the end. The statistical
analysis consistent with the data characteristics was conducted.
For example because project complexity was measured by different
indicators that describe the associated attributes, the statistical
analysis was implemented to determine which indicators should
be considered as significant and best reflect project complexity.
In other words, testing which indicators were statistically signifi-
cant in differentiating between low-complexity projects and high-
complexity projects helped the researchers understand which
indicators have an important contribution to describing a project’s
complexity. After that, the analysis process focused on these sig-
nificant indicators. The primary question of interest is, “Is there a
clear difference between low complexity projects and high
complexity projects with regards to a specific indicator?” Both ex-
ploratory and inferential statistics were used to determine if this
difference existed.
Exploratory Statistics
Exploratory statistics in this research were graphical displays in-
cluding boxplots and bar-chart graphics to visualize the data.
Side-by-side boxplots were used whenever the data were counts,
dollars, or other numerical values. The boxplots illustrated the dis-
tribution of the data, indicating outliers, minimum and maximum
values, first quartile and third quartile, and median. Bar charts
were used to describe both Likert (seven-point scale) and binary
(yes/no) type data. The x-axis of the bar chart consists of the Likert
scale responses, and the y-axis consists of the observed frequencies
of each of the different possible responses. The side-by-side box-
plots and bar charts allow for visual comparison of the data between
low-complexity projects and high-complexity projects.
Inferential Statistics
Depending on the type of data produced from the survey, the meth-
ods of analysis varied. This was because there are different assump-
tions and limitations to the statistical analysis tests. Table 4
summarizes the basic formal statistical methods that were used
for data analysis in this research. P-values that indicated the
statistical significance of differences between the two groups
(low-complexity projects versus high-complexity projects) were
generated through the relevant tests.
To run the analysis, the Survey Visualization Tool program was
used for the statistical approaches (both formal and descriptive) as
described in Table 4. The survey data were initially cleaned, coded,
and then input into the program. The data analysis results were gen-
erated regarding the different methods of testing, and the statistical
finding (P-value of each complexity indicator) was presented in
Table 5.
Research Results
General Survey Data Characterizations
and Descriptive Analysis
Forty-four survey responses were provided from the online survey.
The survey response rate was 31.4%. Of these responses, 30 re-
sponses were for high-complexity projects, and 14 responses were
for low-complexity projects, as subjectively rated by the respondent
at the start of the survey (high complexity and low complexity were
the only possible answers). Before selecting a project for the sur-
vey, the respondents were provided the relevant information in a
Memorandum, the Survey Request, and the Survey Instruction.
Table 4. Statistical Analysis Methods
Statistical test Null/alternative hypothesis Assumptions
Two-sample t-test (adjusted R2): This test
was used where the response is a count or
numerical value.
Null hypothesis: The means for high-
complexity projects and low-complexity
projects are the same.
The two groups (high-complexity projects and
low-complexity projects) follow a normal distribution.
Alternative hypothesis: The means for high-
complexity projects and low-complexity
projects are different.
Each project was independent from other projects.
Kruskal–Wallis/Wilcoxon test: This test
was used for Likert data (ordinal seven-
point scale), where it could not necessarily
be assumed that the data follows a normal
distribution.
Null hypothesis: The probability that the
median of high-complexity projects is greater
than the median of low-complexity projects on
this question is 0.5 (the distributions are the
same).
The two groups follow an identically
scaled distribution.
Alternative hypothesis: The probability that
the median of high-complexity projects is
greater than the median of low-complexity
projects on this question is not equal to 0.5 (the
distributions are not the same).
Each project was independent of other projects.
Chi-squared test (Nagelkerke’s R2
): This
test was used for survey questions with
binary responses (“Yes” or “No”
response), testing whether the observed
frequencies of “Yes” or “No” are equal for
both high-complexity projects and low-
complexity projects.
Null hypothesis: The observed frequencies of
“Yes” and “No” for high-complexity projects
are not different from those for low-
complexity projects.
Each project was independent of other projects.
Alternative hypothesis: The observed
frequencies of “Yes” and “No” for high-
complexity projects are different from those
for low-complexity projects.
© ASCE 04016126-7 J. Constr. Eng. Manage.
J. Constr. Eng. Manage., 2017, 143(5): 04016126
Downloaded
from
ascelibrary.org
by
ECOLE
DE
TECHNOLOGIE
SUPERIEURE
on
07/15/19.
Copyright
ASCE.
For
personal
use
only;
all
rights
reserved.
Table 5. Significant Complexity Indicators and Corresponding P-Values
Category/attribute Complexity indicator (CI) P-value
Stakeholder management
Strategic importance of the project CI-1_Influence of this project on the organization’s overall success (e.g., profitability,
growth, future industry position, public visibility, and internal strategic alignment).
0.0821
Project impact of local social
and political groups (stakeholders) CI-2_Impact of required approvals from external stakeholders on the original project
execution plan.
0.0341
CI-3_Impact of required inspection by external (regulatory) agencies/entities on
original project execution plan.
0.0012
Governance
Joint ventures CI-4_Total number of joint-venture partners in this project. 0.0631
Owner, partnerships
Level of authorizing approvals
and duration of receiving proposals.
CI-5_Number of executive oversight entities above the project management team who
will have decision-making authority over the project execution plan.
0.047
Level of control CI-6_Number of times on this project that a change order will go above the Project
Manager for approval.
0.0542
Fiscal planning
Fiscal planning, or financing (funding
stream, uncertain political environment)
CI-7_Number of funding phases (gates) from concept to project completion. 0.0756
CI-8_Specific delays or difficulties in securing project funding. 0.025
Quality
Quality of suppliers, subcontractors, etc. CI-9_Quality of bulk materials during project execution. 0.0181
Legal
Permitting and regulatory requirements CI-10_Number of total permits to be required. 0.0761
CI-11_Level of difficulty in obtaining permits. 0.0497
Legal CI-12_Difficulty in obtaining design approvals. 0.0718
CI-13_Impact of external agencies on the project execution plan. 0.039
Interfaces
Interfaces within the project CI-14_Peak number of participants [full-time equivalents (FTE)] on the project
management team during the detailed engineering/design phase of the project.
0.0207
Number of participants
CI-15_Peak number of participants [full-time equivalents (FTE)] on the project
management team during the procurement phase of the project.
0.0313
Execution target
Cost targets CI-16_Compare target project funding against industry/internal benchmarks. 0.0118
Schedule targets CI-17_Compare target project schedule against industry/internal benchmarks. 0.0366
Design and technology
Design (number of process steps,
HSE hazards, number of recycles,
exotic materials)
CI-18_Difficulty in system design and integration on this project compared to a typical
project for your company.
0.0048
Technology CI-19_Company’s degree of familiarity with technologies that will be involved in
detailed engineering/design project phase.
0.0138
CI-20_Company’s degree of familiarity with technologies that will be involved in
construction project phase.
0.0065
CI-21_Company’s degree of familiarity with technologies that will be involved in
operating facility project phase.
0.0106
Location
Number of locations CI-22_Number of execution locations which will be used on this project during
detailed engineering/design phase.
0.0324
Logistics CI-23_Number of execution locations which will be used on the project during
fabrication (bulk materials and equipment) phase.
0.0114
CI-24_Impact of project location on the project execution plan. 0.017
Scope definition
Change management (dynamics
of market and environment)
CI-25_Identify the percentage of engineering/design completed at the start of
construction.
0.0524
CI-26_Clarity of the change management process to key project team members. 0.0757
CI-27_Impact of the magnitude of change orders on project execution. 0.003
CI-28_Impact of the timing of change orders on project execution. 0.0129
CI-29_ RFIs drive project design changes. 0.0268
Project resources
Direct field labor management CI-30_Percentage of project/construction management staff who will work on the
project compared to planned project/construction management staff.
0.0994
CI-31_Quality issues of skilled field craft labor during project construction. 0.0381
Resource availability CI-32_Frequency of workarounds (work activities out of sequence to continue)
because materials are not available when needed to support construction.
0.0293
Turnover CI-33_Percentage of craft labor turnover. 0.0459
CI-34_Percentage of craft labor sourced locally (within 100-mile radius of job site). 0.0866
© ASCE 04016126-8 J. Constr. Eng. Manage.
J. Constr. Eng. Manage., 2017, 143(5): 04016126
Downloaded
from
ascelibrary.org
by
ECOLE
DE
TECHNOLOGIE
SUPERIEURE
on
07/15/19.
Copyright
ASCE.
For
personal
use
only;
all
rights
reserved.
This information included the project complexity definition that
had been developed as a research basis at the initial stage of the
research. The descriptive instructions to preliminarily assess
complexity levels of a project had also been provided based on
the preliminarily identified complexity measures such as project
size, project schedule, number of process steps, or technology
familiarity. Additionally, the respondents were also asked to select
the projects based on their perspective of complexity. The respond-
ents were asked again about the level of complexity for the
surveyed project in the final question of the “Project Complexity
Metrics” section of the survey. This question asked the respondents
to evaluate the project’s complexity on an ordinal seven-point scale
with one being low complexity and seven being high complexity.
The implication of this Likert rating was to verify the initial selec-
tion of complexity level for the surveyed project. The rationale for
asking this question is that, after answering all the survey questions
plus their perspective of complexity, the respondents have more
information and understanding of project complexity, and then re-
assess the complexity level of the selected project on this Likert
scale. The average scores of the Likert scale question for 14
low-complexity projects and 30 high-complexity projects were
2.34 and 5.25 respectively. This confirmed that the perception
of low versus high complexity initially classified by the survey re-
spondents was consistent with the survey data.
The survey data set was descriptively analyzed to ensure data
characteristics were understood. This effort was also used to follow
up on the survey responses and to correct any inappropriate or erro-
neous data. Among the 44 projects, there were 30 heavy industrial
projects, 3 light industrial projects, 3 building projects, 3 infrastruc-
ture projects, and 5 projects of other types. The responses ranged
from project costs of $0.4 million to $5,600 million (average
$140 million for low-complexity projects and $417 million for
high-complexity projects). The total schedule durations for the sur-
vey projects were from 8 months to 70 months (average 25 months
for low-complexity projects and 30 months for high-complexity
projects).
Testing for Differences between High-Complexity Projects
and Low-Complexity Projects
The primary goal of this research was to develop a methodology to
fully explore and assess project complexity by identifying the com-
plexity indicators used to describe and measure project complexity.
In other words, the complexity indicators that were significant in
differentiating low-complexity projects from high-complexity proj-
ects were identified and tested. The significance level of 0.05
(α ¼ 0.05) was initially chosen to test the significance of each com-
plexity indicator in differentiating low-complexity projects from
high-complexity projects. Twenty-four out of 92 complexity
indicators were found significant with the significance level of
0.05 as a result of the analysis. This result was then reviewed
by the research team. Upon reviewing the initial analysis result,
the industry members of the research team determined that all
aspects of project complexity were not sufficiently described by
these 24 complexity indicators. Based on industry experience
and discussion, several other complexity indicators that had
P-values close to 0.05 were important in measuring project com-
plexity and should be included in the list. The significance level
was ultimately increased from 0.05 to 0.1. The research team
deemed this an acceptable significance level based on the industry
and research standards and intended use for the results.
With the significance level of 0.1, there were 36 complexity
indicators (CIs) associated with 22 complexity attributes that were
statistically significant in differentiating low-complexity projects
from high-complexity projects (the indicators that have P-value
not greater than 0.1). This result was reviewed again. Among those
36 statistically significant indicators, two indicators had high cor-
relations with two other indicators. The first indicator was “Average
number of participants during the detailed engineering/design
phase” that had very high correlation with the indicator “Peak
number of participants [full-time equivalents (FTE)] on the project
management team during the detailed engineering/design phase of
the project.” The correlation coefficient between these two indica-
tors was 0.99 (R ¼ 0.99). The second indicator was, “Average
number of participants during the procurement phase,” which
had very high correlation with the indicator, “Peak number of par-
ticipants [full-time equivalents (FTE)] on the project management
team during the procurement phase of the project.” The correlation
coefficient between these two indicators was 0.98 (R ¼ 0.98). Stat-
istically, two or more highly correlated indicators may measure the
same characteristic of project complexity. As a result, those two
indicators as described previously were excluded from the signifi-
cant indicator list. Ultimately, a list of 34 complexity indicators that
measure 22 complexity attributes was finalized as presented in
Table 5. These indicators were considered critical descriptors of
project complexity and used as a basis for further research. The
further relevant research includes developing a project complexity
assessment and management tool, developing project complexity
management strategies, and developing a project complexity pre-
dictive model (not covered in scope of this paper).
The complexity indicators and complexity attributes listed in
Table 5 are statistically significant in differentiating low-complexity
projects from high-complexity projects. These indicators can be
used to describe and measure the complexity of a project. This
finding assists scholars and practitioners in identifying potential
problem areas that may arise in the project development and deliv-
ery process. A proactive project management approach can then
develop appropriate management strategies to deal with project
complexity. Implementing proper management strategies relevant
to the identified complexity indicators will help organizations in
reducing the likelihood that the associated attributes will cause poor
project performance.
Conclusion
This research provided a constructive way to assess and measure
aspects of project complexity. The research contributes to enriching
the theoretical basis in the field of project management by
identifying the root contributors to project complexity defined as
complexity indicators. The degree of project complexity was deter-
mined by identifying and measuring the complexity attributes. This
knowledge can help project participants develop their competencies
in managing complex projects in different industry sectors. More-
over, this knowledge can provide project management scholars a
basis to study the positive impacts and reduce the negative impacts
of project complexity in managing projects in an effective manner.
Practically, the research implications of identifying 22 complexity
attributes and 34 associated complexity indicators were that, when
knowing the true contributors to project complexity, project man-
agement practitioners would be able to focus on those complexity
indicators, prioritize their activities to the identified complexity
attributes, and allocate the limited project resources to address
those attributes. Understanding the complexity indicators also helps
project practitioners develop an appropriate management strategy
to minimize the impact of the identified complexity indicators.
One limitation of this study is that the research team chose not to
describe complexity primarily in terms of a project’s physical fea-
tures but rather to address complexity as it is related to managing
© ASCE 04016126-9 J. Constr. Eng. Manage.
J. Constr. Eng. Manage., 2017, 143(5): 04016126
Downloaded
from
ascelibrary.org
by
ECOLE
DE
TECHNOLOGIE
SUPERIEURE
on
07/15/19.
Copyright
ASCE.
For
personal
use
only;
all
rights
reserved.
projects. With this focus, the study did not consider complexity
measures that are specifically related to the physical features of
a project. This limitation could be addressed through future re-
search that studies project complexity focusing on projects in a spe-
cific industry sector with their unique physical features. Projects in
different sectors have different physical features that more or less
contribute to project complexity. Therefore, focusing more on
physical features of a project can help in exploring other specific
complexity attributes in the corresponding sector. This result could
further enhance the theoretical basis and understanding of project
complexity and its impact on project development and delivery.
In this research, a set of complexity management strategies was
developed. Each indicator has a number of management strategies
that can be applied to minimize the complexity impact. One limi-
tation to this paper is that this separate, second contribution of the
research project, the process of developing complexity manage-
ment strategy, will be published in another paper.
Acknowledgments
The study described in this paper was supported by the Construc-
tion Industry Institute (CII RT 305 Research Project). This paper
forms a part of the research project titled “Measuring Project
Complexity and Its Impact,” from which other deliverables have
been produced with common background and methodology. The
authors also acknowledge the contributions of other CII RT 305
Research Team members for providing significant inputs to
complete this study.
References
Baccarini, D. (1996). “The concept of project complexity—A review.”
Int. J. Project Manage., 14(4), 201–204.
Brockmann, D. I. C., and Girmscheid, I. G. (2007). “Complexity of
megaprojects.” CIB World Building Congress 2007, International
Council for Building (CIB), Rotterdam, Netherlands, 219–230.
Chu, D., Strand, R., and Fjelland, R. F. (2003). “Theories of
complexity: Common denominators in complex systems.” Complexity,
8(3), 19–30.
CII (Construction Industry Institute). (2012). “Benchmarking and metrics:
Project level survey, version 11.” Univ. of Texas at Austin, Austin, TX.
CII (Construction Industry Institute). (2016a). “Measuring project
complexity and its impact: Research Rep. No. 305-11.” CII RT
305–11, Univ. of Texas at Austin, Austin, TX.
CII (Construction Industry Institute). (2016b). “Measuring project
complexity and its impact: Research Summary 305-1.” CII RT 305–1,
Univ. of Texas at Austin, Austin, TX.
Edmonds, B. (1999). “Syntactic measures of complexity.” Ph.D. thesis,
Univ. of Manchester, Manchester, U.K.
GAPPS (Global Alliance for Project Performance Standards). (2007). “A
framework for performance based competency standards for global
level 1 and 2 project managers.” Sydney, NSW, Australia.
Gidado, K. (1996). “Project complexity: The focal point of construction
production planning.” Constr. Manage. Econ., 14(3), 213–225.
Hass, K. B. (2008). “Introducing the new project complexity model.”
Manag. Concepts, 22–31.
Lucas, C. (2000). “Quantifying complexity theory.” 〈http://www.calresco.org
/lucas/quantify.htm〉.
Nassar, K., and Hegab, M. (2006). “Developing a complexity measure for
project schedules.” J. Constr. Eng. Manage., 10.1061/(ASCE)0733-
9364(2006)132:6(554), 554–561.
Perrow, C. (1965). “Hospitals: Technology, structure, and goals.” Hand-
book of organizations, Rand McNally, Chicago, 910–971.
Puddicombe, M. (2012). “Novelty and technical complexity: Critical con-
structs in capital projects.” J. Constr. Eng. Manage., 10.1061/(ASCE)
CO.1943-7862.0000459, 613–620.
Remington, K., Zolin, R., and Turner, R. (2009). “A model of project com-
plexity: Distinguishing dimensions of complexity from severity.” Proc.,
9th Int. Research Network of Project Management Conf., International
Research Network on Organizing by Projects (IRNOP), Technische
Universität Berlin, Berlin.
Rosenhead, J. (1998). “Complexity theory and management practice.”
LSEOR 98.25, Dept. of Operational Research, London School of
Economics and Political Science, London.
Sbragia, R. (2000). “The interface between project managers and functional
managers in matrix organized product development projects.” 9th Int.
Conf. on Management of Technology, International Association for
Management of Technology, Univ. of Miami, Miami.
Stacey, R. D. (1992). Managing the unknowable: Strategic boundaries be-
tween order and chaos in organizations, Jossey-Bass, San Francisco.
Valle, V., Jr. (2000). Chaos, complexity and deterrence, National War
College, Washington, DC.
Vidal, L. A., and Marle, F. (2008). “Understanding project complexity: Im-
plications on project management.” Kybernetes, 37(8), 1094–1110.
Williams, T. M. (1999). “The need for new paradigms for complex
projects.” Int. J. Project Manage., 17(5), 269–273.
© ASCE 04016126-10 J. Constr. Eng. Manage.
J. Constr. Eng. Manage., 2017, 143(5): 04016126
Downloaded
from
ascelibrary.org
by
ECOLE
DE
TECHNOLOGIE
SUPERIEURE
on
07/15/19.
Copyright
ASCE.
For
personal
use
only;
all
rights
reserved.

More Related Content

Similar to **Exploring and Assessing Project Complexity-Dao;17.pdf

International Journal of Chaos, Control, Modelling and Simulation (IJCCMS)
International Journal of Chaos, Control, Modelling and Simulation (IJCCMS)International Journal of Chaos, Control, Modelling and Simulation (IJCCMS)
International Journal of Chaos, Control, Modelling and Simulation (IJCCMS)
ijccmsjournal
 
Causal models for the forensic investigation of structural failures
Causal models for the forensic investigation of structural failuresCausal models for the forensic investigation of structural failures
Causal models for the forensic investigation of structural failures
Franco Bontempi
 
IRJET- Interface Management and its Effect on Project Complexity in Constr...
IRJET- 	  Interface Management and its Effect on Project Complexity in Constr...IRJET- 	  Interface Management and its Effect on Project Complexity in Constr...
IRJET- Interface Management and its Effect on Project Complexity in Constr...
IRJET Journal
 
STUDY OF AGENT ASSISTED METHODOLOGIES FOR DEVELOPMENT OF A SYSTEM
STUDY OF AGENT ASSISTED METHODOLOGIES FOR DEVELOPMENT OF A SYSTEMSTUDY OF AGENT ASSISTED METHODOLOGIES FOR DEVELOPMENT OF A SYSTEM
STUDY OF AGENT ASSISTED METHODOLOGIES FOR DEVELOPMENT OF A SYSTEM
International Journal of Technical Research & Application
 
ugc cse ppr
ugc cse pprugc cse ppr
ugc cse pprjitu5488
 
microservice analysis elo
microservice analysis elomicroservice analysis elo
microservice analysis elo
fatimaahmed125567
 
Design Knowledge Gain by Structural Health Monitoring
Design Knowledge Gain by Structural Health MonitoringDesign Knowledge Gain by Structural Health Monitoring
Design Knowledge Gain by Structural Health Monitoring
Franco Bontempi
 
Requirements Engineering - System Vision
Requirements Engineering - System VisionRequirements Engineering - System Vision
Requirements Engineering - System Vision
Birgit Penzenstadler
 
Sociotechnical Systems in Virtual Organization: The Challenge of Coordinating...
Sociotechnical Systems in Virtual Organization: The Challenge of Coordinating...Sociotechnical Systems in Virtual Organization: The Challenge of Coordinating...
Sociotechnical Systems in Virtual Organization: The Challenge of Coordinating...Sociotechnical Roundtable
 
Name _____________________Bipedal AustralopithOBJECTIVES.docx
Name _____________________Bipedal AustralopithOBJECTIVES.docxName _____________________Bipedal AustralopithOBJECTIVES.docx
Name _____________________Bipedal AustralopithOBJECTIVES.docx
roushhsiu
 
Complexity in large engineering & construction programs
Complexity in large engineering & construction programsComplexity in large engineering & construction programs
Complexity in large engineering & construction programs
Bob Prieto
 
Keating and Katina (2015) Foundational perspectives for the emerging complex ...
Keating and Katina (2015) Foundational perspectives for the emerging complex ...Keating and Katina (2015) Foundational perspectives for the emerging complex ...
Keating and Katina (2015) Foundational perspectives for the emerging complex ...Polinho Katina
 
MarvinAndGarrett-SoS_ArchitectureModeling
MarvinAndGarrett-SoS_ArchitectureModelingMarvinAndGarrett-SoS_ArchitectureModeling
MarvinAndGarrett-SoS_ArchitectureModelingBob Garrett
 
ARCHITECTING IN THE CONTEXT OF AGILE SOFTWARE DEVELOPMENT: FRAGILITY VERSUS F...
ARCHITECTING IN THE CONTEXT OF AGILE SOFTWARE DEVELOPMENT: FRAGILITY VERSUS F...ARCHITECTING IN THE CONTEXT OF AGILE SOFTWARE DEVELOPMENT: FRAGILITY VERSUS F...
ARCHITECTING IN THE CONTEXT OF AGILE SOFTWARE DEVELOPMENT: FRAGILITY VERSUS F...
IJCSEA Journal
 
ARCHITECTING IN THE CONTEXT OF AGILE SOFTWARE DEVELOPMENT: FRAGILITY VERSUS F...
ARCHITECTING IN THE CONTEXT OF AGILE SOFTWARE DEVELOPMENT: FRAGILITY VERSUS F...ARCHITECTING IN THE CONTEXT OF AGILE SOFTWARE DEVELOPMENT: FRAGILITY VERSUS F...
ARCHITECTING IN THE CONTEXT OF AGILE SOFTWARE DEVELOPMENT: FRAGILITY VERSUS F...
IJCSEA Journal
 
Class notes
Class notesClass notes
Design Knowledge Gain by Structural Health Monitoring
Design Knowledge Gain by Structural Health MonitoringDesign Knowledge Gain by Structural Health Monitoring
Design Knowledge Gain by Structural Health Monitoring
Franco Bontempi
 
Design Knowledge Gain by Structural Health Monitoring
Design Knowledge Gain by Structural Health MonitoringDesign Knowledge Gain by Structural Health Monitoring
Design Knowledge Gain by Structural Health Monitoring
StroNGER2012
 
Concurrency Issues in Object-Oriented Modeling
Concurrency Issues in Object-Oriented ModelingConcurrency Issues in Object-Oriented Modeling
Concurrency Issues in Object-Oriented Modeling
IRJET Journal
 
Model Based Systems Thinking
Model Based Systems ThinkingModel Based Systems Thinking
Model Based Systems Thinking
sicrcw
 

Similar to **Exploring and Assessing Project Complexity-Dao;17.pdf (20)

International Journal of Chaos, Control, Modelling and Simulation (IJCCMS)
International Journal of Chaos, Control, Modelling and Simulation (IJCCMS)International Journal of Chaos, Control, Modelling and Simulation (IJCCMS)
International Journal of Chaos, Control, Modelling and Simulation (IJCCMS)
 
Causal models for the forensic investigation of structural failures
Causal models for the forensic investigation of structural failuresCausal models for the forensic investigation of structural failures
Causal models for the forensic investigation of structural failures
 
IRJET- Interface Management and its Effect on Project Complexity in Constr...
IRJET- 	  Interface Management and its Effect on Project Complexity in Constr...IRJET- 	  Interface Management and its Effect on Project Complexity in Constr...
IRJET- Interface Management and its Effect on Project Complexity in Constr...
 
STUDY OF AGENT ASSISTED METHODOLOGIES FOR DEVELOPMENT OF A SYSTEM
STUDY OF AGENT ASSISTED METHODOLOGIES FOR DEVELOPMENT OF A SYSTEMSTUDY OF AGENT ASSISTED METHODOLOGIES FOR DEVELOPMENT OF A SYSTEM
STUDY OF AGENT ASSISTED METHODOLOGIES FOR DEVELOPMENT OF A SYSTEM
 
ugc cse ppr
ugc cse pprugc cse ppr
ugc cse ppr
 
microservice analysis elo
microservice analysis elomicroservice analysis elo
microservice analysis elo
 
Design Knowledge Gain by Structural Health Monitoring
Design Knowledge Gain by Structural Health MonitoringDesign Knowledge Gain by Structural Health Monitoring
Design Knowledge Gain by Structural Health Monitoring
 
Requirements Engineering - System Vision
Requirements Engineering - System VisionRequirements Engineering - System Vision
Requirements Engineering - System Vision
 
Sociotechnical Systems in Virtual Organization: The Challenge of Coordinating...
Sociotechnical Systems in Virtual Organization: The Challenge of Coordinating...Sociotechnical Systems in Virtual Organization: The Challenge of Coordinating...
Sociotechnical Systems in Virtual Organization: The Challenge of Coordinating...
 
Name _____________________Bipedal AustralopithOBJECTIVES.docx
Name _____________________Bipedal AustralopithOBJECTIVES.docxName _____________________Bipedal AustralopithOBJECTIVES.docx
Name _____________________Bipedal AustralopithOBJECTIVES.docx
 
Complexity in large engineering & construction programs
Complexity in large engineering & construction programsComplexity in large engineering & construction programs
Complexity in large engineering & construction programs
 
Keating and Katina (2015) Foundational perspectives for the emerging complex ...
Keating and Katina (2015) Foundational perspectives for the emerging complex ...Keating and Katina (2015) Foundational perspectives for the emerging complex ...
Keating and Katina (2015) Foundational perspectives for the emerging complex ...
 
MarvinAndGarrett-SoS_ArchitectureModeling
MarvinAndGarrett-SoS_ArchitectureModelingMarvinAndGarrett-SoS_ArchitectureModeling
MarvinAndGarrett-SoS_ArchitectureModeling
 
ARCHITECTING IN THE CONTEXT OF AGILE SOFTWARE DEVELOPMENT: FRAGILITY VERSUS F...
ARCHITECTING IN THE CONTEXT OF AGILE SOFTWARE DEVELOPMENT: FRAGILITY VERSUS F...ARCHITECTING IN THE CONTEXT OF AGILE SOFTWARE DEVELOPMENT: FRAGILITY VERSUS F...
ARCHITECTING IN THE CONTEXT OF AGILE SOFTWARE DEVELOPMENT: FRAGILITY VERSUS F...
 
ARCHITECTING IN THE CONTEXT OF AGILE SOFTWARE DEVELOPMENT: FRAGILITY VERSUS F...
ARCHITECTING IN THE CONTEXT OF AGILE SOFTWARE DEVELOPMENT: FRAGILITY VERSUS F...ARCHITECTING IN THE CONTEXT OF AGILE SOFTWARE DEVELOPMENT: FRAGILITY VERSUS F...
ARCHITECTING IN THE CONTEXT OF AGILE SOFTWARE DEVELOPMENT: FRAGILITY VERSUS F...
 
Class notes
Class notesClass notes
Class notes
 
Design Knowledge Gain by Structural Health Monitoring
Design Knowledge Gain by Structural Health MonitoringDesign Knowledge Gain by Structural Health Monitoring
Design Knowledge Gain by Structural Health Monitoring
 
Design Knowledge Gain by Structural Health Monitoring
Design Knowledge Gain by Structural Health MonitoringDesign Knowledge Gain by Structural Health Monitoring
Design Knowledge Gain by Structural Health Monitoring
 
Concurrency Issues in Object-Oriented Modeling
Concurrency Issues in Object-Oriented ModelingConcurrency Issues in Object-Oriented Modeling
Concurrency Issues in Object-Oriented Modeling
 
Model Based Systems Thinking
Model Based Systems ThinkingModel Based Systems Thinking
Model Based Systems Thinking
 

Recently uploaded

Pile Foundation by Venkatesh Taduvai (Sub Geotechnical Engineering II)-conver...
Pile Foundation by Venkatesh Taduvai (Sub Geotechnical Engineering II)-conver...Pile Foundation by Venkatesh Taduvai (Sub Geotechnical Engineering II)-conver...
Pile Foundation by Venkatesh Taduvai (Sub Geotechnical Engineering II)-conver...
AJAYKUMARPUND1
 
ASME IX(9) 2007 Full Version .pdf
ASME IX(9)  2007 Full Version       .pdfASME IX(9)  2007 Full Version       .pdf
ASME IX(9) 2007 Full Version .pdf
AhmedHussein950959
 
RAT: Retrieval Augmented Thoughts Elicit Context-Aware Reasoning in Long-Hori...
RAT: Retrieval Augmented Thoughts Elicit Context-Aware Reasoning in Long-Hori...RAT: Retrieval Augmented Thoughts Elicit Context-Aware Reasoning in Long-Hori...
RAT: Retrieval Augmented Thoughts Elicit Context-Aware Reasoning in Long-Hori...
thanhdowork
 
Student information management system project report ii.pdf
Student information management system project report ii.pdfStudent information management system project report ii.pdf
Student information management system project report ii.pdf
Kamal Acharya
 
Governing Equations for Fundamental Aerodynamics_Anderson2010.pdf
Governing Equations for Fundamental Aerodynamics_Anderson2010.pdfGoverning Equations for Fundamental Aerodynamics_Anderson2010.pdf
Governing Equations for Fundamental Aerodynamics_Anderson2010.pdf
WENKENLI1
 
在线办理(ANU毕业证书)澳洲国立大学毕业证录取通知书一模一样
在线办理(ANU毕业证书)澳洲国立大学毕业证录取通知书一模一样在线办理(ANU毕业证书)澳洲国立大学毕业证录取通知书一模一样
在线办理(ANU毕业证书)澳洲国立大学毕业证录取通知书一模一样
obonagu
 
weather web application report.pdf
weather web application report.pdfweather web application report.pdf
weather web application report.pdf
Pratik Pawar
 
Sachpazis:Terzaghi Bearing Capacity Estimation in simple terms with Calculati...
Sachpazis:Terzaghi Bearing Capacity Estimation in simple terms with Calculati...Sachpazis:Terzaghi Bearing Capacity Estimation in simple terms with Calculati...
Sachpazis:Terzaghi Bearing Capacity Estimation in simple terms with Calculati...
Dr.Costas Sachpazis
 
block diagram and signal flow graph representation
block diagram and signal flow graph representationblock diagram and signal flow graph representation
block diagram and signal flow graph representation
Divya Somashekar
 
power quality voltage fluctuation UNIT - I.pptx
power quality voltage fluctuation UNIT - I.pptxpower quality voltage fluctuation UNIT - I.pptx
power quality voltage fluctuation UNIT - I.pptx
ViniHema
 
Water Industry Process Automation and Control Monthly - May 2024.pdf
Water Industry Process Automation and Control Monthly - May 2024.pdfWater Industry Process Automation and Control Monthly - May 2024.pdf
Water Industry Process Automation and Control Monthly - May 2024.pdf
Water Industry Process Automation & Control
 
Fundamentals of Electric Drives and its applications.pptx
Fundamentals of Electric Drives and its applications.pptxFundamentals of Electric Drives and its applications.pptx
Fundamentals of Electric Drives and its applications.pptx
manasideore6
 
AKS UNIVERSITY Satna Final Year Project By OM Hardaha.pdf
AKS UNIVERSITY Satna Final Year Project By OM Hardaha.pdfAKS UNIVERSITY Satna Final Year Project By OM Hardaha.pdf
AKS UNIVERSITY Satna Final Year Project By OM Hardaha.pdf
SamSarthak3
 
MCQ Soil mechanics questions (Soil shear strength).pdf
MCQ Soil mechanics questions (Soil shear strength).pdfMCQ Soil mechanics questions (Soil shear strength).pdf
MCQ Soil mechanics questions (Soil shear strength).pdf
Osamah Alsalih
 
Top 10 Oil and Gas Projects in Saudi Arabia 2024.pdf
Top 10 Oil and Gas Projects in Saudi Arabia 2024.pdfTop 10 Oil and Gas Projects in Saudi Arabia 2024.pdf
Top 10 Oil and Gas Projects in Saudi Arabia 2024.pdf
Teleport Manpower Consultant
 
Final project report on grocery store management system..pdf
Final project report on grocery store management system..pdfFinal project report on grocery store management system..pdf
Final project report on grocery store management system..pdf
Kamal Acharya
 
一比一原版(SFU毕业证)西蒙菲莎大学毕业证成绩单如何办理
一比一原版(SFU毕业证)西蒙菲莎大学毕业证成绩单如何办理一比一原版(SFU毕业证)西蒙菲莎大学毕业证成绩单如何办理
一比一原版(SFU毕业证)西蒙菲莎大学毕业证成绩单如何办理
bakpo1
 
Hybrid optimization of pumped hydro system and solar- Engr. Abdul-Azeez.pdf
Hybrid optimization of pumped hydro system and solar- Engr. Abdul-Azeez.pdfHybrid optimization of pumped hydro system and solar- Engr. Abdul-Azeez.pdf
Hybrid optimization of pumped hydro system and solar- Engr. Abdul-Azeez.pdf
fxintegritypublishin
 
Standard Reomte Control Interface - Neometrix
Standard Reomte Control Interface - NeometrixStandard Reomte Control Interface - Neometrix
Standard Reomte Control Interface - Neometrix
Neometrix_Engineering_Pvt_Ltd
 
Planning Of Procurement o different goods and services
Planning Of Procurement o different goods and servicesPlanning Of Procurement o different goods and services
Planning Of Procurement o different goods and services
JoytuBarua2
 

Recently uploaded (20)

Pile Foundation by Venkatesh Taduvai (Sub Geotechnical Engineering II)-conver...
Pile Foundation by Venkatesh Taduvai (Sub Geotechnical Engineering II)-conver...Pile Foundation by Venkatesh Taduvai (Sub Geotechnical Engineering II)-conver...
Pile Foundation by Venkatesh Taduvai (Sub Geotechnical Engineering II)-conver...
 
ASME IX(9) 2007 Full Version .pdf
ASME IX(9)  2007 Full Version       .pdfASME IX(9)  2007 Full Version       .pdf
ASME IX(9) 2007 Full Version .pdf
 
RAT: Retrieval Augmented Thoughts Elicit Context-Aware Reasoning in Long-Hori...
RAT: Retrieval Augmented Thoughts Elicit Context-Aware Reasoning in Long-Hori...RAT: Retrieval Augmented Thoughts Elicit Context-Aware Reasoning in Long-Hori...
RAT: Retrieval Augmented Thoughts Elicit Context-Aware Reasoning in Long-Hori...
 
Student information management system project report ii.pdf
Student information management system project report ii.pdfStudent information management system project report ii.pdf
Student information management system project report ii.pdf
 
Governing Equations for Fundamental Aerodynamics_Anderson2010.pdf
Governing Equations for Fundamental Aerodynamics_Anderson2010.pdfGoverning Equations for Fundamental Aerodynamics_Anderson2010.pdf
Governing Equations for Fundamental Aerodynamics_Anderson2010.pdf
 
在线办理(ANU毕业证书)澳洲国立大学毕业证录取通知书一模一样
在线办理(ANU毕业证书)澳洲国立大学毕业证录取通知书一模一样在线办理(ANU毕业证书)澳洲国立大学毕业证录取通知书一模一样
在线办理(ANU毕业证书)澳洲国立大学毕业证录取通知书一模一样
 
weather web application report.pdf
weather web application report.pdfweather web application report.pdf
weather web application report.pdf
 
Sachpazis:Terzaghi Bearing Capacity Estimation in simple terms with Calculati...
Sachpazis:Terzaghi Bearing Capacity Estimation in simple terms with Calculati...Sachpazis:Terzaghi Bearing Capacity Estimation in simple terms with Calculati...
Sachpazis:Terzaghi Bearing Capacity Estimation in simple terms with Calculati...
 
block diagram and signal flow graph representation
block diagram and signal flow graph representationblock diagram and signal flow graph representation
block diagram and signal flow graph representation
 
power quality voltage fluctuation UNIT - I.pptx
power quality voltage fluctuation UNIT - I.pptxpower quality voltage fluctuation UNIT - I.pptx
power quality voltage fluctuation UNIT - I.pptx
 
Water Industry Process Automation and Control Monthly - May 2024.pdf
Water Industry Process Automation and Control Monthly - May 2024.pdfWater Industry Process Automation and Control Monthly - May 2024.pdf
Water Industry Process Automation and Control Monthly - May 2024.pdf
 
Fundamentals of Electric Drives and its applications.pptx
Fundamentals of Electric Drives and its applications.pptxFundamentals of Electric Drives and its applications.pptx
Fundamentals of Electric Drives and its applications.pptx
 
AKS UNIVERSITY Satna Final Year Project By OM Hardaha.pdf
AKS UNIVERSITY Satna Final Year Project By OM Hardaha.pdfAKS UNIVERSITY Satna Final Year Project By OM Hardaha.pdf
AKS UNIVERSITY Satna Final Year Project By OM Hardaha.pdf
 
MCQ Soil mechanics questions (Soil shear strength).pdf
MCQ Soil mechanics questions (Soil shear strength).pdfMCQ Soil mechanics questions (Soil shear strength).pdf
MCQ Soil mechanics questions (Soil shear strength).pdf
 
Top 10 Oil and Gas Projects in Saudi Arabia 2024.pdf
Top 10 Oil and Gas Projects in Saudi Arabia 2024.pdfTop 10 Oil and Gas Projects in Saudi Arabia 2024.pdf
Top 10 Oil and Gas Projects in Saudi Arabia 2024.pdf
 
Final project report on grocery store management system..pdf
Final project report on grocery store management system..pdfFinal project report on grocery store management system..pdf
Final project report on grocery store management system..pdf
 
一比一原版(SFU毕业证)西蒙菲莎大学毕业证成绩单如何办理
一比一原版(SFU毕业证)西蒙菲莎大学毕业证成绩单如何办理一比一原版(SFU毕业证)西蒙菲莎大学毕业证成绩单如何办理
一比一原版(SFU毕业证)西蒙菲莎大学毕业证成绩单如何办理
 
Hybrid optimization of pumped hydro system and solar- Engr. Abdul-Azeez.pdf
Hybrid optimization of pumped hydro system and solar- Engr. Abdul-Azeez.pdfHybrid optimization of pumped hydro system and solar- Engr. Abdul-Azeez.pdf
Hybrid optimization of pumped hydro system and solar- Engr. Abdul-Azeez.pdf
 
Standard Reomte Control Interface - Neometrix
Standard Reomte Control Interface - NeometrixStandard Reomte Control Interface - Neometrix
Standard Reomte Control Interface - Neometrix
 
Planning Of Procurement o different goods and services
Planning Of Procurement o different goods and servicesPlanning Of Procurement o different goods and services
Planning Of Procurement o different goods and services
 

**Exploring and Assessing Project Complexity-Dao;17.pdf

  • 1. Exploring and Assessing Project Complexity Bac Dao, Ph.D., A.M.ASCE1 ; Sharareh Kermanshachi, Ph.D., A.M.ASCE2 ; Jennifer Shane, Ph.D., M.ASCE3 ; Stuart Anderson, Ph.D., M.ASCE4 ; and Eric Hare5 Abstract: The term project complexity is not well understood in the construction industry by either scholars or practitioners. Project com- plexity, however, is a critical factor in project management that presents additional challenges to achieving project objectives. Therefore, it is essential that everyone involved in project management thoroughly understand what project complexity is and how to identify, measure, and manage the various attributes and indicators it comprises. This study provided a constructive approach to identify and assess project complex- ity. As part of the study, a working definition of project complexity was developed by the research team, and project complexity was described in terms of project management rather than project physical features. In addition, the research team identified complexity attributes and developed the indicators that measure those attributes. Project specific data were collected through a survey of companies active in the construction industry. These data were statistically analyzed to test the significance of complexity indicators in differentiating low-complexity projects from high-complexity projects. The statistical analysis resulted in 34 significant complexity indicators associated with 22 attributes, which the research team considers truly representative of project complexity. The research findings can help scholars and practitioners in the project management field understand critical indicators of project complexity and develop an appropriate strategy to manage project complex- ity effectively. DOI: 10.1061/(ASCE)CO.1943-7862.0001275. © 2016 American Society of Civil Engineers. Author keywords: Organizational issues; Project complexity; Complexity attributes; Complexity indicators. Introduction In the field of project management, both scholars and practitioners have referred to problems caused by project complexity or particu- lar problems arising from complex projects. References to low project complexity or high project complexity are commonplace across many industry sectors. However, references to low or high complexity often seem to be made intuitively and to represent a relative assessment of complexity by comparison to other types of projects or to similar projects within an industry sector. There is no standard definition for complexity that can be applied to all projects. Furthermore, there is no single understanding of com- plexity, what it means, and how to measure it. Project complexity is frequently perceived as a factor related to two project concepts: project difficulty and project risk. Project difficulty focuses on how hard it is to achieve project objectives. Project risk focuses on uncertainties associated with unknowns around the project. However, although these two concepts are related to project com- plexity, they were not the subject of this study. There is a need to study complexity as a separate factor influ- encing projects. This includes a need to define project complexity, study the individual and most important attributes of complexity, and identify the indicators that truly reflect the complexity of a project. Most attributes of complexity are constantly changing var- iables such as project type, project size, project location, project team experience, interfaces within a project, logistics/market con- ditions, geo-political and social issues, and permitting and appro- vals. Having a better understanding of project complexity in any phase of project development as well as a strategy to manage com- plexity will influence how efficiently and economically projects are planned, managed, and executed. The overall goal of the study presented in this paper was to de- velop a methodology to fully explore and assess project complex- ity. This goal was achieved by attaining two specific objectives: (1) define complexity and its attributes and (2) identify and test the significance of complexity indicators that are the measures of project complexity. The resulting assessment of project complex- ity adds significant value to the current body of knowledge for scholars and helps practitioners with project resource allocation to complex projects. The research results, from the perspective of complexity theory and complexity management, make a substan- tial contribution to the theoretical basis in the field of project management. Literature Review To better understand complexity, the researchers reviewed the pub- lications relevant to complexity theory, project complexity defini- tion and identification, impacts of project complexity on project performance, and complexity management practices. Additionally, relevant models and tools already developed were investigated for insights into different approaches to complexity assessment and management. 1 Postdoctoral Research Associate, Durham School of Architectural Engineering and Construction, Univ. of Nebraska-Lincoln, 133 Nebraska Hall, 900 N 16th St., Lincoln, NE 68588 (corresponding author). E-mail: bdao2@unl.edu 2 Assistant Professor, Dept. of Civil Engineering, Univ. of Texas at Arlington, 425 Nedderman Hall, 416 Yates St., Box 19308, Arlington, TX 76019. E-mail: sharareh.kermanshachi@uta.edu 3 Associate Professor, Dept. of Civil, Construction, and Environmental Engineering, Iowa State Univ., 498 Town Engineering, Ames, IA 50011. E-mail: jsshane@iastate.edu 4 Professor, Dept. of Civil Engineering, Zachry Chair in Construction Integration, Texas A&M Univ., 3136 TAMU College Station, TX 77843-3136. E-mail: s-anderson5@tamu.edu 5 Ph.D. Candidate, Dept. of Statistics, Iowa State Univ., 1121 Snedecor Hall, Ames, IA 50011. E-mail: erichare@iastate.edu Note. This manuscript was submitted on March 4, 2016; approved on September 21, 2016; published online on November 16, 2016. Discussion period open until April 16, 2017; separate discussions must be submitted for individual papers. This paper is part of the Journal of Construction Engineering and Management, © ASCE, ISSN 0733-9364. © ASCE 04016126-1 J. Constr. Eng. Manage. J. Constr. Eng. Manage., 2017, 143(5): 04016126 Downloaded from ascelibrary.org by ECOLE DE TECHNOLOGIE SUPERIEURE on 07/15/19. Copyright ASCE. For personal use only; all rights reserved.
  • 2. Complexity Theory and Management Practice Complexity Theory Complexity theory generally defines what a complex system is within a specific area of interest (e.g., natural science, biology, eco-system, computer science, human society, financial market, etc.) and studies the interaction between the elements in that sys- tem. The existing theoretical issue of complexity theory is that there is still no commonly accepted definition of complexity, despite there being a large number proposed (Chu et al. 2003). As defined by Valle (2000) and Lucas (2000), a complex system is a whole that consists of several elements interacting with each other in many different ways. Numerous interdependent elements in a complex system continuously interact and spontaneously organize and reor- ganize themselves into increasingly elaborate structures over time. Unlike conventional systems (e.g., an aircraft or a computer), a complex system includes elements that do not necessarily have fixed relationships, fixed behaviors, or fixed quantities. Lucas (2000) categorized systems into four levels of complexity: (1) static complexity that is related to fixed systems and does not change with time; (2) dynamic complexity that is considered to be cyclically changed spatially and temporally; (3) evolving complexity refers to the systems that are changed in spatial and temporal dimensions, and these systems evolve or alter through time into different com- plex systems; and (4) self-organizing complexity is the combina- tion of the internal constraints of closed systems (like machines) with the creative evolution of open systems (like people). In “The- ories of Complexity” (Chu et al. 2003), Chu has considered two fundamental properties generating complexity for a system: radical openness and contextuality. With endeavors of quantifying or modeling complexity theory, scientists have attempted to apply quantitative techniques to existing systems or organizations. However, most attempts to quantify complexity deal with either the parts (traditional reduc- tion) or look to simplify the system to a single or few parameters. Complexity could be simplified by making its features and proper- ties reducible, and the modelers can ignore some features without substantially compromising the validity of the models. However, readers and/or users have to be aware of inherent limitations of these models and acknowledge that they cannot represent the full complexity of the system. Complexity Theory and Management Practice In the management area, under certain conditions, the systems of interest to complexity theory perform in steady, predictable ways. Under other conditions, they exhibit behavior in which regularity and predictability is lost. Almost undetectable differences in initial conditions lead to gradually diverging system reactions until even- tually the evolution of behavior is quite dissimilar. The systems of interest are dynamic systems with the capability of changing over time. Some systems constantly change but do so in a relatively regular manner, whereas other systems lack this stability. Unstable systems move further and further away from their starting condi- tions until or unless these systems are brought up short by some over-riding constraint (Rosenhead 1998). Stable and unstable behaviors are part of the traditional range of physical science. In the management field, Stacey (1992) indicates that a system behav- ior may also be divided into two zones: (1) a stable zone where, if the system is disturbed, it returns to its initial state; and (2) an un- stable zone, where a small disturbance leads to movement away from the starting point, which in turn generates further divergence. Which behavior type is exhibited, stable or unstable, depends on the organizational conditions. Under some appropriate conditions, systems may operate at the boundary between these zones, sometimes called a phase transition, or the edge of chaos, in which they exhibit a sort of bounded instability, that is, the unpredict- ability of specific behavior within a predictable general structure of behavior. Definition of Project Complexity Through the literature review, more than 30 definitions of complex- ity were assessed. These 30 definitions went through a screening process. This screening process eliminated the definitions that were not related to project management and similar definitions from dif- ferent studies (the most cited definition was selected). In addition, the definitions that consist of uncertainty elements were also elim- inated. The literature often uses uncertainty to describe complexity. The use of uncertainty has purposely been avoided in this research because uncertainty is more often associated with risks rather than complexity. In this section, 10 definitions of complexity in general and project complexity in particular are introduced. These defini- tions originated from a wide variety of disciplines, and some of them are radically different from the others. The result of the screening process for complexity definitions is shown in Table 1. Complexity Attribute The next step in better understanding complexity is to identify the attributes of complexity. Scholars have focused on the identifica- tion of complexity attributes more than any other topic in the field of project complexity. Studies in this area have evolved signifi- cantly over the past 20 years. Nassar and Hegab (2006) developed a complexity measure for project schedules. The measure considers the degree of interrelationships between the activities in the proj- ect’s schedule. The complex schedule of a project may contribute to project complexity. However, the complexity measure of a project schedule is totally different from the complexity measure of a project. Baccarini (1996) identified two major attributes of complexity including organizational complexity and technical complexity. Organizational complexity reflects the view that a project is a task containing many interdependent elements. Because this dimension of complexity is related to the structure of the project, Williams (1999) refers to this factor as structural complex- ity. Technical complexity deals with complexity related to the transformation processes, which convert inputs (such as project resources) into outputs (such as project performance or facility quality). Technical complexity is usually divided into facility op- erational requirements, project characteristics, and the level of knowledge required for the project. Examples of technical com- plexity are the sophistication of control system, number of opera- tors, location of project, type of work force skills needed, and right type of technical expertise. From an analysis of more than 1,300 projects, Puddicombe (2012) proved that technical complexity is an important characteristic of a project that has distinct effects on project performance. Though uncertainty is associated with risk rather than complex- ity, several scholars still viewed uncertainty as an attribute to project complexity. Lebcir (M. Lebcir, “A framework for project complexity in new product development (NPD) projects,” working paper, University of Hertfordshire, Hertfordshire, U.K.) introduced uncertainty as one of the factors influencing the complexity of the project. It has two important dimensions: uncertainty in goals that means the project is poorly defined at the beginning of its execution and uncertainty in methods that reflects the lack of knowledge on how to achieve project goals. Generally, the number of project com- ponents, degree of activeness within each component, degree of interactions between project components (or interfaces within a © ASCE 04016126-2 J. Constr. Eng. Manage. J. Constr. Eng. Manage., 2017, 143(5): 04016126 Downloaded from ascelibrary.org by ECOLE DE TECHNOLOGIE SUPERIEURE on 07/15/19. Copyright ASCE. For personal use only; all rights reserved.
  • 3. project), and interactions of the project with entities outside of the project were frequently considered as the attributes that create complexity of a project. Assessing and Measuring Project Complexity Previous studies explained in this literature review show that for all practical purposes, a project risk framework is not sufficient to identify and measure all the possible positive and negative effects associated with risk, uncertainty, or complexities related to the project. Notably, there is a crucial need for efficient complexity modeling in order to identify and assess project complexity factors. By conducting a literature search and structured interviewing of practitioners, Gidado (1996) has defined project complexity and identified the factors that influence its effect on project success. These factors include the inherent complexity, number of technol- ogies, rigidity of sequence, overlap of phases, and organizational complexity. In addition, the study proposes an approach that mea- sures the complexity of the production process in construction. The Global Alliance for Project Performance Standards (GAPPS 2007) developed a comprehensive project management complexity measurement tool called the Crawford–Ishikura Factor Table for Evaluating Roles (CIFTER). CIFTER provides a seven- factor model from which project management complexity of projects is assessed. A total project complexity score is created by adding the scores from all seven factors outlined in CIFTER. The total CIFTER score is used to categorize each project as either below Global Level 1 (scores less than 12), Global Level 1 (scores 12 to 18), or Global Level 2 (score 19 or more). Table 2 shows influencing factors as well as the method to evaluate them based on the CIFTER tool. Each of the seven factors in the CIFTER tool is rated on a point scale of one to four with the total number of points across the seven factors determining whether a project is Global 1, Global 2, or neither. Literature Findings Several definitions of complexity were found from a wide range of disciplines as specifically discussed in each section of the literature review. For the purposes of this research, the myriad definitions were consolidated to the following central idea for further discussion: Project complexity is the degree of differentiation of project elements, interrelatedness between project elements, and consequential impact on project decisions [CII RT 305-11 (CII 2016a)]. Also, factors of complexity suggested by scholars were discussed. Although a fair number of papers and books were found around different methods of measuring complexity, it seems that very few scholars have studied project complexity as a separate factor influencing project characteristics in the project management field. A detailed description of project complexity and complexity attributes will help scholars understand project complexity and study it properly. Table 1. Project Complexity Definitions Number Authors (year) Definition 1 Dictionaries (1) Consisting of many varied interrelated parts; (2) complicated, involved, intricate. 2 Perrow (1965) The complexity of a task is the degree of difficulty and the amount of thinking time and knowledge required to perform the task. 3 Gidado (1996) Project complexity is the measure of the difficulty of implementing a planned workflow in relation to the project objectives. 4 Baccarini (1996) Project complexity consists of many varied interrelated parts and can be operationalized in terms of differentiation and interdependency. 5 Edmonds (1999) Complexity is that property of a model, which makes it difficult to formulate its overall behavior. 6 Sbragia (2000) The number of elements in the project, intensity of interactions between elements, and difficulty of cooperation between the functional areas. 7 Brockmann and Girmscheid (2007) The complexity is the degree of manifoldness, interrelatedness, and consequential impact of a decision field. 8 Hass (2008) Complexity is characterized by a complicated or involved arrangement of many inter-connected elements that it is hard to understand or deal with. 9 Vidal and Marle (2008) Project complexity is the property of a project, which makes it difficult to understand, foresee, and keep under control its overall behavior. 10 Remington et al. (2009) A complex project demonstrates a number of characteristics to a degree, or level of severity, that makes it difficult to predict project outcomes or manage project. Table 2. Crawford–Ishikura Factor Table for Evaluating Roles Number Project management complexity factor Description and scores 1 Stability of the overall project context Very high (1) High (2) Moderate (3) Low (4) 2 Number of distinct disciplines, methods, or approaches involved in performing the project Low (1) Moderate (2) High (3) Very high (4) 3 Magnitude of legal, social, or environmental implications from performing the project Low (1) Moderate (2) High (3) Very high (4) 4 Overall expected financial impact (positive or negative) on the project’s stakeholders Low (1) Moderate (2) High (3) Very high (4) 5 Strategic importance of the project to the organization or the organizations involved Very low (1) Low (2) Moderate (3) High (4) 6 Stakeholder cohesion regarding the characteristics of the product of the project High (1) Moderate (2) Low (3) Very low (4) 7 Number and variety of interfaces between the project and other organizational entities Very low (1) Low (2) Moderate (3) High (4) © ASCE 04016126-3 J. Constr. Eng. Manage. J. Constr. Eng. Manage., 2017, 143(5): 04016126 Downloaded from ascelibrary.org by ECOLE DE TECHNOLOGIE SUPERIEURE on 07/15/19. Copyright ASCE. For personal use only; all rights reserved.
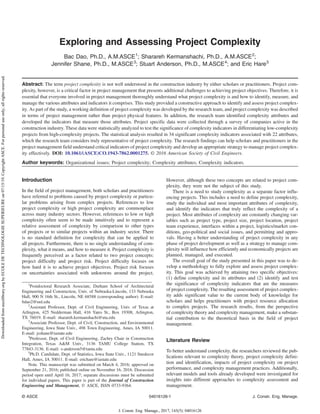
  • 4. Research Methodology Research Approach For this research, the academic researchers were working closely with 18 construction industry practitioners to form a research team. This industry group composed of practicing professional representatives from owners, contractors, and engineering firms. The industry practitioners all had at least 10 years of experience in the construction industry. These practitioners were responsible for providing research inputs and practical perspectives through multiple rounds of reviewing and many intensive discussions with the academic research team members. The research process, the survey questionnaire, the collected data, and the research results were reviewed and discussed by these industry practitioners in the validation process. To fully explore and assess project complexity, a research frame- work was developed by the research team to support the interaction of the primary research objectives. The measurement approach of this research was developed based on literature findings, the results of prior research, an industry pilot and review process, and the preliminary results of statistical analysis. For the complexity meas- urement approach, the term complexity indicator was selected to identify complexity measures based on its common use in the con- struction industry and academia. The research team members who were working in the construction industry agreed that using the term complexity indicator provides a common sense descriptor for not only construction scholars but also for practitioners when referring to the measurement of project complexity. The study started with a literature review to identify potential complexity indicators. The identified indicators were brought to many discus- sions with the industry research team members. The complexity indicators were modified and improved upon based on a practical perspective to ensure that the survey respondents understand the developed measures and to guarantee that the developed measures represent an appropriate construct. The research process was conducted through five tasks. Task 1 started with the in-depth exploration of the concept of complexity and its attributes. Contemporary literature on the subject of com- plexity was reviewed, and background experience was gathered. Research questions and research objectives were identified to direct the research around the focused point. Task 2 reviewed the devel- oped definitions of project complexity and described project complexity by developing a working definition and identifying potential complexity attributes as a basis for this research. Task 3 proposed an approach to develop the complexity indicators deemed to measure the associated complexity attributes and the relevant hypothesis. The data related to testing the hypothesis were col- lected through a survey in Task 4. In Task 5, the data were reviewed and descriptively analyzed to interpret their characterizations, and then statistical methods were applied to analyze the collected data and test the relevant hypothesis to determine which indicators are truly representative of project complexity. Fig. 1 provides a visual description of the research approach. Project Complexity Definition Development Throughout the literature review, several definitions of complexity were found from a wide range of disciplines. One of the difficulties in addressing the topic of project complexity is that the term is applied broadly and intuitively. Without a standard definition, complexity tends to be a catch-all category that is often used when project results are unpredictable, when a project has many interacting parts, when details of a project are poorly understood, or for a myriad of other project conditions outside of what is typically perceived as “normal.” Project professionals and teams have an intuitive sense of when a project is complex, but the rea- sons for that complexity may be widely varied and depend on that person’s or project team’s experiences, resource availability, stake- holder considerations, and many other factors, both objective and subjective. Additionally, the perception of complexity can be com- pounded by multiple project factors, which if not managed effec- tively may have a negative impact on the project outcome. To address these issues, project complexity is described not in terms of a project’s physical features (e.g., types of materials, quantities of materials, number of systems, and facility technology) but rather complexity related to managing projects (e.g., internal project team interfaces, site logistics, permitting, etc.). This was necessary to ensure that the research results could be generalized across con- struction industry sectors and within a construction industry sector with different types of projects. After substantial consideration of project complexity defini- tions, the initially consolidated definition of project complexity from the literature review, as presented earlier, was modified to cre- ate a final definition as the basis of this research as follows: “Project complexity is the degree of interrelatedness between project attrib- utes and interfaces, and their consequential impact on predictability and functionality” [CII RT 305-1 (CII 2016b)]. This definition at- tempts to capture the essence of how project attributes, such as project scope, team organizational dynamics, project location, policies and regulations, unfamiliar technologies, and workforce skill sets, interact both within a project and with entities outside of the project. Without targeted strategies to manage complexity, the project’s outcome may be negatively impacted. With proper management strategies in place to control a diverse set of project attributes and associated interfaces that lead to increased project complexity, the probability that projects can be both successful and predictable is increased. Complexity Attribute and Indicator Development With the developed definition of project complexity, a methodol- ogy was developed to identify the level of project complexity. The Fig. 1. Research approach © ASCE 04016126-4 J. Constr. Eng. Manage. J. Constr. Eng. Manage., 2017, 143(5): 04016126 Downloaded from ascelibrary.org by ECOLE DE TECHNOLOGIE SUPERIEURE on 07/15/19. Copyright ASCE. For personal use only; all rights reserved.
  • 5. term “complexity attribute” was used to represent factors that de- scribe project complexity. Fifty major complexity attributes were identified using complexity theory variables, the literature review results, and industry experience. A description for each attribute was then created that included (1) attribute definition, (2) examples, (3) measures, (4) impacts, and (5) mitigation strategies. Creating these descriptions for each complexity attribute aided in eliminat- ing or combining attributes and enabled the attributes to be ranked in an attempt to reduce the number of attributes to a more mean- ingful and manageable number because of the similarity or duplic- ability. The ranking process ultimately resulted in a reduced list of 35 complexity attributes. The complexity attributes were then grouped into categories to aid in understanding the general nature of the attributes. Eleven categories were proposed including the following: (1) stakeholder management; (2) project governance; (3) legal; (4) fiscal planning; (5) interfaces; (6) scope definition; (7) location; (8) design and technology; (9) project resources; (10) quality; (11) and execution targets. A category can have a number of different complexity attributes. Table 3 presents the list of 35 complexity attributes associated with 11 categories. The identified complexity attributes presented in Table 3 were used to develop the complexity indicators thought to measure the associated attributes. Each attribute-measuring indicator was then converted to one question for data collection. For complexity measuring purposes, each attribute has one or more indicators deemed relevant to measuring it. Ninety-two complexity indicators were finally identified to measure the 35 associated complexity attributes. Fig. 2 presents the complexity measurement hierarchy for a single category. This hierarchical framework is discussed in more detail in the data collection process section that follows. Research Hypothesis To verify the complexity attributes that truly describe project com- plexity, the significance in differentiating low-complexity projects from high-complexity projects based on the indicators used to mea- sure those attributes was tested. If a complexity indicator was not Table 3. Thirty-Five Identified Complexity Attributes Category Number Attribute Stakeholder management 1 Clarity of business objectives 2 Level of stakeholder cohesion 3 Public profile 4 Social and political influences surrounding project location Governance 5 Joint ventures 6 Level of authorizing approvals and duration of receiving proposals 7 Level of control 8 Owner, partnerships Legal 9 Legal 10 Permitting and regulatory requirements Fiscal planning 11 Commercial burdens 12 Fiscal planning or financing (funding stream, uncertain political environment) Interfaces 13 Interfaces within the project 14 Number of participants 15 Number of suppliers, subcontractors, contractors Scope definition 16 Change management (dynamics of market and environment) 17 Clarity of scope definition Location 18 Climate 19 Local content requirements 20 Logistics 21 Number of locations 22 Physical location Design and technology 23 Design [number of process steps, health and safety executive (HSE) hazards, number of recycles, exotic materials] 24 Technology Project resources 25 Direct field labor management 26 Productivity 27 Resource availability 28 Team experience 29 Turnover Quality management 30 Quality of suppliers, subcontractors, contractors 31 Unfamiliar procurement Execution targets 32 Cost targets 33 Schedule targets [schedule targets was defined as the level of schedule aggressiveness (duration or overlap of engineering and construction) in relation to industry benchmarks] 34 Schedule (schedule was defined as the number of steps/activities/critical paths/successors/etc. identified to meet the time objectives) 35 Strategic importance of the project Fig. 2. Complexity measurement hierarchy © ASCE 04016126-5 J. Constr. Eng. Manage. J. Constr. Eng. Manage., 2017, 143(5): 04016126 Downloaded from ascelibrary.org by ECOLE DE TECHNOLOGIE SUPERIEURE on 07/15/19. Copyright ASCE. For personal use only; all rights reserved.
  • 6. statistically significant for describing and measuring project com- plexity, it was excluded from the list. The significance level (α) for testing the hypothesis is discussed in the research results section. The primary research hypothesis was proposed to test the signifi- cance of complexity indicators. The research team produced this proposed hypothesis: Null Hypothesis (H0)—The identified project complexity indicators are not significant in differentiating low-complexity projects from high-complexity projects. Alternative Hypothesis (H1)—The identified project complex- ity indicators are significant in differentiating low-complexity projects from high-complexity projects. The assessment of the hypothesis drove the data collection and analysis techniques. This hypothesis was quantitatively tested for each indicator that was developed to measure the associated com- plexity attribute. Ninety-two complexity indicators were developed to measure 35 complexity attributes presented in Table 3; therefore, 92 corresponding individual hypotheses were tested. Each hypoth- esis was tested using statistical methods based on factual historical project data collected through the survey. The hypothesis testing process resulted in a list of significant complexity indicators that function as the measures of project complexity. Data Collection After developing the project complexity definition, identifying the complexity attributes, and developing the complexity indicators used to measure each associated attribute, the research team imple- mented the data collection process to collect the data that were usable to test the proposed hypothesis and to determine which indicators functioned as measures of project complexity. When considering different data collection approaches, the intent of the data collection, the type of data collected, possible analysis processes, sample sizes, interpretation, and advantages/disadvan- tages of the approach to derive a set of survey questions were taken into account. The questions used to collect the data were based on the developed complexity indicators central to the measurement of complexity attributes. The data were collected through a survey to test the relevant hypothesis. Data analysis helped in confirming the definition of complexity including theoretical concepts and complexity’s attrib- utes, determining different levels of complexity, and providing the basis for assessing the impact of project complexity on the use of best practices. To support the survey, different ways of categorizing the level of complexity based on the proposed complexity defini- tion were described. The survey then captured industry project- focused data on the proposed definition of complexity, levels of project complexity, and measures of complexity indicators. The survey was sent to Construction Industry Institute (CII) member companies, and then follow-up occurred with the survey contact person (either through e-mails or phone calls) to increase the re- sponse rate. The survey questionnaire was developed based upon the com- plexity measurement hierarchy (Fig. 2). With agreement from the industry practitioners on using the term complexity indicator to in- dicate complexity measures, the academic research team members developed a set of complexity indicators based on literature find- ings and the inputs from industry practitioners. The measurements for the indicators were revised through several iterations of survey development. In the end, the research team decided to use a seven- point Likert scale for many of the indicators. The seven-point Likert scale was decided upon for several reasons, including that this is the scale used for the CII Benchmarking and Metrics (CII 2012), which has been tested and used for many years by CII, and that it improved respondents’ ease of use because the survey was quite long. Additionally, the survey was administered to CII members, who understand this scale of measurement. The descriptors on the seven points were modified for each question to be relevant. Ques- tions that could not be measured using the seven-point Likert scale were questions the respondent needed to access specific project data to answer (continuous scale), such as project cost or full-time equivalent project team members. This effort was co- ordinated with the expectation of developing statistically via- ble data. For data collection purposes, each attribute had one or more indicators deemed relevant to measuring it. Each complexity indi- cator was converted to one question, and the survey was developed to collect data on each question in the complexity matrix. The ques- tionnaire was then refined by the industry practitioners and the CII research committee. Many changes were recommended, and it was decided to use a seven-point scale as a basis for assessing certain complexity indicators. The research team revised the survey based on these inputs and piloted the survey to ensure it was viable. After the survey, the collected data were analyzed. The set of questions significant in differentiating high-complexity projects from low- complexity projects determined the corresponding indicators that are significant in measuring project complexity. The survey, containing 106 survey questions and requiring 152 responses, was structured into three sections including the follow- ing: (1) General Project Description, (2) Project Complexity Metrics, and (3) Best Practice Implementation. Responses were a number, yes/no, or an ordinal scale (e.g., one to seven with one being low and seven being high complexity for a measure). Section 1, General Project Description, consisted of 16 questions that provided general information and project characteristics of the surveyed projects such as project type, project cost/schedule, and design/procurement/construction contract type. Section 2, Project Complexity Metrics, consisted of 73 questions with 92 responses. These 92 responses were used to collect data for 92 developed complexity indicators that measure the 35 associated complexity attributes. Section 3, Best Practice Implementation, had 13 ques- tions asking the level of best practice implementation for each project. At the beginning of the survey, each respondent was asked to complete the survey for one high-complexity project and one low-complexity project based on the survey instructions and their understanding of complexity. The intent of the survey was to assess the different complexity indicators based on responses between low-complexity projects and high-complexity projects. Differences had to be statistically significant to argue that the indicator was a true reflection of project complexity. The survey process was conducted online. After the question- naire framework was developed for the survey, a pilot test was conducted both using hard copies of the survey and the CII online survey software to refine the survey questionnaire, test the appro- priateness of each question, and ensure that the survey is viable. The survey was pilot tested by several industry research team members on 10 projects. The responses for the pilot survey were gathered and analyzed to eliminate any questions or information that was not appropriate to the survey. These pilot surveys helped identify several issues with the survey and helped identify poten- tial statistical analyses that would be conducted on the data collected from full deployment of the survey. After the question- naire was validated, the survey transmittal memorandum, survey instructions, and final questionnaire were uploaded to the CII online survey system and sent to CII company members. The questionnaire was sent to 140 CII company members to collect data. © ASCE 04016126-6 J. Constr. Eng. Manage. J. Constr. Eng. Manage., 2017, 143(5): 04016126 Downloaded from ascelibrary.org by ECOLE DE TECHNOLOGIE SUPERIEURE on 07/15/19. Copyright ASCE. For personal use only; all rights reserved.
  • 7. Data Analysis and Research Result The focus of the statistical analysis was to test the research hypoth- esis and determine the complexity indicators that are significant in differentiating low-complexity projects from high-complexity proj- ects. Several different statistical tests were used based on the type of question response. One of the primary objectives of this research was to determine how to measure complexity while focusing on a large array of measures. Survey respondents were asked two sep- arate times to evaluate the complexity of their project, once at the beginning of the survey and once toward the end. The statistical analysis consistent with the data characteristics was conducted. For example because project complexity was measured by different indicators that describe the associated attributes, the statistical analysis was implemented to determine which indicators should be considered as significant and best reflect project complexity. In other words, testing which indicators were statistically signifi- cant in differentiating between low-complexity projects and high- complexity projects helped the researchers understand which indicators have an important contribution to describing a project’s complexity. After that, the analysis process focused on these sig- nificant indicators. The primary question of interest is, “Is there a clear difference between low complexity projects and high complexity projects with regards to a specific indicator?” Both ex- ploratory and inferential statistics were used to determine if this difference existed. Exploratory Statistics Exploratory statistics in this research were graphical displays in- cluding boxplots and bar-chart graphics to visualize the data. Side-by-side boxplots were used whenever the data were counts, dollars, or other numerical values. The boxplots illustrated the dis- tribution of the data, indicating outliers, minimum and maximum values, first quartile and third quartile, and median. Bar charts were used to describe both Likert (seven-point scale) and binary (yes/no) type data. The x-axis of the bar chart consists of the Likert scale responses, and the y-axis consists of the observed frequencies of each of the different possible responses. The side-by-side box- plots and bar charts allow for visual comparison of the data between low-complexity projects and high-complexity projects. Inferential Statistics Depending on the type of data produced from the survey, the meth- ods of analysis varied. This was because there are different assump- tions and limitations to the statistical analysis tests. Table 4 summarizes the basic formal statistical methods that were used for data analysis in this research. P-values that indicated the statistical significance of differences between the two groups (low-complexity projects versus high-complexity projects) were generated through the relevant tests. To run the analysis, the Survey Visualization Tool program was used for the statistical approaches (both formal and descriptive) as described in Table 4. The survey data were initially cleaned, coded, and then input into the program. The data analysis results were gen- erated regarding the different methods of testing, and the statistical finding (P-value of each complexity indicator) was presented in Table 5. Research Results General Survey Data Characterizations and Descriptive Analysis Forty-four survey responses were provided from the online survey. The survey response rate was 31.4%. Of these responses, 30 re- sponses were for high-complexity projects, and 14 responses were for low-complexity projects, as subjectively rated by the respondent at the start of the survey (high complexity and low complexity were the only possible answers). Before selecting a project for the sur- vey, the respondents were provided the relevant information in a Memorandum, the Survey Request, and the Survey Instruction. Table 4. Statistical Analysis Methods Statistical test Null/alternative hypothesis Assumptions Two-sample t-test (adjusted R2): This test was used where the response is a count or numerical value. Null hypothesis: The means for high- complexity projects and low-complexity projects are the same. The two groups (high-complexity projects and low-complexity projects) follow a normal distribution. Alternative hypothesis: The means for high- complexity projects and low-complexity projects are different. Each project was independent from other projects. Kruskal–Wallis/Wilcoxon test: This test was used for Likert data (ordinal seven- point scale), where it could not necessarily be assumed that the data follows a normal distribution. Null hypothesis: The probability that the median of high-complexity projects is greater than the median of low-complexity projects on this question is 0.5 (the distributions are the same). The two groups follow an identically scaled distribution. Alternative hypothesis: The probability that the median of high-complexity projects is greater than the median of low-complexity projects on this question is not equal to 0.5 (the distributions are not the same). Each project was independent of other projects. Chi-squared test (Nagelkerke’s R2 ): This test was used for survey questions with binary responses (“Yes” or “No” response), testing whether the observed frequencies of “Yes” or “No” are equal for both high-complexity projects and low- complexity projects. Null hypothesis: The observed frequencies of “Yes” and “No” for high-complexity projects are not different from those for low- complexity projects. Each project was independent of other projects. Alternative hypothesis: The observed frequencies of “Yes” and “No” for high- complexity projects are different from those for low-complexity projects. © ASCE 04016126-7 J. Constr. Eng. Manage. J. Constr. Eng. Manage., 2017, 143(5): 04016126 Downloaded from ascelibrary.org by ECOLE DE TECHNOLOGIE SUPERIEURE on 07/15/19. Copyright ASCE. For personal use only; all rights reserved.
  • 8. Table 5. Significant Complexity Indicators and Corresponding P-Values Category/attribute Complexity indicator (CI) P-value Stakeholder management Strategic importance of the project CI-1_Influence of this project on the organization’s overall success (e.g., profitability, growth, future industry position, public visibility, and internal strategic alignment). 0.0821 Project impact of local social and political groups (stakeholders) CI-2_Impact of required approvals from external stakeholders on the original project execution plan. 0.0341 CI-3_Impact of required inspection by external (regulatory) agencies/entities on original project execution plan. 0.0012 Governance Joint ventures CI-4_Total number of joint-venture partners in this project. 0.0631 Owner, partnerships Level of authorizing approvals and duration of receiving proposals. CI-5_Number of executive oversight entities above the project management team who will have decision-making authority over the project execution plan. 0.047 Level of control CI-6_Number of times on this project that a change order will go above the Project Manager for approval. 0.0542 Fiscal planning Fiscal planning, or financing (funding stream, uncertain political environment) CI-7_Number of funding phases (gates) from concept to project completion. 0.0756 CI-8_Specific delays or difficulties in securing project funding. 0.025 Quality Quality of suppliers, subcontractors, etc. CI-9_Quality of bulk materials during project execution. 0.0181 Legal Permitting and regulatory requirements CI-10_Number of total permits to be required. 0.0761 CI-11_Level of difficulty in obtaining permits. 0.0497 Legal CI-12_Difficulty in obtaining design approvals. 0.0718 CI-13_Impact of external agencies on the project execution plan. 0.039 Interfaces Interfaces within the project CI-14_Peak number of participants [full-time equivalents (FTE)] on the project management team during the detailed engineering/design phase of the project. 0.0207 Number of participants CI-15_Peak number of participants [full-time equivalents (FTE)] on the project management team during the procurement phase of the project. 0.0313 Execution target Cost targets CI-16_Compare target project funding against industry/internal benchmarks. 0.0118 Schedule targets CI-17_Compare target project schedule against industry/internal benchmarks. 0.0366 Design and technology Design (number of process steps, HSE hazards, number of recycles, exotic materials) CI-18_Difficulty in system design and integration on this project compared to a typical project for your company. 0.0048 Technology CI-19_Company’s degree of familiarity with technologies that will be involved in detailed engineering/design project phase. 0.0138 CI-20_Company’s degree of familiarity with technologies that will be involved in construction project phase. 0.0065 CI-21_Company’s degree of familiarity with technologies that will be involved in operating facility project phase. 0.0106 Location Number of locations CI-22_Number of execution locations which will be used on this project during detailed engineering/design phase. 0.0324 Logistics CI-23_Number of execution locations which will be used on the project during fabrication (bulk materials and equipment) phase. 0.0114 CI-24_Impact of project location on the project execution plan. 0.017 Scope definition Change management (dynamics of market and environment) CI-25_Identify the percentage of engineering/design completed at the start of construction. 0.0524 CI-26_Clarity of the change management process to key project team members. 0.0757 CI-27_Impact of the magnitude of change orders on project execution. 0.003 CI-28_Impact of the timing of change orders on project execution. 0.0129 CI-29_ RFIs drive project design changes. 0.0268 Project resources Direct field labor management CI-30_Percentage of project/construction management staff who will work on the project compared to planned project/construction management staff. 0.0994 CI-31_Quality issues of skilled field craft labor during project construction. 0.0381 Resource availability CI-32_Frequency of workarounds (work activities out of sequence to continue) because materials are not available when needed to support construction. 0.0293 Turnover CI-33_Percentage of craft labor turnover. 0.0459 CI-34_Percentage of craft labor sourced locally (within 100-mile radius of job site). 0.0866 © ASCE 04016126-8 J. Constr. Eng. Manage. J. Constr. Eng. Manage., 2017, 143(5): 04016126 Downloaded from ascelibrary.org by ECOLE DE TECHNOLOGIE SUPERIEURE on 07/15/19. Copyright ASCE. For personal use only; all rights reserved.
  • 9. This information included the project complexity definition that had been developed as a research basis at the initial stage of the research. The descriptive instructions to preliminarily assess complexity levels of a project had also been provided based on the preliminarily identified complexity measures such as project size, project schedule, number of process steps, or technology familiarity. Additionally, the respondents were also asked to select the projects based on their perspective of complexity. The respond- ents were asked again about the level of complexity for the surveyed project in the final question of the “Project Complexity Metrics” section of the survey. This question asked the respondents to evaluate the project’s complexity on an ordinal seven-point scale with one being low complexity and seven being high complexity. The implication of this Likert rating was to verify the initial selec- tion of complexity level for the surveyed project. The rationale for asking this question is that, after answering all the survey questions plus their perspective of complexity, the respondents have more information and understanding of project complexity, and then re- assess the complexity level of the selected project on this Likert scale. The average scores of the Likert scale question for 14 low-complexity projects and 30 high-complexity projects were 2.34 and 5.25 respectively. This confirmed that the perception of low versus high complexity initially classified by the survey re- spondents was consistent with the survey data. The survey data set was descriptively analyzed to ensure data characteristics were understood. This effort was also used to follow up on the survey responses and to correct any inappropriate or erro- neous data. Among the 44 projects, there were 30 heavy industrial projects, 3 light industrial projects, 3 building projects, 3 infrastruc- ture projects, and 5 projects of other types. The responses ranged from project costs of $0.4 million to $5,600 million (average $140 million for low-complexity projects and $417 million for high-complexity projects). The total schedule durations for the sur- vey projects were from 8 months to 70 months (average 25 months for low-complexity projects and 30 months for high-complexity projects). Testing for Differences between High-Complexity Projects and Low-Complexity Projects The primary goal of this research was to develop a methodology to fully explore and assess project complexity by identifying the com- plexity indicators used to describe and measure project complexity. In other words, the complexity indicators that were significant in differentiating low-complexity projects from high-complexity proj- ects were identified and tested. The significance level of 0.05 (α ¼ 0.05) was initially chosen to test the significance of each com- plexity indicator in differentiating low-complexity projects from high-complexity projects. Twenty-four out of 92 complexity indicators were found significant with the significance level of 0.05 as a result of the analysis. This result was then reviewed by the research team. Upon reviewing the initial analysis result, the industry members of the research team determined that all aspects of project complexity were not sufficiently described by these 24 complexity indicators. Based on industry experience and discussion, several other complexity indicators that had P-values close to 0.05 were important in measuring project com- plexity and should be included in the list. The significance level was ultimately increased from 0.05 to 0.1. The research team deemed this an acceptable significance level based on the industry and research standards and intended use for the results. With the significance level of 0.1, there were 36 complexity indicators (CIs) associated with 22 complexity attributes that were statistically significant in differentiating low-complexity projects from high-complexity projects (the indicators that have P-value not greater than 0.1). This result was reviewed again. Among those 36 statistically significant indicators, two indicators had high cor- relations with two other indicators. The first indicator was “Average number of participants during the detailed engineering/design phase” that had very high correlation with the indicator “Peak number of participants [full-time equivalents (FTE)] on the project management team during the detailed engineering/design phase of the project.” The correlation coefficient between these two indica- tors was 0.99 (R ¼ 0.99). The second indicator was, “Average number of participants during the procurement phase,” which had very high correlation with the indicator, “Peak number of par- ticipants [full-time equivalents (FTE)] on the project management team during the procurement phase of the project.” The correlation coefficient between these two indicators was 0.98 (R ¼ 0.98). Stat- istically, two or more highly correlated indicators may measure the same characteristic of project complexity. As a result, those two indicators as described previously were excluded from the signifi- cant indicator list. Ultimately, a list of 34 complexity indicators that measure 22 complexity attributes was finalized as presented in Table 5. These indicators were considered critical descriptors of project complexity and used as a basis for further research. The further relevant research includes developing a project complexity assessment and management tool, developing project complexity management strategies, and developing a project complexity pre- dictive model (not covered in scope of this paper). The complexity indicators and complexity attributes listed in Table 5 are statistically significant in differentiating low-complexity projects from high-complexity projects. These indicators can be used to describe and measure the complexity of a project. This finding assists scholars and practitioners in identifying potential problem areas that may arise in the project development and deliv- ery process. A proactive project management approach can then develop appropriate management strategies to deal with project complexity. Implementing proper management strategies relevant to the identified complexity indicators will help organizations in reducing the likelihood that the associated attributes will cause poor project performance. Conclusion This research provided a constructive way to assess and measure aspects of project complexity. The research contributes to enriching the theoretical basis in the field of project management by identifying the root contributors to project complexity defined as complexity indicators. The degree of project complexity was deter- mined by identifying and measuring the complexity attributes. This knowledge can help project participants develop their competencies in managing complex projects in different industry sectors. More- over, this knowledge can provide project management scholars a basis to study the positive impacts and reduce the negative impacts of project complexity in managing projects in an effective manner. Practically, the research implications of identifying 22 complexity attributes and 34 associated complexity indicators were that, when knowing the true contributors to project complexity, project man- agement practitioners would be able to focus on those complexity indicators, prioritize their activities to the identified complexity attributes, and allocate the limited project resources to address those attributes. Understanding the complexity indicators also helps project practitioners develop an appropriate management strategy to minimize the impact of the identified complexity indicators. One limitation of this study is that the research team chose not to describe complexity primarily in terms of a project’s physical fea- tures but rather to address complexity as it is related to managing © ASCE 04016126-9 J. Constr. Eng. Manage. J. Constr. Eng. Manage., 2017, 143(5): 04016126 Downloaded from ascelibrary.org by ECOLE DE TECHNOLOGIE SUPERIEURE on 07/15/19. Copyright ASCE. For personal use only; all rights reserved.
  • 10. projects. With this focus, the study did not consider complexity measures that are specifically related to the physical features of a project. This limitation could be addressed through future re- search that studies project complexity focusing on projects in a spe- cific industry sector with their unique physical features. Projects in different sectors have different physical features that more or less contribute to project complexity. Therefore, focusing more on physical features of a project can help in exploring other specific complexity attributes in the corresponding sector. This result could further enhance the theoretical basis and understanding of project complexity and its impact on project development and delivery. In this research, a set of complexity management strategies was developed. Each indicator has a number of management strategies that can be applied to minimize the complexity impact. One limi- tation to this paper is that this separate, second contribution of the research project, the process of developing complexity manage- ment strategy, will be published in another paper. Acknowledgments The study described in this paper was supported by the Construc- tion Industry Institute (CII RT 305 Research Project). This paper forms a part of the research project titled “Measuring Project Complexity and Its Impact,” from which other deliverables have been produced with common background and methodology. The authors also acknowledge the contributions of other CII RT 305 Research Team members for providing significant inputs to complete this study. References Baccarini, D. (1996). “The concept of project complexity—A review.” Int. J. Project Manage., 14(4), 201–204. Brockmann, D. I. C., and Girmscheid, I. G. (2007). “Complexity of megaprojects.” CIB World Building Congress 2007, International Council for Building (CIB), Rotterdam, Netherlands, 219–230. Chu, D., Strand, R., and Fjelland, R. F. (2003). “Theories of complexity: Common denominators in complex systems.” Complexity, 8(3), 19–30. CII (Construction Industry Institute). (2012). “Benchmarking and metrics: Project level survey, version 11.” Univ. of Texas at Austin, Austin, TX. CII (Construction Industry Institute). (2016a). “Measuring project complexity and its impact: Research Rep. No. 305-11.” CII RT 305–11, Univ. of Texas at Austin, Austin, TX. CII (Construction Industry Institute). (2016b). “Measuring project complexity and its impact: Research Summary 305-1.” CII RT 305–1, Univ. of Texas at Austin, Austin, TX. Edmonds, B. (1999). “Syntactic measures of complexity.” Ph.D. thesis, Univ. of Manchester, Manchester, U.K. GAPPS (Global Alliance for Project Performance Standards). (2007). “A framework for performance based competency standards for global level 1 and 2 project managers.” Sydney, NSW, Australia. Gidado, K. (1996). “Project complexity: The focal point of construction production planning.” Constr. Manage. Econ., 14(3), 213–225. Hass, K. B. (2008). “Introducing the new project complexity model.” Manag. Concepts, 22–31. Lucas, C. (2000). “Quantifying complexity theory.” 〈http://www.calresco.org /lucas/quantify.htm〉. Nassar, K., and Hegab, M. (2006). “Developing a complexity measure for project schedules.” J. Constr. Eng. Manage., 10.1061/(ASCE)0733- 9364(2006)132:6(554), 554–561. Perrow, C. (1965). “Hospitals: Technology, structure, and goals.” Hand- book of organizations, Rand McNally, Chicago, 910–971. Puddicombe, M. (2012). “Novelty and technical complexity: Critical con- structs in capital projects.” J. Constr. Eng. Manage., 10.1061/(ASCE) CO.1943-7862.0000459, 613–620. Remington, K., Zolin, R., and Turner, R. (2009). “A model of project com- plexity: Distinguishing dimensions of complexity from severity.” Proc., 9th Int. Research Network of Project Management Conf., International Research Network on Organizing by Projects (IRNOP), Technische Universität Berlin, Berlin. Rosenhead, J. (1998). “Complexity theory and management practice.” LSEOR 98.25, Dept. of Operational Research, London School of Economics and Political Science, London. Sbragia, R. (2000). “The interface between project managers and functional managers in matrix organized product development projects.” 9th Int. Conf. on Management of Technology, International Association for Management of Technology, Univ. of Miami, Miami. Stacey, R. D. (1992). Managing the unknowable: Strategic boundaries be- tween order and chaos in organizations, Jossey-Bass, San Francisco. Valle, V., Jr. (2000). Chaos, complexity and deterrence, National War College, Washington, DC. Vidal, L. A., and Marle, F. (2008). “Understanding project complexity: Im- plications on project management.” Kybernetes, 37(8), 1094–1110. Williams, T. M. (1999). “The need for new paradigms for complex projects.” Int. J. Project Manage., 17(5), 269–273. © ASCE 04016126-10 J. Constr. Eng. Manage. J. Constr. Eng. Manage., 2017, 143(5): 04016126 Downloaded from ascelibrary.org by ECOLE DE TECHNOLOGIE SUPERIEURE on 07/15/19. Copyright ASCE. For personal use only; all rights reserved.