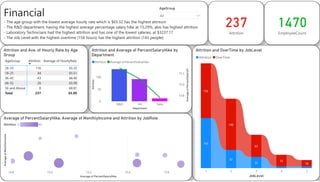
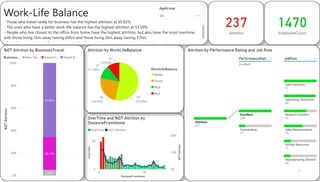
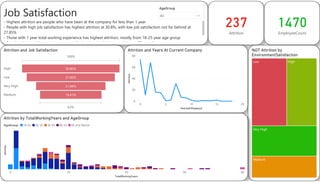
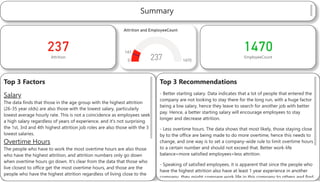
10 Email Marketing Best Practices to Increase Engagements, CTR, And ROI
Data Queries And Visualisation Basics Project Presentation
1. Demographics
- Males form the highest attrition at 63.29%
- Singles are the highest attrition at 50.63%
- Highest attrition is from Bachelor-holders, with males being the majority (61 compared to 38 for females)
- Age group of 26-35 makes up the bulk of attrition
237
Attrition
1470
EmployeeCount
Attrition by MaritalStatus
120 (50.63%)
84 (35.44%)
33 (13.92%)
MaritalStatus
Single
Married
Divorced
AgeGroup
All
Attrition by Gender
150 (63.29%)
87 (36.71%)
Gender
Male
Female
AgeGroup Female
Male
Total
26-35
18-25
36-45
46-55
56 and Above
46
18
13
7
3
70
26
30
19
5
116
44
43
26
8
Total 87 150 237
Attrition by Education and Gender
Attrition
Education
Bachelor
Master
College
Below College
Doctor
38
16
19
11
3
61
42
25
20
2
Gender Female Male
2. Financial
- The age group with the lowest average hourly rate which is $65.32 has the highest attrition
- The R&D department, having the highest average percentage salary hike at 15.29%, also has highest attrition
- Laboratory Technicians had the highest attrition and has one of the lowest salaries, at $3237.17
- The Job Level with the highest overtime (156 hours) has the highest attrition (143 people)
237
Attrition
1470
EmployeeCount
Attrition and Average of PercentSalaryHike by
Department
0
50
100
14.8
15.0
15.2
Department
Attrition
Average
of
PercentSalaryH…
R&D HR Sales
Attrition Average of PercentSalaryHike
AgeGroup
All
Attrition and Ave. of Hourly Rate by Age
Group
AgeGroup Attrition
Average of HourlyRate
26-35
18-25
36-45
46-55
56 and Above
116
44
43
26
8
65.32
65.51
66.40
65.99
68.81
Total 237 65.89
Attrition and OverTime by JobLevel
JobLevel
1 2 3 4 5
143
32
52
156
18
63
146
33
Attrition OverTime
Average of PercentSalaryHike, Average of MonthlyIncome and Attrition by JobRole
Average of PercentSalaryHike
Average
of
MonthlyIncome
14.8 15.0 15.2 15.4 15.6
Attrition 2 62
3. Work-Life Balance
- Those who travel rarely for business has the highest attrition at 65.82%
- The ones who have a better work-life balance has the highest attrition at 53.59%
- People who live closest to the office from home have the highest attrition, but also have the most overtime,
with those living 1km away having 49hrs and those living 2km away having 57hrs
S l E ti & L b T h i i ith E ll t f ti h th hi h t tt iti
237
Attrition
1470
EmployeeCount
OverTime and %GT Attrition by
DistanceFromHome
0
50
0%
10%
20%
DistanceFromHome
OverTime
%GT
Attrition
0 20
OverTime %GT Attrition
AgeGroup
All
Attrition by WorkLifeBalance
(53.59%)
(24.47%)
(11.39%)
(10.55%)
127
58
27
25
WorkLifeBalance
Better
Good
Best
Bad
%GT Attrition by BusinessTravel
0%
20%
40%
60%
80%
100%
%GT
Attrition
5.06%
29.11%
65.82%
Business… Non-Tra… Travel Fr… Travel R…
Attrition by Performance Rating and Job Role
Attrition
237
Excellent
200
Outstanding
37
Sales Executive
51
Laboratory Technician
49
Research Scientist
35
Sales Representative
29
Human Resources
11
Manufacturing Director
10
PerformanceRati…×
Excellent
JobRole ×
4. Job Satisfaction
- Highest attrition are people who have been at the company for less than 1 year
- People with high job satisfaction has highest attrition at 30.8%, with low job satisfaction not far behind at
27.85%
- Those with 1 year total working experience has highest attrition, mostly from 18-25 year age group
P l h h l i t ti f ti h th hi h t tt iti t 72 l
237
Attrition
1470
EmployeeCount
Attrition and Job Satisfaction
100%
63%
High
Low
Very High
Medium
30.80%
27.85%
21.94%
19.41%
AgeGroup
All
Attrition and Years At Current Company
0
20
40
60
80
YearsatCOmpany2
Attrition
0 5 10 15 20
%GT Attrition by
EnvironmentSatisfaction
Low High
Very High
Medium
Attrition by TotalWorkingYears and AgeGroup
TotalWorkingYears
Attrition
0 10 20 30 40
AgeGroup 18-25 26-35 36-45 46-55 56 and Above
5. Summary
237
Attrition
1470
EmployeeCount
Attrition and EmployeeCount
147
0 1470
237
Top 3 Factors
Salary
The data finds that those in the age group with the highest attrition
(26-35 year olds) are also those with the lowest salary, particularly
lowest average hourly rate. This is not a coincidence as employees seek
a high salary regardless of years of experience, and it's not surprising
the 1st, 3rd and 4th highest attrition job roles are also those with the 3
lowest salaries.
Overtime Hours
The people who have to work the most overtime hours are also those
who have the highest attrition, and attrition numbers only go down
when overtime hours go down. It's clear from the data that those who
live closest to office get the most overtime hours, and those are the
people who have the highest attrition regardless of living close to the
Top 3 Recommendations
- Better starting salary. Data indicates that a lot of people that entered the
company are not looking to stay there for the long run, with a huge factor
being a low salary, hence they leave to search for another job with better
pay. Hence, a better starting salary will encourage employees to stay
longer and decrease attrition.
- Less overtime hours. The data shows that most likely, those staying close
by to the office are being made to do more overtime, hence this needs to
change, and one way is to set a company-wide rule to limit overtime hours
to a certain number and should not exceed that. Better work-life
balance=more satisfied employees=less attrition.
- Speaking of satisfied employees, it is apparent that since the people who
have the highest attrition also have at least 1 year experience in another
company they might compare work life in this company to others and find