Download free for 30 days
Sign in
Upload
Language (EN)
Support
Business
Mobile
Social Media
Marketing
Technology
Art & Photos
Career
Design
Education
Presentations & Public Speaking
Government & Nonprofit
Healthcare
Internet
Law
Leadership & Management
Automotive
Engineering
Software
Recruiting & HR
Retail
Sales
Services
Science
Small Business & Entrepreneurship
Food
Environment
Economy & Finance
Data & Analytics
Investor Relations
Sports
Spiritual
News & Politics
Travel
Self Improvement
Real Estate
Entertainment & Humor
Health & Medicine
Devices & Hardware
Lifestyle
Change Language
Language
English
Español
Português
Français
Deutsche
Cancel
Save
EN
Uploaded by
smithalfonso70
PDF, PPTX
9 views
Existing Baseline Workshop for existing conditions
Existing Baseline Workshop in claims
Engineering
◦
Read more
0
Save
Share
Embed
Embed presentation
Download
Download as PDF, PPTX
1
/ 51
2
/ 51
3
/ 51
4
/ 51
5
/ 51
6
/ 51
7
/ 51
8
/ 51
9
/ 51
10
/ 51
11
/ 51
12
/ 51
13
/ 51
14
/ 51
15
/ 51
16
/ 51
17
/ 51
18
/ 51
19
/ 51
20
/ 51
21
/ 51
22
/ 51
23
/ 51
24
/ 51
25
/ 51
26
/ 51
27
/ 51
28
/ 51
29
/ 51
30
/ 51
31
/ 51
32
/ 51
33
/ 51
34
/ 51
35
/ 51
36
/ 51
37
/ 51
38
/ 51
39
/ 51
40
/ 51
41
/ 51
42
/ 51
43
/ 51
44
/ 51
45
/ 51
46
/ 51
47
/ 51
48
/ 51
49
/ 51
50
/ 51
51
/ 51
More Related Content
PDF
2: Introduction to Energy Audit Methods in Water Supply
by
Alliance To Save Energy
PPT
When Does "Use Less" Become A Business
by
Eric Huang, LEED AP
PPT
Practically Delivering Energy-Reducing Technology To Optimise Efficiency On T...
by
Andy_Watson_Sim
PPTX
Module 3 - Incorporating non-financial data into organisational decision making
by
Paul Brown
PDF
Facility Optimization
by
cwoodson
PPTX
Energy costs reduction
by
Energy Intelligence Group
PPT
Paul Hamilton, Schneider Electric: Lean and Clean: Equipping Modern Manufactu...
by
guest3e1229f
PPT
Paul Hamilton, Schneider Electric: Lean and Clean: Equipping Modern Manufactu...
by
Alliance To Save Energy
2: Introduction to Energy Audit Methods in Water Supply
by
Alliance To Save Energy
When Does "Use Less" Become A Business
by
Eric Huang, LEED AP
Practically Delivering Energy-Reducing Technology To Optimise Efficiency On T...
by
Andy_Watson_Sim
Module 3 - Incorporating non-financial data into organisational decision making
by
Paul Brown
Facility Optimization
by
cwoodson
Energy costs reduction
by
Energy Intelligence Group
Paul Hamilton, Schneider Electric: Lean and Clean: Equipping Modern Manufactu...
by
guest3e1229f
Paul Hamilton, Schneider Electric: Lean and Clean: Equipping Modern Manufactu...
by
Alliance To Save Energy
Similar to Existing Baseline Workshop for existing conditions
PDF
Energy Audit / Energy Conservation PPT and PDF
by
Enerco Energy Solutions LLP
PDF
Project Kickoff Webinar Slides: MN Energy Efficiency & Carbon Saving Potentia...
by
Center for Energy and Environment
PDF
Illinois Healthy & High Performing Schools Symposium: Leveraging Resources to...
by
Catherine Krasner
PDF
EIS Overview & Case Studies Presentation EIS 2016
by
Dennis Cody
PDF
Energy STEP
by
Schneider Electric India
PPTX
Energy Conservatoion and Mgmt part 2.pptx
by
BasicScience2
PDF
Strategic Energy Management in the Midwest - A Process Efficiency Case Study ...
by
Midwest Energy Efficiency Alliance
PPTX
GTC_Energy Services_Mexico City
by
Diana Nash
PPTX
Introduction to School Energy Management
by
Meg Thompson
PPT
Focus On Energy It Presentation 2009 12 02
by
JeremyMathews
PDF
Future of the U.S. Energy Grid
by
thinkdsi
PPTX
Novaroverview 12805227307026 Phpapp01
by
stevehamby1
PPTX
Novaroverview 12805227307026 Phpapp01
by
stevehamby1
PDF
Power therm
by
John Harrington
PPTX
Energy Management Best Practices - SchoolDude
by
SchoolDude
PPT
Efficiency
by
Junaid Najum
PDF
How to Make Energy Efficiency Work for You
by
Kegler Brown Hill + Ritter
PPTX
Energy Management Turned - Energy Productivity
by
Ezra Nielsen
PDF
Evaluation, Measurement & Verification (EM&V) – Overview of Best Practices fo...
by
Leonardo ENERGY
PPT
Energy audit
by
Saifullah Memon
Energy Audit / Energy Conservation PPT and PDF
by
Enerco Energy Solutions LLP
Project Kickoff Webinar Slides: MN Energy Efficiency & Carbon Saving Potentia...
by
Center for Energy and Environment
Illinois Healthy & High Performing Schools Symposium: Leveraging Resources to...
by
Catherine Krasner
EIS Overview & Case Studies Presentation EIS 2016
by
Dennis Cody
Energy STEP
by
Schneider Electric India
Energy Conservatoion and Mgmt part 2.pptx
by
BasicScience2
Strategic Energy Management in the Midwest - A Process Efficiency Case Study ...
by
Midwest Energy Efficiency Alliance
GTC_Energy Services_Mexico City
by
Diana Nash
Introduction to School Energy Management
by
Meg Thompson
Focus On Energy It Presentation 2009 12 02
by
JeremyMathews
Future of the U.S. Energy Grid
by
thinkdsi
Novaroverview 12805227307026 Phpapp01
by
stevehamby1
Novaroverview 12805227307026 Phpapp01
by
stevehamby1
Power therm
by
John Harrington
Energy Management Best Practices - SchoolDude
by
SchoolDude
Efficiency
by
Junaid Najum
How to Make Energy Efficiency Work for You
by
Kegler Brown Hill + Ritter
Energy Management Turned - Energy Productivity
by
Ezra Nielsen
Evaluation, Measurement & Verification (EM&V) – Overview of Best Practices fo...
by
Leonardo ENERGY
Energy audit
by
Saifullah Memon
Recently uploaded
PPTX
Fake News Detection System | Plagiarism detection
by
surajkanojiya13
PPTX
CHAPTER 13 - NUCLEI - CLASS XII PHYSICS 2025-26
by
bhavaneeth1
PPTX
24ME402-ENGINEERING MATERIALS AND METALLURGY --- UNIT-II
by
DJAGADEESH1
PDF
TRUSTWORTHY AI: BUILDING SAFE AND ETHICAL MACHINE LEARNING SYSTEMS
by
Adri Jovin
PPTX
24ME402-ENGINEERING MATERIALS AND METALLURGY --- UNIT-I
by
DJAGADEESH1
PPTX
Group-3-Ethics - Freedom as foundation for moral acts
by
CharlsCasquejo2
PPT
psoc_unit_one_for_all_thoery_potion_are_coverd_in_the_this_unit_for_everything
by
sabinesh200517
PDF
FPGA Fabric and Synthesis All Parts Combined
by
Amr Adel
PPTX
Unit-2: Network Models--OSI Reference Model, TCP/IP Reference Model
by
SuvarnaSharma5
PPTX
Why Air Droppable Containers Are Critical for Modern Aerial Logistics
by
Neometrix_Engineering_Pvt_Ltd
PDF
5.5 Inch 4K TFT LCD Display 3840×2160 UHD Panel – LS055D1SX05(G)
by
Syluxdisplay
PPTX
Explore how AI-powered maintenance checklists transform asset reliability and...
by
MaintWiz Technologies Private Limited
PPTX
M1 - HPE Alletra Storage MP B10000 - presenter.pptx
by
ThanhBnhNguyn92
PPTX
820656155-Unit-III-Univariate-Analysis.pptx
by
kalaimugill
PDF
RVV Basic Terms and Analogy - (en/zhTW) - DannyJiang
by
Danny Jiang
PPTX
farmmachinery and it’s functions and it’s mainstream 160910080709.pptx
by
hitokalijimo
PPTX
Tips for Designing Flex Circuits for Medical Applications
by
Epec Engineered Technologies
PPTX
FERROUS AND NON FERROUS ALLOYS--UNIT- III
by
DJAGADEESH1
PPTX
UNIT 2 _8051.pptx ,INSTRUCTION SET OF 8051,EXAMPLES OF ARITHMETIC,LOGICAL.BRA...
by
rekhabalaji2607
PDF
VLSI Logic Synthesis - All Parts Combined
by
Amr Adel
Fake News Detection System | Plagiarism detection
by
surajkanojiya13
CHAPTER 13 - NUCLEI - CLASS XII PHYSICS 2025-26
by
bhavaneeth1
24ME402-ENGINEERING MATERIALS AND METALLURGY --- UNIT-II
by
DJAGADEESH1
TRUSTWORTHY AI: BUILDING SAFE AND ETHICAL MACHINE LEARNING SYSTEMS
by
Adri Jovin
24ME402-ENGINEERING MATERIALS AND METALLURGY --- UNIT-I
by
DJAGADEESH1
Group-3-Ethics - Freedom as foundation for moral acts
by
CharlsCasquejo2
psoc_unit_one_for_all_thoery_potion_are_coverd_in_the_this_unit_for_everything
by
sabinesh200517
FPGA Fabric and Synthesis All Parts Combined
by
Amr Adel
Unit-2: Network Models--OSI Reference Model, TCP/IP Reference Model
by
SuvarnaSharma5
Why Air Droppable Containers Are Critical for Modern Aerial Logistics
by
Neometrix_Engineering_Pvt_Ltd
5.5 Inch 4K TFT LCD Display 3840×2160 UHD Panel – LS055D1SX05(G)
by
Syluxdisplay
Explore how AI-powered maintenance checklists transform asset reliability and...
by
MaintWiz Technologies Private Limited
M1 - HPE Alletra Storage MP B10000 - presenter.pptx
by
ThanhBnhNguyn92
820656155-Unit-III-Univariate-Analysis.pptx
by
kalaimugill
RVV Basic Terms and Analogy - (en/zhTW) - DannyJiang
by
Danny Jiang
farmmachinery and it’s functions and it’s mainstream 160910080709.pptx
by
hitokalijimo
Tips for Designing Flex Circuits for Medical Applications
by
Epec Engineered Technologies
FERROUS AND NON FERROUS ALLOYS--UNIT- III
by
DJAGADEESH1
UNIT 2 _8051.pptx ,INSTRUCTION SET OF 8051,EXAMPLES OF ARITHMETIC,LOGICAL.BRA...
by
rekhabalaji2607
VLSI Logic Synthesis - All Parts Combined
by
Amr Adel
Existing Baseline Workshop for existing conditions
1.
DISPUTES & INVESTIGATIONS
• ECONOM ICS • FINANCIAL ADVISORY • M ANAGEM ENT CONSULTING ©2015 NavigantConsulting, Inc. Discussion Slides Existing Baseline Workshop November 6, 2015
2.
1 ©2015 Navigant Consulting,
Inc. Content of Report This presentation was prepared by Navigant Consulting, Inc. exclusively for the benefit and use of the California Public Utilities Commission and/or its affiliates or subsidiaries. The work presented in this report represents our best efforts and judgments based on the information available at the time this report was prepared. Navigant Consulting, Inc. is not responsible for the reader’s use of, or reliance upon, the report, nor any decisions based on the report. NAVIGANT CONSULTING, INC. MAKES NO REPRESENTATIONS OR WARRANTIES, EXPRESSED OR IMPLIED. Readers of the report are advised that they assume all liabilities incurred by them, or third parties, as a result of their reliance on the report, or the data, information, findings and opinions contained in the report. November 6, 2015 Disclaimer
3.
2 ©2015 Navigant Consulting,
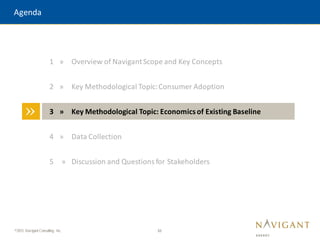
Inc. Agenda » 1 » Overview of Navigant Scope and Key Concepts 2 » Key Methodological Topic:Consumer Adoption 3 » Key Methodological Topic:Economics of Existing Baseline 4 » Data Collection 5 » Discussion and Questions for Stakeholders
4.
3 ©2015 Navigant Consulting,
Inc. » As part of its role in the EE potential and goals study, Navigant has been tasked with developing the framework, supporting data, and analysis that will identify the additional savings potential related to the to-code, operational efficiency and behavioral initiatives targeted in AB 802 » Navigant’s work scope includes: Task 1: Develop methodology and select measures Task 2: Collect data and conduct literature review Task 3: Conduct existing conditions baseline scenario analysis Task 4: Update model to forecast incremental savings potential Scope
5.
4 ©2015 Navigant Consulting,
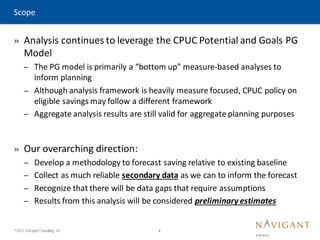
Inc. » Analysis continues to leverage the CPUC Potential and Goals PG Model – The PG model is primarily a “bottom up” measure-based analyses to inform planning – Although analysis framework is heavily measure focused, CPUC policy on eligible savings may follow a different framework – Aggregate analysis results are still valid for aggregate planning purposes » Our overarching direction: – Develop a methodology to forecast saving relative to existing baseline – Collect as much reliable secondary data as we can to inform the forecast – Recognize that there will be data gaps that require assumptions – Results from this analysis will be considered preliminary estimates Scope
6.
5 ©2015 Navigant Consulting,
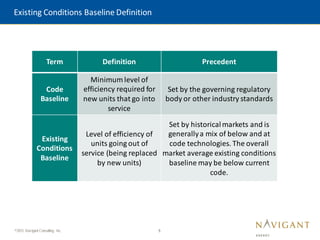
Inc. Existing Conditions Baseline Definition Term Definition Precedent Code Baseline Minimum level of efficiency required for new units that go into service Set by the governing regulatory body or other industry standards Existing Conditions Baseline Level of efficiency of units going out of service (being replaced by new units) Set by historicalmarkets and is generallya mix of below and at code technologies. The overall market average existing conditions baseline may be below current code.
7.
6 ©2015 Navigant Consulting,
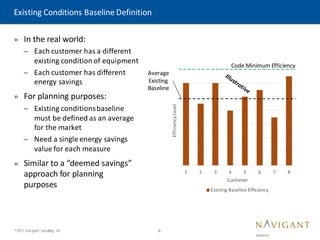
Inc. » In the real world: – Each customer has a different existing conditionof equipment – Each customer has different energy savings » For planning purposes: – Existing conditionsbaseline must be defined as an average for the market – Need a single energy savings value for each measure » Similar to a “deemed savings” approach for planning purposes Existing Conditions Baseline Definition 1 2 3 4 5 6 7 8 Efficiency Level Customer Existing Baseline Efficiency Code Minimum Efficiency Average Existing Baseline
8.
7 ©2015 Navigant Consulting,
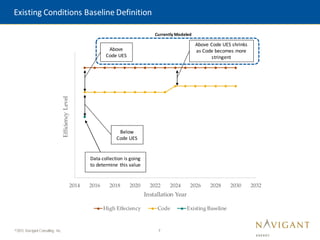
Inc. 2014 2016 2018 2020 2022 2024 2026 2028 2030 2032 Efficiency Level Installation Year High Effeciency Code Existing Baseline Existing Conditions Baseline Definition Above Code UES Above Code UES shrinks as Code becomes more stringent Currently Modeled Below Code UES Data collection is going to determine this value
9.
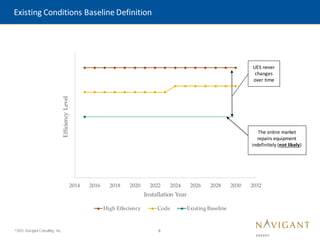
8 ©2015 Navigant Consulting,
Inc. 2014 2016 2018 2020 2022 2024 2026 2028 2030 2032 Efficiency Level Installation Year High Effeciency Code Existing Baseline Existing Conditions Baseline Definition The entire market repairs equipment indefinitely (not likely) UES never changes over time
10.
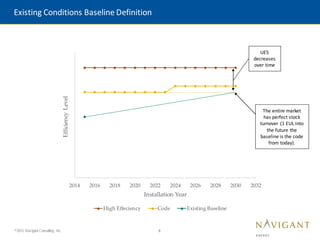
9 ©2015 Navigant Consulting,
Inc. Existing Conditions Baseline Definition The entire market has perfect stock turnover (1 EUL into the future the baseline is the code from today). UES decreases over time 2014 2016 2018 2020 2022 2024 2026 2028 2030 2032 Efficiency Level Installation Year High Effeciency Code Existing Baseline
11.
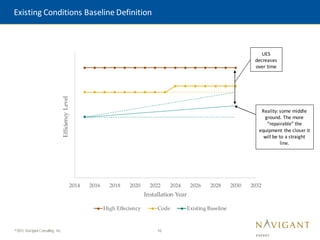
10 ©2015 Navigant Consulting,
Inc. Reality: some middle ground. The more “repairable” the equipment the closer it will be to a straight line. 2014 2016 2018 2020 2022 2024 2026 2028 2030 2032 Efficiency Level Installation Year High Effeciency Code Existing Baseline Existing Conditions Baseline Definition UES decreases over time
12.
11 ©2015 Navigant Consulting,
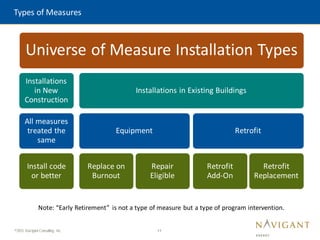
Inc. Types of Measures Universe of Measure Installation Types Installations in New Construction All measures treated the same Install code or better Installations in Existing Buildings Equipment Replace on Burnout Repair Eligible Retrofit Retrofit Add-On Retrofit Replacement Note: “Early Retirement” is not a type of measure but a type of program intervention.
13.
12 ©2015 Navigant Consulting,
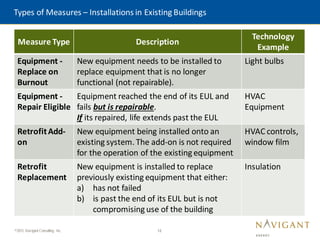
Inc. Types of Measures – Installations in Existing Buildings Measure Type Description Technology Example Equipment - Replace on Burnout New equipment needs to be installed to replace equipment that is no longer functional (not repairable). Light bulbs Equipment - Repair Eligible Equipment reached the end of its EUL and fails but is repairable. If its repaired, life extends past the EUL HVAC Equipment RetrofitAdd- on New equipment being installed onto an existing system. The add-on is not required for the operation of the existing equipment HVAC controls, window film Retrofit Replacement New equipment is installed to replace previously existing equipment that either: a) has not failed b) is past the end of its EUL but is not compromising use of the building Insulation
14.
13 ©2015 Navigant Consulting,
Inc. » Two different purposes of an energy efficiency forecast: – Inform CPUC policy and IOU goal setting process – Inform CaliforniaEnergy Commission Statewide Demand Forecast (informs energy procurement) » The full savings that IOUs can claim from programs maynot necessarily be the savings that can be counted on in the CEC demand forecast. CEC already accounts for: – Savings from Codes and Standards – NaturallyOccurring Energy Efficiency » The different measure types may be treated differently in terms of what savings counts towards the CEC demand forecast. Why Measure Type Matters
15.
14 ©2015 Navigant Consulting,
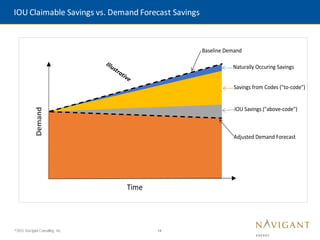
Inc. IOU Claimable Savings vs. Demand Forecast Savings Demand Time Savings from Codes ("to-code") IOU Savings ("above-code") Naturally Occuring Savings Baseline Demand Adjusted Demand Forecast
16.
15 ©2015 Navigant Consulting,
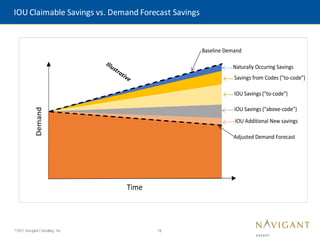
Inc. IOU Claimable Savings vs. Demand Forecast Savings Demand Time Savings from Codes ("to-code") IOU Savings ("above-code") Naturally Occuring Savings Baseline Demand Adjusted Demand Forecast Demand Time Savings from Codes ("to-code") IOU Savings ("above-code") Naturally Occuring Savings Baseline Demand Adjusted Demand Forecast IOU Savings ("to-code") IOU Additional New savings
17.
16 ©2015 Navigant Consulting,
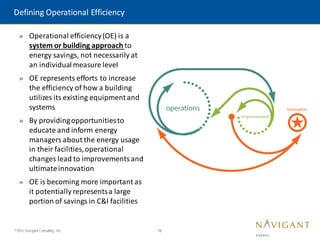
Inc. » Operational efficiency(OE) is a system or building approach to energy savings, not necessarily at an individualmeasure level » OE represents efforts to increase the efficiency of how a building utilizes its existing equipmentand systems » By providingopportunitiesto educate and inform energy managers about the energy usage in their facilities,operational changes lead to improvements and ultimateinnovation » OE is becoming more important as it potentially representsa large portion of savings in C&I facilities Defining Operational Efficiency
18.
17 ©2015 Navigant Consulting,
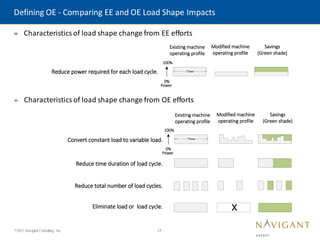
Inc. Defining OE - Comparing EE and OE Load Shape Impacts » Characteristics of load shape change from EE efforts » Characteristics of load shape change from OE efforts Existing machine operating profile Modified machine operating profile Savings (Green shade) Reduce power required for each load cycle. Time 100% 0% Power Convert constant load to variable load. Reduce time duration of load cycle. Reduce total number of load cycles. Eliminate load or load cycle. Existing machine operating profile Modified machine operating profile Savings (Green shade) Time 100% 0% Power
19.
18 ©2015 Navigant Consulting,
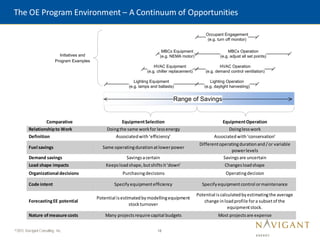
Inc. The OE Program Environment – A Continuum of Opportunities Comparative EquipmentSelection EquipmentOperation Relationshipto Work Doingthe same workfor lessenergy Doinglesswork Definition Associatedwith‘efficiency’ Associatedwith‘conservation’ Fuel savings Same operatingdurationatlowerpower Differentoperatingdurationand/or variable powerlevels Demand savings Savingsacertain Savingsare uncertain Load shape impacts Keepsloadshape,butshiftsit‘down’ Changesloadshape Organizational decisions Purchasingdecisions Operatingdecision Code intent Specifyequipmentefficiency Specifyequipmentcontrol ormaintenance ForecastingEE potential Potential isestimatedbymodellingequipment stockturnover Potential iscalculatedbyestimatingthe average change inloadprofile fora subsetof the equipmentstock. Nature of measure costs Many projectsrequire capital budgets Most projectsare expense Initiatives and Program Examples Lighting Equipment (e.g. lamps and ballasts) Lighting Operation (e.g. daylight harvesting) HVAC Equipment (e.g. chiller replacement) HVAC Operation (e.g. demand control ventilation) Occupant Engagement (e.g. turn off monitor) MBCx Equipment (e.g. NEMA motor) MBCx Operation (e.g. adjust all set points) Range of Savings
20.
19 ©2015 Navigant Consulting,
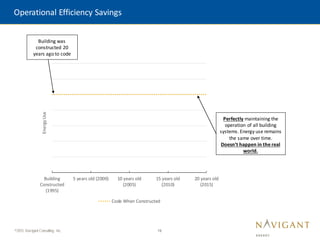
Inc. Operational Efficiency Savings Building Constructed (1995) 5 years old (2000) 10 years old (2005) 15 years old (2010) 20 years old (2015) Energy Use Code When Constructed Building was constructed 20 years ago to code Perfectly maintaining the operation of all building systems. Energy use remains the same over time. Doesn’t happen in the real world.
21.
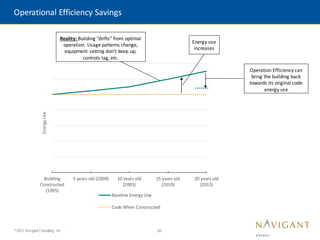
20 ©2015 Navigant Consulting,
Inc. Operational Efficiency Savings Building Constructed (1995) 5 years old (2000) 10 years old (2005) 15 years old (2010) 20 years old (2015) Energy Use Baseline Energy Use Code When Constructed Reality: Building “drifts” from optimal operation. Usage patterns change, equipment setting don’t keep up, controls lag, etc. Energy use increases Operation Efficiency can bring the building back towards its original code energy use
22.
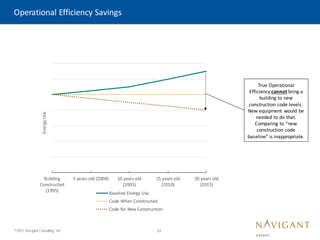
21 ©2015 Navigant Consulting,
Inc. Operational Efficiency Savings Building Constructed (1995) 5 years old (2000) 10 years old (2005) 15 years old (2010) 20 years old (2015) Energy Use Baseline Energy Use Code When Constructed Code for New Construction True Operational Efficiency cannot bring a building to new construction code levels. New equipment would be needed to do that. Comparing to “new construction code baseline” is inappropriate.
23.
22 ©2015 Navigant Consulting,
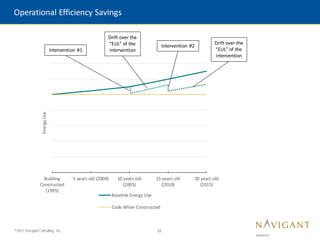
Inc. Operational Efficiency Savings Building Constructed (1995) 5 years old (2000) 10 years old (2005) 15 years old (2010) 20 years old (2015) Energy Use Baseline Energy Use Code When Constructed Intervention #1 Drift over the “EUL” of the intervention Intervention #2 Drift over the “EUL” of the intervention
24.
23 ©2015 Navigant Consulting,
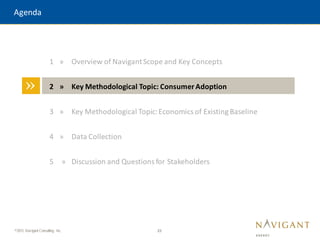
Inc. Agenda » 1 » Overview of NavigantScope and Key Concepts 2 » Key Methodological Topic: ConsumerAdoption 3 » Key Methodological Topic:Economics of Existing Baseline 4 » Data Collection 5 » Discussion and Questions for Stakeholders
25.
24 ©2015 Navigant Consulting,
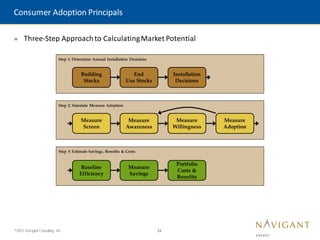
Inc. » Three-Step Approachto CalculatingMarket Potential Consumer Adoption Principals
26.
25 ©2015 Navigant Consulting,
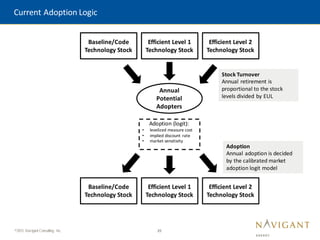
Inc. Efficient Level 1 Technology Stock Baseline/Code Technology Stock Efficient Level 2 Technology Stock Annual Potential Adopters Stock Turnover Annual retirement is proportional to the stock levels divided by EUL Adoption (logit): • levelized measure cost • implied discount rate • market sensitivity Efficient Level 1 Technology Stock Baseline/Code Technology Stock Efficient Level 2 Technology Stock Adoption Annual adoption is decided by the calibrated market adoption logit model Current Adoption Logic
27.
26 ©2015 Navigant Consulting,
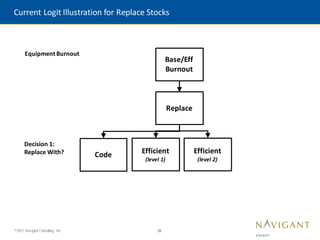
Inc. Replace Code Efficient (level 1) Efficient (level 2) Base/Eff Burnout Equipment Burnout Decision 1: Replace With? Current Logit Illustration for Replace Stocks
28.
27 ©2015 Navigant Consulting,
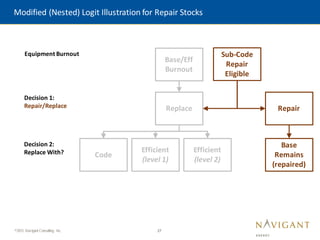
Inc. Replace Code Efficient (level 1) Efficient (level 2) Sub-Code Repair Eligible Repair Base/Eff Burnout Equipment Burnout Decision 1: Repair/Replace Decision 2: Replace With? Modified (Nested) Logit Illustration for Repair Stocks Base Remains (repaired)
29.
28 ©2015 Navigant Consulting,
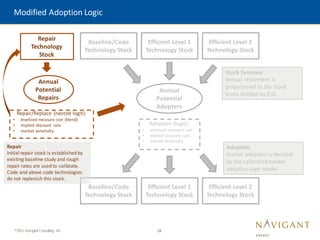
Inc. Efficient Level 1 Technology Stock Baseline/Code Technology Stock Efficient Level 2 Technology Stock Annual Potential Adopters Stock Turnover Annual retirement is proportional to the stock levels divided by EUL Adoption (logit): • levelized measure cost • implied discount rate • market sensitivity Efficient Level 1 Technology Stock Baseline/Code Technology Stock Efficient Level 2 Technology Stock Adoption Annual adoption is decided by the calibrated market adoption logit model Repair Technology Stock Annual Potential Repairs Repair/Replace (nested logit): • levelized measure cost (blend) • implied discount rate • market sensitivity Repair Initial repair stock is established by existing baseline study and rough repair rates are used to calibrate. Code and above code technologies do not replenish this stock. Modified Adoption Logic
30.
29 ©2015 Navigant Consulting,
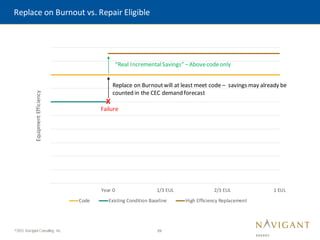
Inc. Replace on Burnout vs. Repair Eligible Year 0 1/3 EUL 2/3 EUL 1 EUL Equipment Efficiency Code Existing Condition Baseline High Efficiency Replacement X Replace on Burnoutwill at least meet code – savings may already be counted in the CEC demand forecast “Real IncrementalSavings” –Abovecodeonly Failure
31.
30 ©2015 Navigant Consulting,
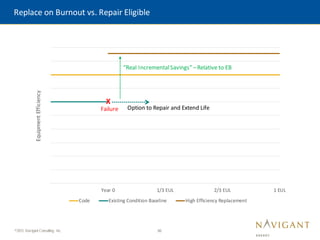
Inc. Replace on Burnout vs. Repair Eligible Year 0 1/3 EUL 2/3 EUL 1 EUL Equipment Efficiency Code Existing Condition Baseline High Efficiency Replacement X Failure “Real IncrementalSavings” –Relative to EB Option to Repair and Extend Life
32.
31 ©2015 Navigant Consulting,
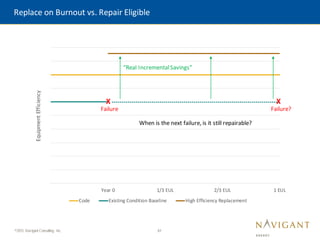
Inc. Replace on Burnout vs. Repair Eligible Year 0 1/3 EUL 2/3 EUL 1 EUL Equipment Efficiency Code Existing Condition Baseline High Efficiency Replacement X Failure “Real IncrementalSavings” When is the next failure, is it still repairable? X Failure?
33.
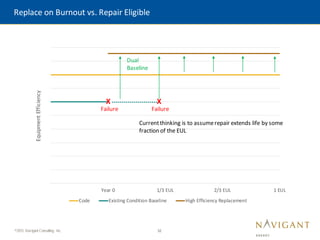
32 ©2015 Navigant Consulting,
Inc. Replace on Burnout vs. Repair Eligible Year 0 1/3 EUL 2/3 EUL 1 EUL Equipment Efficiency Code Existing Condition Baseline High Efficiency Replacement X Failure Dual Baseline Currentthinking is to assumerepair extends life by some fraction of the EUL X Failure
34.
33 ©2015 Navigant Consulting,
Inc. Agenda » 1 » Overview of NavigantScope and Key Concepts 2 » Key Methodological Topic:Consumer Adoption 3 » Key Methodological Topic: Economicsof Existing Baseline 4 » Data Collection 5 » Discussion and Questions for Stakeholders
35.
34 ©2015 Navigant Consulting,
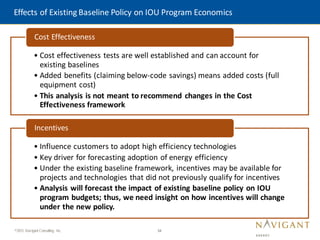
Inc. Effects of Existing Baseline Policy on IOU Program Economics • Cost effectiveness tests are well established and can account for existing baselines • Added benefits (claiming below-code savings) means added costs (full equipment cost) • This analysis is not meant to recommend changes in the Cost Effectiveness framework Cost Effectiveness • Influence customers to adopt high efficiency technologies • Key driver for forecasting adoption of energy efficiency • Under the existing baseline framework, incentives may be available for projects and technologies that did not previously qualify for incentives • Analysis will forecast the impact of existing baseline policy on IOU program budgets; thus, we need insight on how incentives will change under the new policy. Incentives
36.
35 ©2015 Navigant Consulting,
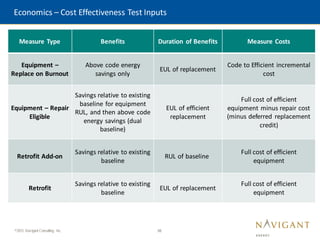
Inc. Economics – Cost Effectiveness Test Inputs Measure Type Benefits Duration of Benefits Measure Costs Equipment – Replace on Burnout Above code energy savings only EUL of replacement Code to Efficient incremental cost Equipment – Repair Eligible Savings relative to existing baseline for equipment RUL, and then above code energy savings (dual baseline) EUL of efficient replacement Full cost of efficient equipment minus repair cost (minus deferred replacement credit) Retrofit Add-on Savings relative to existing baseline RUL of baseline Full cost of efficient equipment Retrofit Savings relative to existing baseline EUL of replacement Full cost of efficient equipment
37.
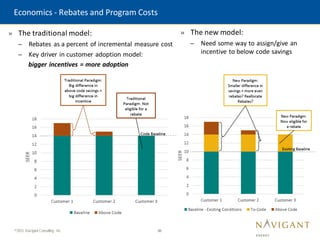
36 ©2015 Navigant Consulting,
Inc. » The traditional model: – Rebates as a percent of incremental measure cost – Key driver in customer adoption model: bigger incentives = more adoption Economics - Rebates and Program Costs » The new model: – Need some way to assign/give an incentive to below code savings
38.
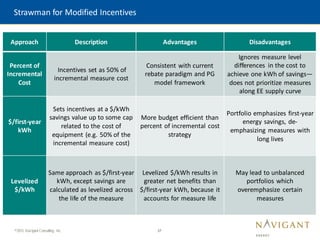
37 ©2015 Navigant Consulting,
Inc. Strawman for Modified Incentives Approach Description Advantages Disadvantages Percent of Incremental Cost Incentives set as 50% of incremental measure cost Consistent with current rebate paradigm and PG model framework Ignores measure level differences in the cost to achieve one kWh of savings— does not prioritize measures along EE supply curve $/first-year kWh Sets incentives at a $/kWh savings value up to some cap related to the cost of equipment (e.g. 50% of the incremental measure cost) More budget efficient than percent of incremental cost strategy Portfolio emphasizes first-year energy savings, de- emphasizing measures with long lives Levelized $/kWh Same approach as $/first-year kWh, except savings are calculated as levelized across the life of the measure Levelized $/kWh results in greater net benefits than $/first-year kWh, because it accounts for measure life May lead to unbalanced portfolios which overemphasize certain measures
39.
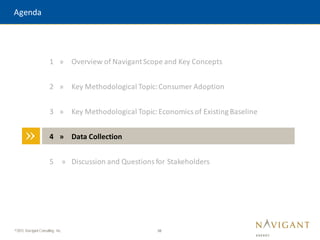
38 ©2015 Navigant Consulting,
Inc. Agenda » 1 » Overview of NavigantScope and Key Concepts 2 » Key Methodological Topic:Consumer Adoption 3 » Key Methodological Topic:Economics of Existing Baseline 4 » Data Collection 5 » Discussion and Questions for Stakeholders
40.
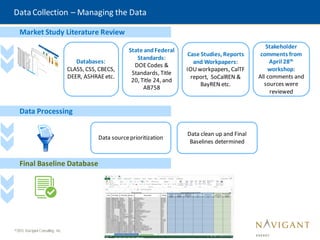
39 ©2015 Navigant Consulting,
Inc. Data Collection – Managing the Data Data clean up and Final Baselines determined Databases: CLASS, CSS, CBECS, DEER, ASHRAEetc. State andFederal Standards: DOECodes & Standards, Title 20, Title 24, and AB758 Stakeholder comments from April 28th workshop: All comments and sources were reviewed Case Studies, Reports and Workpapers: IOUworkpapers, CalTF report, SoCalREN & BayREN etc. Market Study Literature Review Data Processing Data sourceprioritization Final Baseline Database
41.
40 ©2015 Navigant Consulting,
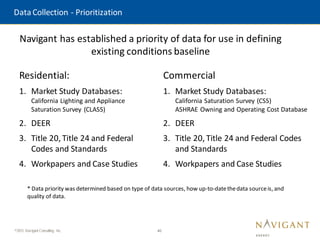
Inc. Data Collection - Prioritization Navigant has established a priority of data for use in defining existing conditions baseline Residential: 1. Market Study Databases: California Lighting and Appliance Saturation Survey (CLASS) 2. DEER 3. Title 20, Title 24 and Federal Codes and Standards 4. Workpapers and Case Studies Commercial 1. Market Study Databases: California Saturation Survey (CSS) ASHRAE Owning and Operating Cost Database 2. DEER 3. Title 20, Title 24 and Federal Codes and Standards 4. Workpapers and Case Studies * Data priority was determined based on type of data sources, how up-to-datethedata sourceis, and quality of data.
42.
41 ©2015 Navigant Consulting,
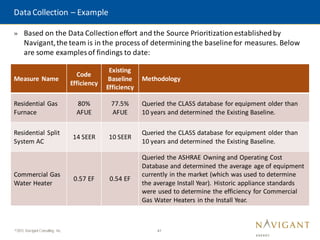
Inc. » Based on the Data Collectioneffort and the Source Prioritizationestablishedby Navigant,the team is in the process of determining the baselinefor measures. Below are some examples of findings to date: Data Collection – Example Measure Name Code Efficiency Existing Baseline Efficiency Methodology Residential Gas Furnace 80% AFUE 77.5% AFUE Queried the CLASS database for equipment older than 10 years and determined the Existing Baseline. Residential Split System AC 14 SEER 10 SEER Queried the CLASS database for equipment older than 10 years and determined the Existing Baseline. Commercial Gas Water Heater 0.57 EF 0.54 EF Queried the ASHRAE Owning and Operating Cost Database and determined the average age of equipment currently in the market (which was used to determine the average Install Year). Historic appliance standards were used to determine the efficiency for Commercial Gas Water Heaters in the Install Year.
43.
42 ©2015 Navigant Consulting,
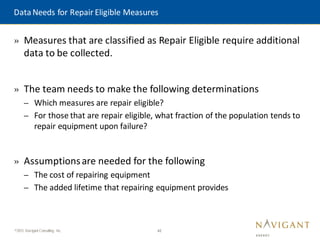
Inc. » Measures that are classified as Repair Eligible require additional data to be collected. » The team needs to make the following determinations – Which measures are repair eligible? – For those that are repair eligible, what fraction of the population tends to repair equipment upon failure? » Assumptionsare needed for the following – The cost of repairing equipment – The added lifetime that repairing equipment provides Data Needs for Repair Eligible Measures
44.
43 ©2015 Navigant Consulting,
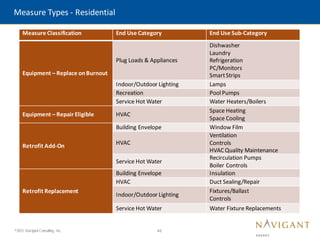
Inc. Measure Types - Residential Measure Classification End Use Category End Use Sub-Category Equipment – Replace onBurnout Plug Loads & Appliances Dishwasher Laundry Refrigeration PC/Monitors SmartStrips Indoor/Outdoor Lighting Lamps Recreation PoolPumps Service Hot Water Water Heaters/Boilers Equipment – Repair Eligible HVAC Space Heating Space Cooling Retrofit Add-On Building Envelope Window Film HVAC Ventilation Controls HVAC Quality Maintenance Service Hot Water Recirculation Pumps Boiler Controls Retrofit Replacement Building Envelope Insulation HVAC Duct Sealing/Repair Indoor/Outdoor Lighting Fixtures/Ballast Controls Service Hot Water Water Fixture Replacements
45.
44 ©2015 Navigant Consulting,
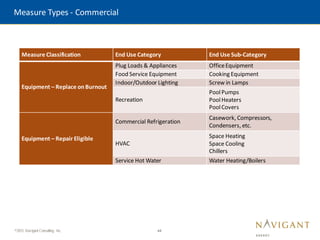
Inc. Measure Types - Commercial Measure Classification End Use Category End Use Sub-Category Equipment – Replace onBurnout Plug Loads & Appliances OfficeEquipment Food Service Equipment Cooking Equipment Indoor/Outdoor Lighting Screw in Lamps Recreation PoolPumps PoolHeaters PoolCovers Equipment – Repair Eligible Commercial Refrigeration Casework, Compressors, Condensers, etc. HVAC Space Heating Space Cooling Chillers Service Hot Water Water Heating/Boilers
46.
45 ©2015 Navigant Consulting,
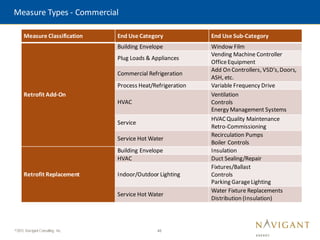
Inc. Measure Types - Commercial Measure Classification End Use Category End Use Sub-Category Retrofit Add-On Building Envelope Window Film Plug Loads & Appliances Vending Machine Controller OfficeEquipment Commercial Refrigeration Add On Controllers, VSD’s,Doors, ASH, etc. Process Heat/Refrigeration Variable Frequency Drive HVAC Ventilation Controls Energy Management Systems Service HVAC Quality Maintenance Retro-Commissioning Service Hot Water Recirculation Pumps Boiler Controls Retrofit Replacement Building Envelope Insulation HVAC Duct Sealing/Repair Indoor/Outdoor Lighting Fixtures/Ballast Controls Parking GarageLighting Service Hot Water Water Fixture Replacements Distribution (Insulation)
47.
46 ©2015 Navigant Consulting,
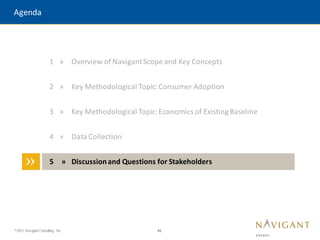
Inc. Agenda » 1 » Overview of NavigantScope and Key Concepts 2 » Key Methodological Topic:Consumer Adoption 3 » Key Methodological Topic:Economics of Existing Baseline 4 » Data Collection 5 » Discussionand Questions for Stakeholders
48.
47 ©2015 Navigant Consulting,
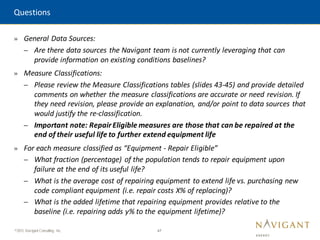
Inc. » General Data Sources: – Are there data sources the Navigant team is not currently leveraging that can provide information on existing conditions baselines? » Measure Classifications: – Please review the Measure Classifications tables (slides 43-45) and provide detailed comments on whether the measure classifications are accurate or need revision. If they need revision, please provide an explanation, and/or point to data sources that would justify the re-classification. – Important note: RepairEligible measures are those that can be repaired at the end of their useful life to further extend equipment life » For each measure classified as “Equipment - Repair Eligible” – What fraction (percentage) of the population tends to repair equipment upon failure at the end of its useful life? – What is the average cost of repairing equipment to extend life vs. purchasing new code compliant equipment (i.e. repair costs X% of replacing)? – What is the added lifetime that repairing equipment provides relative to the baseline (i.e. repairing adds y% to the equipment lifetime)? Questions
49.
48 ©2015 Navigant Consulting,
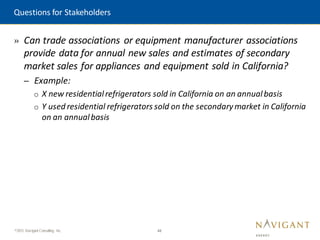
Inc. » Can trade associations or equipment manufacturer associations provide data for annual new sales and estimates of secondary market sales for appliances and equipment sold in California? – Example: o X new residentialrefrigerators sold in California on an annualbasis o Y used residential refrigerators sold on the secondarymarket in California on an annualbasis Questions for Stakeholders
50.
49 ©2015 Navigant Consulting,
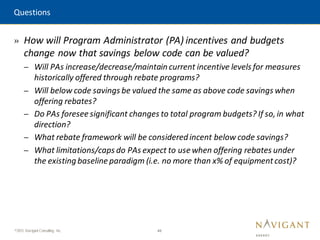
Inc. » How will Program Administrator (PA) incentives and budgets change now that savings below code can be valued? – Will PAs increase/decrease/maintain current incentive levels for measures historically offered through rebate programs? – Will below code savings be valued the same as above code savings when offering rebates? – Do PAs foresee significant changes to total program budgets? If so, in what direction? – What rebate framework will be considered incent below code savings? – What limitations/caps do PAs expect to use when offering rebates under the existing baseline paradigm (i.e. no more than x% of equipmentcost)? Questions
51.
Key C O N
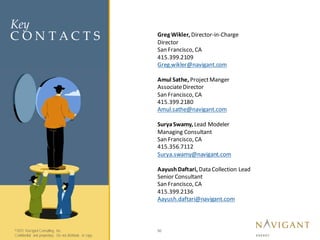
T A C T S ©2010 Navigant Consulting, Inc. Confidential and proprietary. Do not distribute or copy. Key C O N T A C T S ©2010 Navigant Consulting, Inc. Confidential and proprietary. Do not distribute or copy. Key C O N T A C T S ©2010 Navigant Consulting, Inc. Confidential and proprietary. Do not distribute or copy. Key C O N T A C T S ©2015 Navigant Consulting, Inc. Confidential and proprietary. Do not distribute or copy. 50 Greg Wikler, Director-in-Charge Director San Francisco, CA 415.399.2109 Greg.wikler@navigant.com Amul Sathe, ProjectManger AssociateDirector San Francisco, CA 415.399.2180 Amul.sathe@navigant.com SuryaSwamy, Lead Modeler Managing Consultant San Francisco, CA 415.356.7112 Surya.swamy@navigant.com AayushDaftari, Data Collection Lead Senior Consultant San Francisco, CA 415.399.2136 Aayush.daftari@navigant.com
Download