
Downloaded 111 times
![Data Spar sity
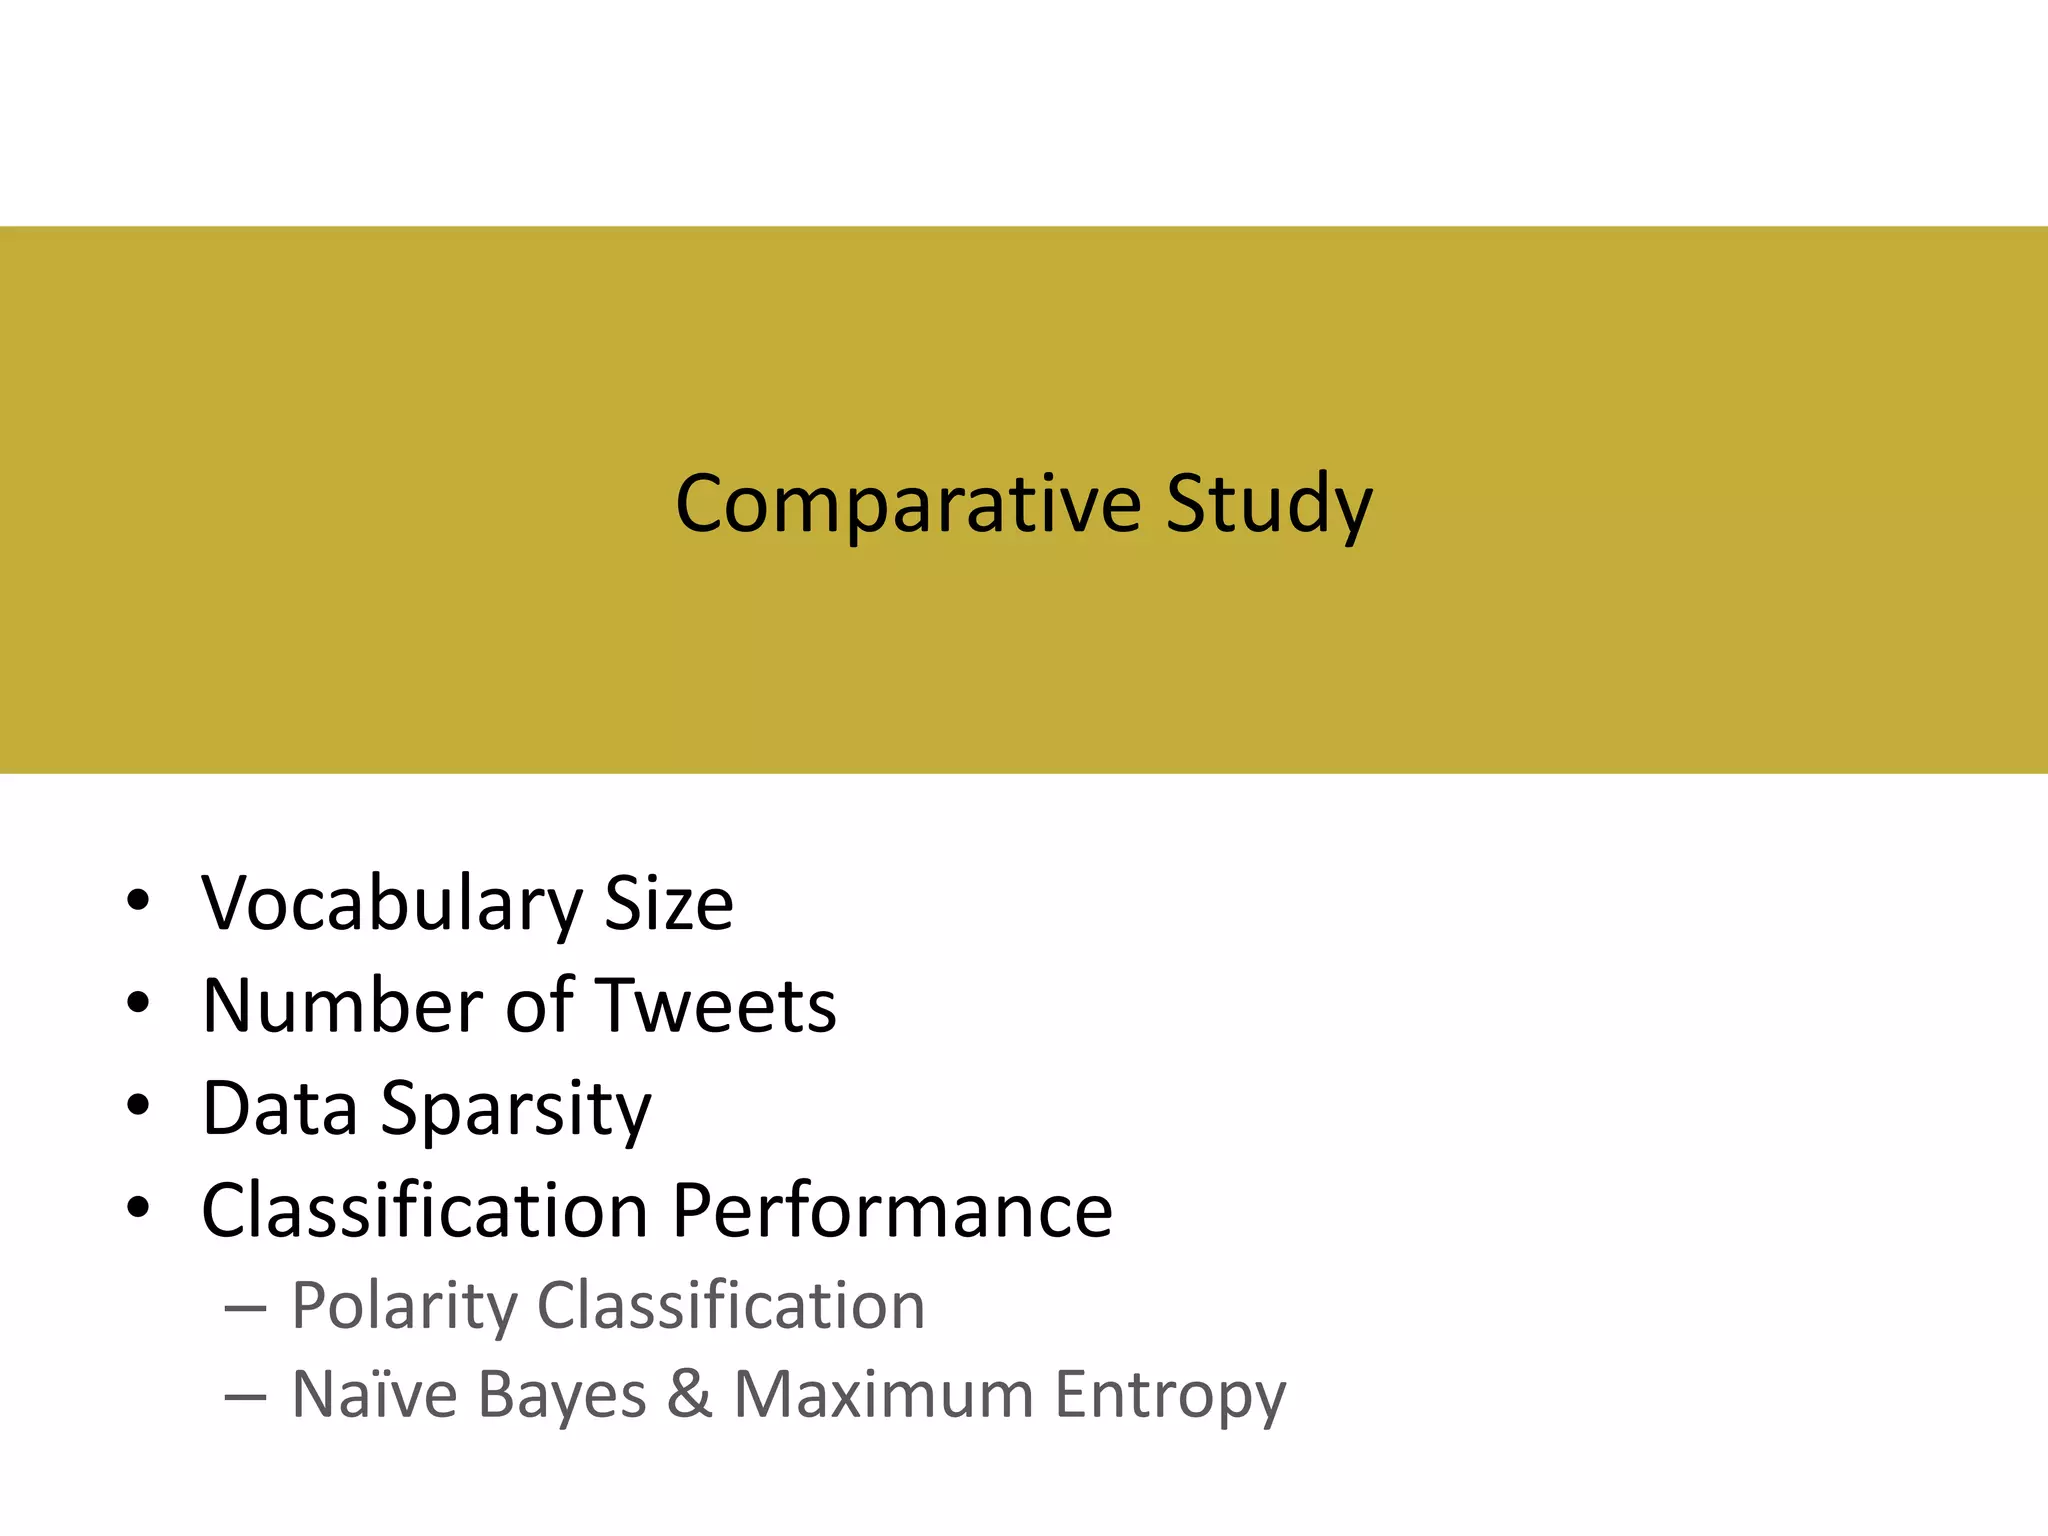
Comparativeimportant factor that affectstheov
Da s t s rs isa Study.2
ta e pa ity
n
-
m chinele rning cla s rs[17]. According toS if e a
a
a
s ifie
a t l.
tha
nothe type
r
sof da
ta(e m
.g., oviere w da ) duetoa
vie
ta
Data Sparsity in tweets.
words
Inthiss ction, wea
e
imtocom rethepre e dda s ts
pa
s nte ta e
Twitter datasets are generally tethes rs de eof agive
Toca
lculavery sparse ity gre
pa
nda s t weus
ta e
e
Increasing both the number of tweets or the vocabulary size increases the sparsity
[13]:
Pn
degree of the dataset:
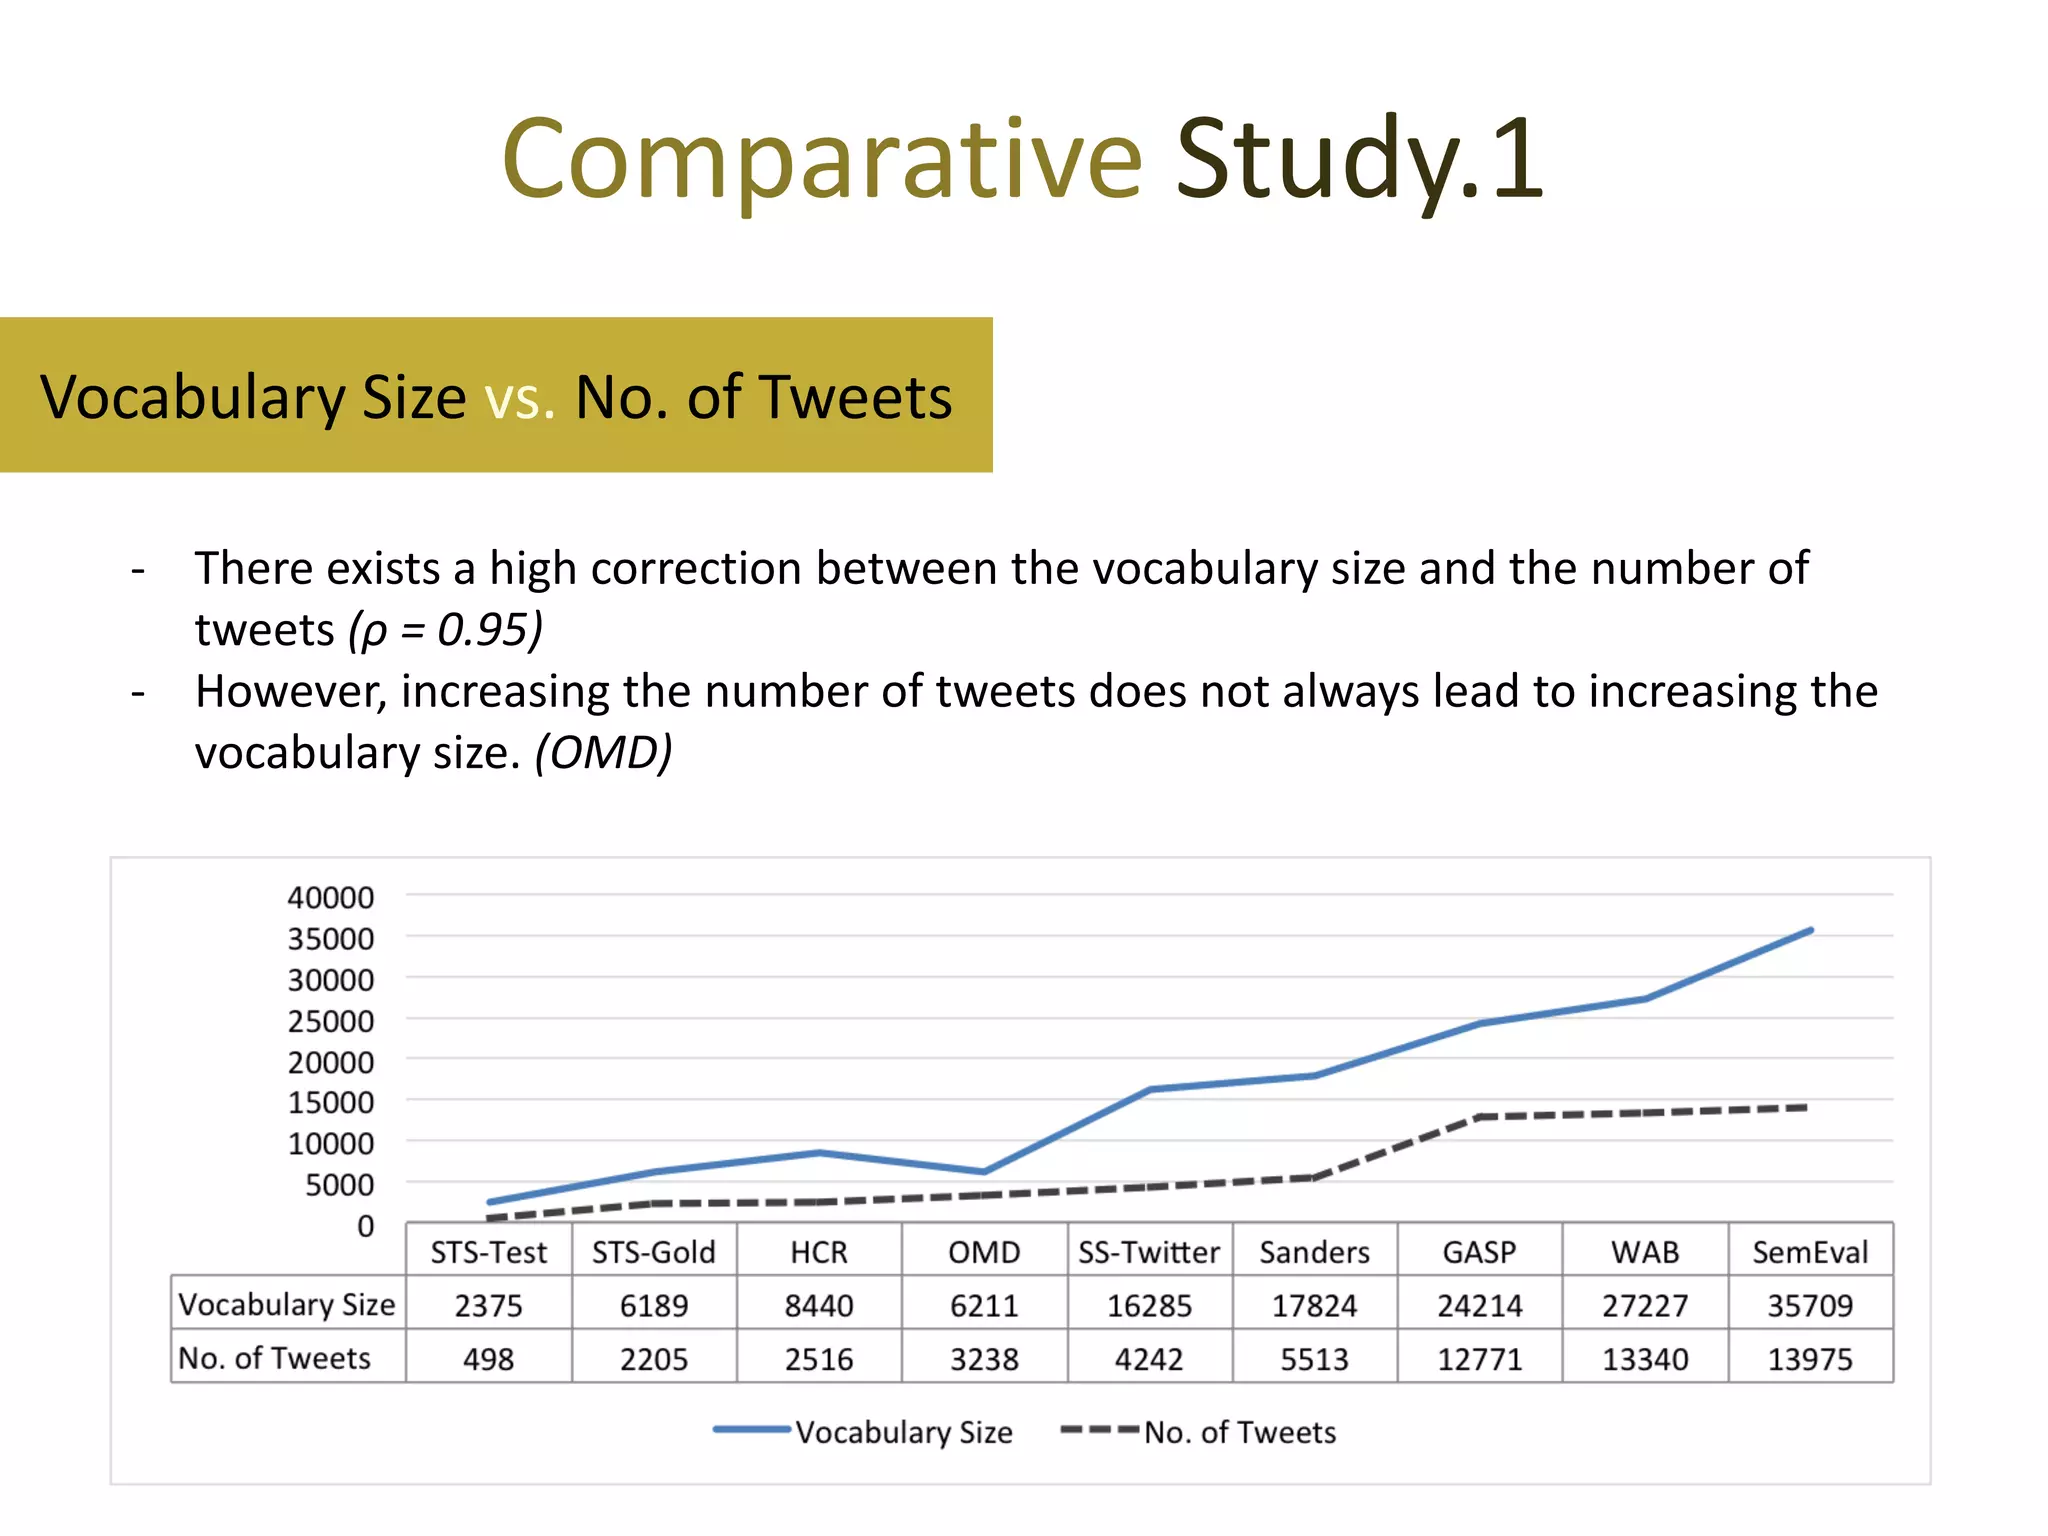
- ρno_of_tweets = 0.71
i Ni
Sd = 1 −
- ρvocabulary_size = 0.77
n ⇥ |V |
Whe
reN i isthethenum r of dis
be
tinct wordsintwe t i
e
the dataset and |V | the vocabulary size.
9
The Twe tNLP toke r ca be downloa d from ht t p:
e
nize n
de
Tweet NLP/](https://image.slidesharecdn.com/essem2013slideshare-131205112859-phpapp02/75/Evaluation-Datasets-for-Twitter-Sentiment-Analysis-A-survey-and-a-new-dataset-the-STS-Gold-14-2048.jpg)
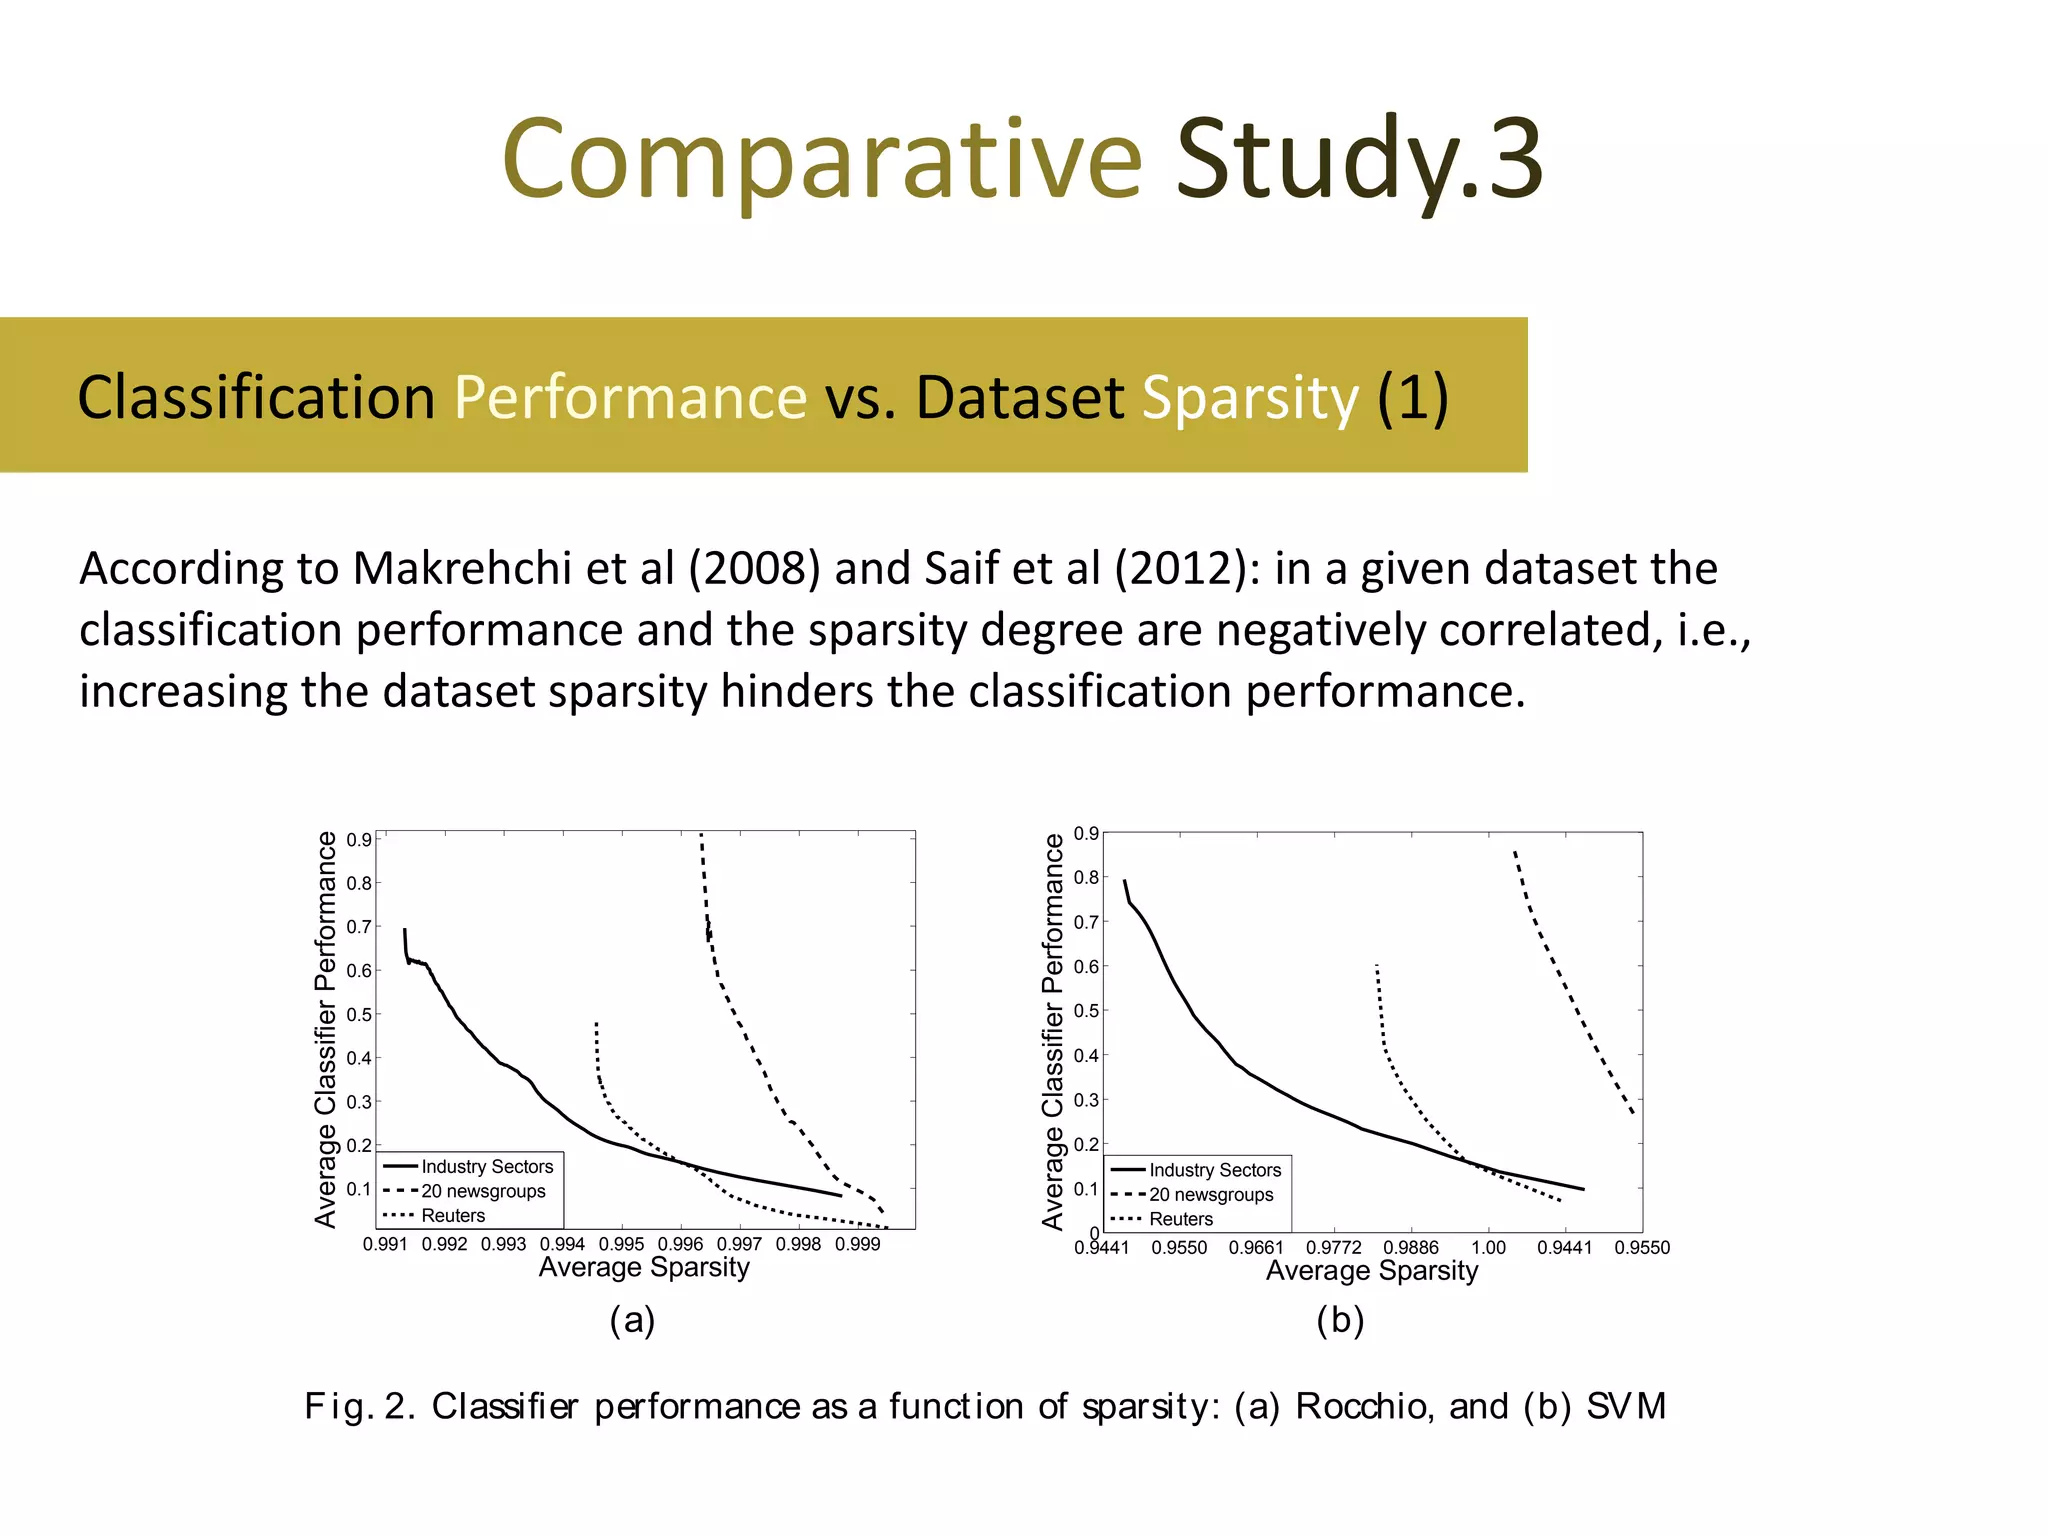

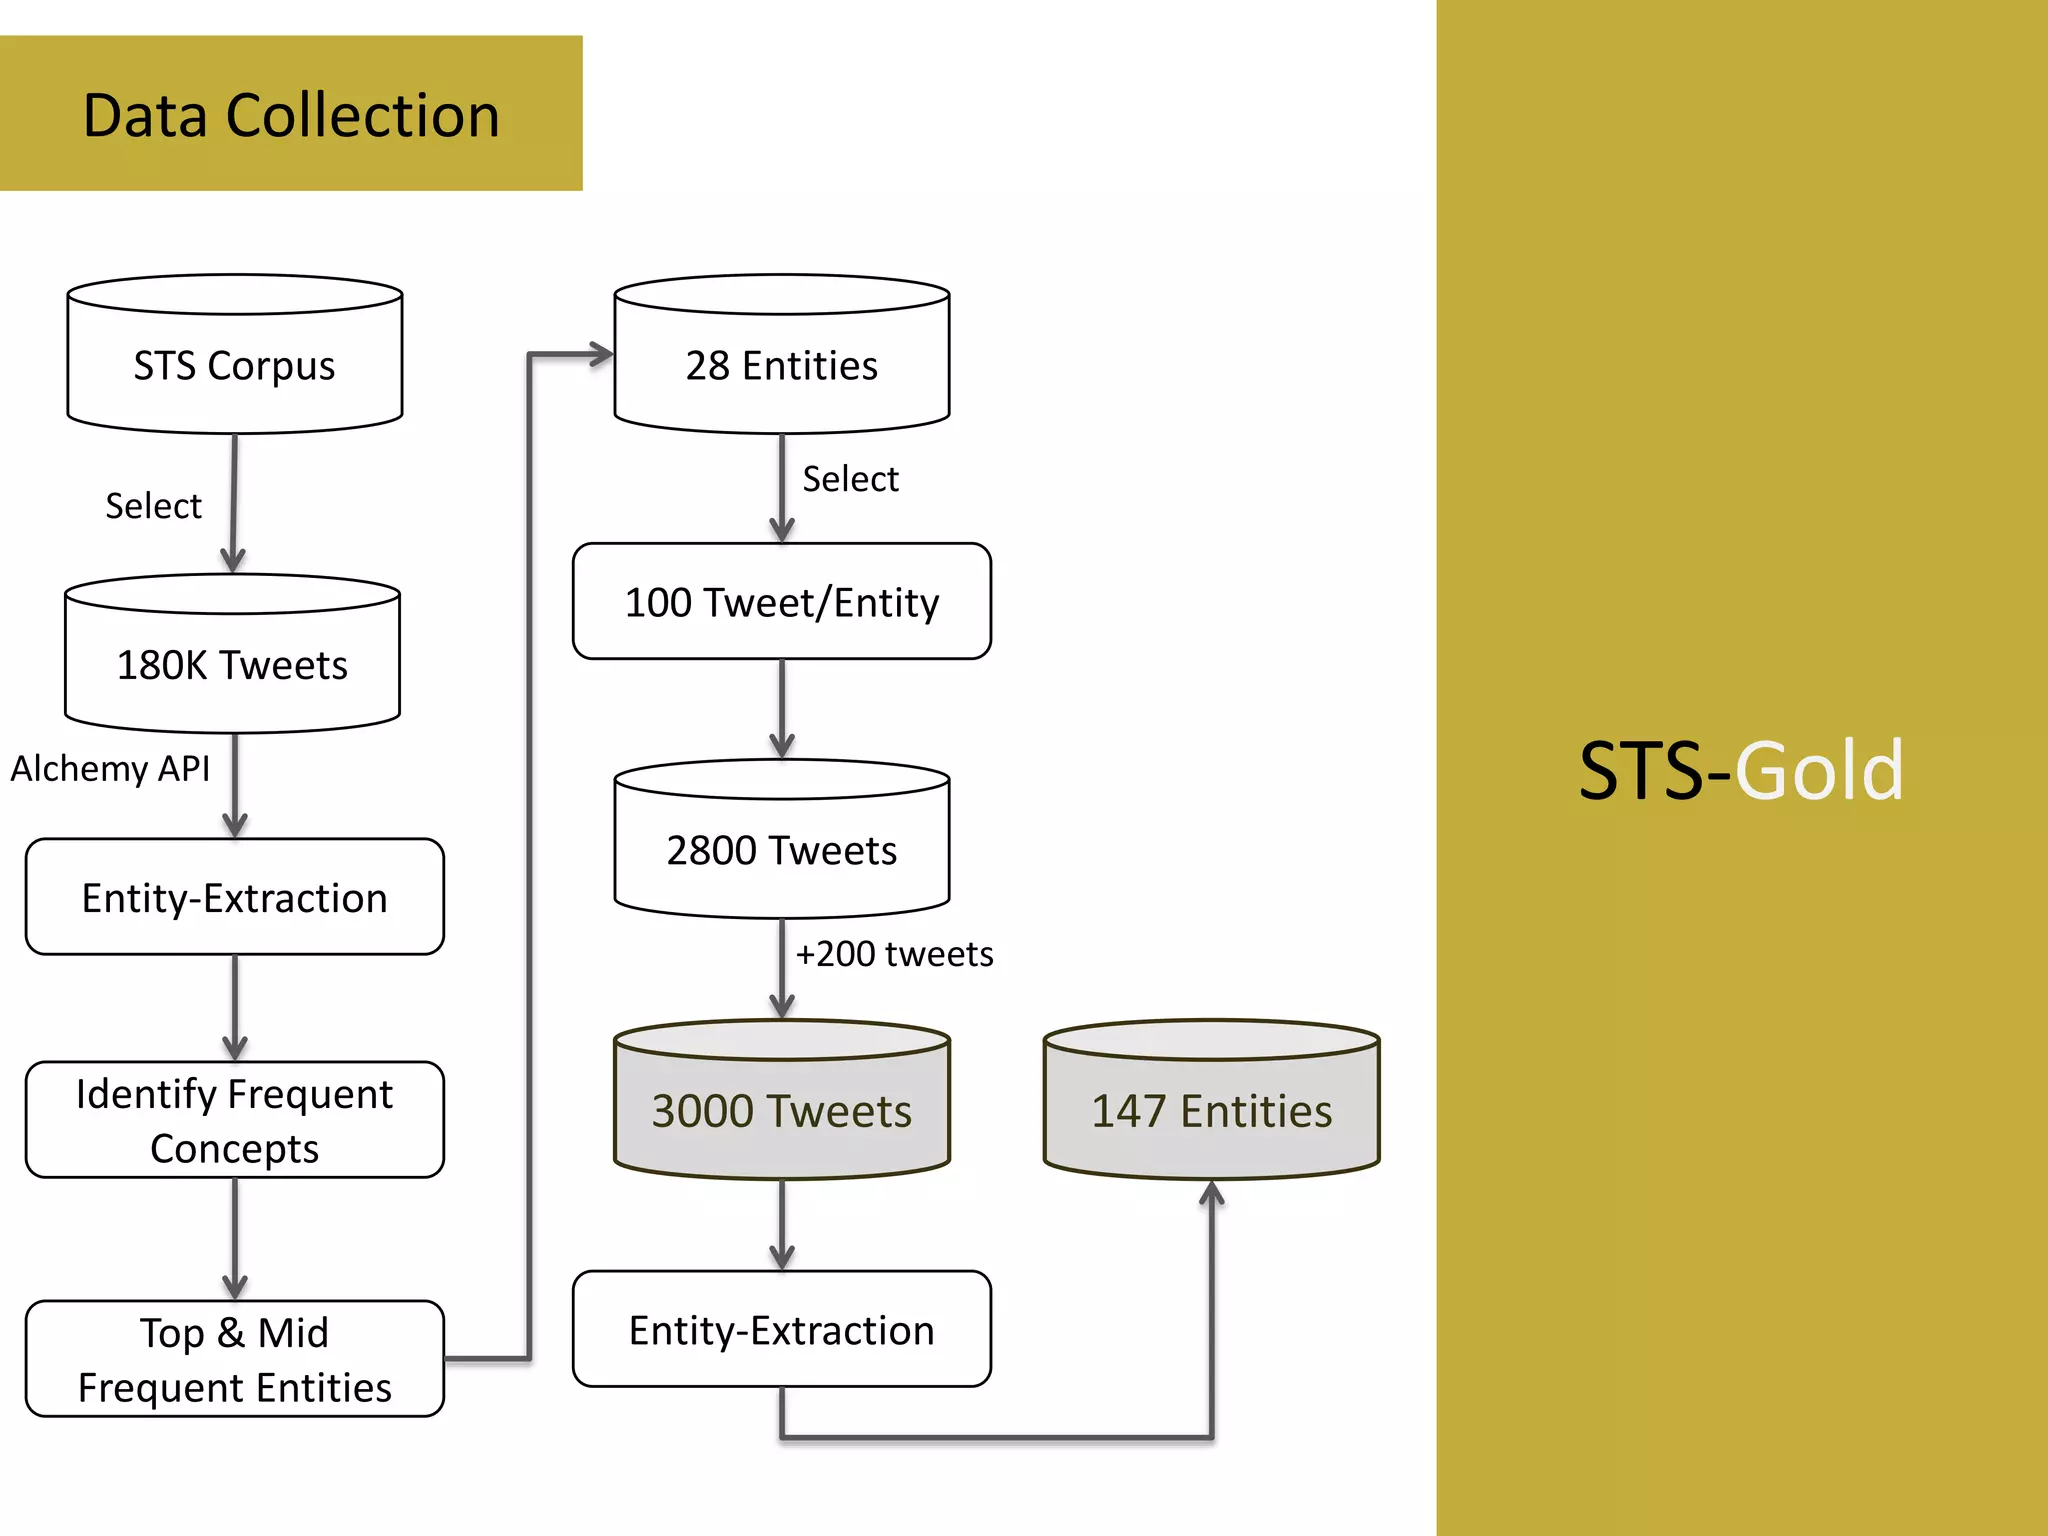
This document reviews evaluation datasets for Twitter sentiment analysis, introducing a new dataset called STS-Gold. It discusses various supervised and unsupervised sentiment analysis approaches, highlighting the limitations of existing datasets focusing primarily on tweet-level evaluations. The findings suggest that while there is a correlation between vocabulary size and tweet count, dataset sparsity negatively impacts classification performance.


![Coded Agents – with UiPath SDK + LangGraph [Virtual Hands-on Workshop]](https://cdn.slidesharecdn.com/ss_thumbnails/codedagentsdeck-251215155422-5497c599-thumbnail.jpg?width=640&height=640&fit=bounds)