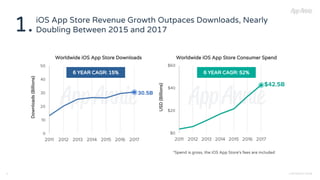
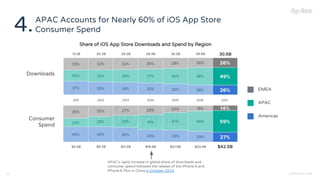
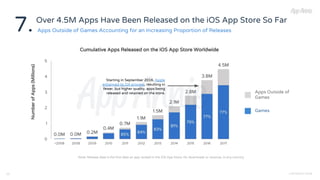
The Data Behind 10 Years
of the iOS App Store
– 2018 –
COPYRIGHT 2018
The iOS App Store
APPS THAT GENERATED MORE
THAN $1M IN CONSUMER SPEND
ON THE IOS APP STORE
Nearly
10
THOUSAND
TOTAL iOS APP STORE
CONSUMER SPEND
TOTAL NUMBER OF APPS AVAILABLE
ON THE iOS APP STORE
TOTAL iOS APP STORE
DOWNLOADS
MAY 2018JULY 2010 - DECEMBER 2017JULY 2010 - DECEMBER 2017
Over
$130
BILLION
Over
2.0
MILLION
Over
170
BILLION
SINCE JULY 2010
App Annie Is the Most Trusted Partner in the App Economy
COPYRIGHT 20183
Our data is the most cited by app industry leaders and media
Our enterprise customers span industries and the globe
The Company & Technology
Behind the Report
App Annie helps companies build better app
businesses and is used by 94 of the top 100
publishers across the globe. From competitive
benchmarking to international expansion, we
deliver the data and insights needed to succeed
in the app economy.
The information contained in this report is
informed by App Annie Intelligence, the leading
data solution for the app economy as well as our
proprietary forecast model.
To see how our app data for download, revenue,
demographic and usage estimates and ASO can
help guide your critical business decisions, sign
up for a free account today.
DISCOVER
OPPORTUNITIES
DEVELOP BETTER
STRATEGIES
OPTIMIZE USER
ACQUISITION
DRIVE DEEPER
ENGAGEMENT
ACCELERATE
REVENUE
Confidently Navigate the Entire App Lifecycle with
App Annie Intelligence
The industry’s trusted global app market data. Cutting
edge insights. One Integrated platform.
COPYRIGHT 20184
Table of Contents
10 Years, 10 Highlights of the iOS App Store 6
The Top iOS Apps of All Time 17
A Trip Through Time: The Most Popular iOS Apps by Year 24
Read Further Analysis on the App Economy 34
10 Years, 10 Highlights
of the iOS App Store
COPYRIGHT 2018
iOS App Store Revenue Growth Outpaces Downloads, Nearly
Doubling Between 2015 and 2017
7 COPYRIGHT 20187
1.
*Spend is gross, the iOS App Store's fees are included
Worldwide iOS App Store Downloads Worldwide iOS App Store Consumer Spend
Downloads(Billions)
USD(Billions)
6 YEAR CAGR: 15% 6 YEAR CAGR: 52%
The iOS App Store Generates Nearly Twice as Much Consumer
Spend as Google Play, Despite a Lower Device Install Base
8 COPYRIGHT 20188
2.
Share of Worldwide Downloads Share of Worldwide Consumer Spend
Note: Google Play is not available in China
iOS App Store Google Play iOS App Store Google Play
iPhone Users in Select Markets Have Over 100 Apps Installed and
Use Over 40 Apps Each Month
9 COPYRIGHT 20189
3.
Average Monthly Apps Installed and Used on iPhones in 2017 in Select Countries
Apps Used Apps Installed
France
Indonesia
South Korea
Japan
Brazil
Germany
China
India
Australia
United States
United Kingdom
Mexico
APAC Accounts for Nearly 60% of iOS App Store
Consumer Spend
COPYRIGHT 201810
4.
APAC's rapid increase in global share of downloads and
consumer spend followed the release of the iPhone 6 and
iPhone 6 Plus in China in October 2014
Downloads
Consumer
Spend
Share of iOS App Store Downloads and Spend by Region
Americas
APAC
EMEA
Games Account for 31% of Downloads, But 75% of Spend
11 COPYRIGHT 201811
5. iOS App Store Downloads in 2017 iOS App Store Consumer Spend in 2017
30.5B $42.5B
EMEA
7.8B
Americas
7.9B
APAC
14.8B
EMEA
$6.0B Americas
$11.3B
iPhone
6.8B
APAC
$25.2B
iPad
1.1B
Apps
4.7B
Games
2.0B
Apps
0.5B
Games
0.6B
iPhone
$8.4B
iPad
$3.0B
Apps
$3.2B
Games
$5.2B
Apps
$0.7B
Games
$2.3B
iPhone
6.7B
iPad
1.2B
Games
2.0B
Apps
4.7B
Games
0.6B
Apps
0.6B
iPhone
13.1B
iPad
1.7B
Apps
0.9B
Games
0.8B
Apps
9.7B
Games
3.4B
iPhone
$4.3B
iPad
$1.7B
Games
$2.3B
Apps
$2.0B
Games
$1.0B
Apps
$0.7B
iPhone
$22.9B
iPad
$2.3B
Apps
$0.4B
Games
$1.8B
Apps
$3.6B
Games
$19.3B
The United States Is the Largest Market by All-Time iOS App Store
Consumer Spend and Downloads
12 COPYRIGHT 2018
6.
Rank Country Downloads (Billions)
1 United States 40.1
2 China 39.9
3 Japan 9.5
4 United Kingdom 8.0
5 Russia 4.5
6 France 4.5
7 Germany 4.1
8 Canada 3.9
9 Australia 3.4
10 Italy 2.9
Top Markets by All-Time iOS App Store Downloads
Note: All-Time refers to iOS App Store downloads from July 2010 to December 2017
Rank Country USD (Billions)
1 United States $36.0
2 China $27.7
3 Japan $25.2
4 United Kingdom $5.0
5 Australia $3.3
6 Canada $3.0
7 Germany $2.6
8 France $2.3
9 South Korea $2.2
10 Taiwan $2.1
Top Markets by All-Time iOS App Store Consumer Spend
Note: All-Time refers to iOS App Store consumer spend from July 2010 to December 2017
Over 4.5M Apps Have Been Released on the iOS App Store So Far
13 COPYRIGHT 201813
7. Apps Outside of Games Accounting for an Increasing Proportion of Releases
Starting in September 2016, Apple
enhanced its QA process, resulting in
fewer, but higher quality, apps being
released and retained on the store. Apps Outside of
Games
Games
NumberofApps(Millions)
Note: Release date is the first date an app ranked in the iOS App Store, for downloads or revenue, in any country
Cumulative Apps Released on the iOS App Store Worldwide
More Apps Than Ever Are Generating Millions of Dollars on the iOS
App Store Worldwide
14 COPYRIGHT 201814
8.
$1M–$10M Spend
> $10M Spend
NumberofApps
Number of Apps With More Than $1M in Consumer Spend
5 YEAR CAGR: 30%
In-App Subscription Payments Have Allowed Apps (Excluding
Games) to Flourish on the iOS App Store
15 COPYRIGHT 201815
9.
Documents to Go Comics Pandora Radio Pandora Radio Spotify Spotify Netflix
Quickoffice Badoo LINE LINE Pandora Radio Netflix Tencent Video
NAVIGON Europe Quickoffice Zoosk Zoosk LINE LINE Tinder
WhatsApp
Messenger
WhatsApp
Messenger
Skype Skype HBO NOW Tinder iQIYI
Shazam Pandora Radio Badoo Badoo Zoosk HBO NOW Pandora Radio
Apps with in-app
subscription
payments at time of
ranking
Worldwide Consumer Spend for Apps Excluding Games on the iOS App Store
Apple revamped their subscription model in September 2016
with iOS 10. Monetization options expanded, and subscriptions
were opened to additional app categories. 50% growth in spend
from 2016 to 2017 — fastest annual growth rate since 2011
In-app
subscriptions
first introduced
in February 2011
WorldwideConsumer
SpendinAllApps
ExcludingGames
Top5AppsExcluding
GamesbyWorldwide
ConsumerSpend
There’s Plenty More to Come for the iOS App Store
16 COPYRIGHT 201816
10. By 2022, Consumer Spend in the iOS App Store Will Reach $75.7B, up 80% From 2017
5 YEAR CAGR: 12.2%
USD(Billions)
Note: Spend is gross, the iOS App Store's fees are included
Worldwide iOS App Store Consumer Spend
The Top iOS Apps of All Time
COPYRIGHT 2018
Top Games by All-Time Worldwide Downloads
COPYRIGHT 2018
Rank Game Company Company Headquarters
1 Candy Crush Saga Activision Blizzard United States
2 Subway Surfers Kiloo Denmark
3 Fruit Ninja Halfbrick Australia
4 Clash of Clans Supercell Finland
5 Honour of Kings Tencent China
6 Minion Rush Vivendi France
7 Angry Birds Rovio Finland
8 Temple Run 2 Imangi United States
9 Temple Run Imangi United States
10 Asphalt 8: Airborne Vivendi France
18
Note:
- All-Time refers to iOS App Store downloads from July 2010 to May 2018
- Analysis excludes downloads from pre-installed apps
- Company displays the current owner of the listed app. It does not include companies that have previously owned the app
Top Games by All-Time Worldwide Consumer Spend
19 COPYRIGHT 201819
Rank Game Company Company Headquarters
1 Clash of Clans Supercell Finland
2 Candy Crush Saga Activision Blizzard United States
3 Monster Strike mixi Japan
4 Puzzle & Dragons GungHo Online Entertainment Japan
5 Honour of Kings Tencent China
6 Fantasy Westward Journey NetEase China
7 Game of War - Fire Age MZ United States
8 Fate/Grand Order Sony Japan
9 Clash Royale Supercell Finland
10 Pokémon GO Niantic United States
Note:
- All-Time refers to iOS App Store consumer spend from July 2010 to May 2018
- Analysis excludes consumer spend from pre-installed apps
- Company displays the current owner of the listed app. It does not include companies that have previously owned the app
Top Apps by All-Time Worldwide Downloads
20 COPYRIGHT 201820
Rank App Company Company Headquarters
1 Facebook Facebook United States
2 Facebook Messenger Facebook United States
3 YouTube Google United States
4 Instagram Facebook United States
5 WhatsApp Messenger Facebook United States
6 Google Maps Google United States
7 Snapchat Snap United States
8 Skype Microsoft United States
9 WeChat Tencent China
10 QQ Tencent China
Note:
- All-Time refers to iOS App Store downloads from July 2010 to May 2018
- Analysis excludes downloads from pre-installed apps
- Company displays the current owner of the listed app. It does not include companies that have previously owned the app
Top Apps by All-Time Worldwide Consumer Spend
21 COPYRIGHT 201821
Rank App Company Company Headquarters
1 Netflix Netflix United States
2 Spotify Spotify Sweden
3 Pandora Radio Pandora United States
4 Tencent Video Tencent China
5 Tinder InterActiveCorp (IAC) United States
6 LINE LINE Japan
7 iQIYI Baidu China
8 HBO NOW Time Warner United States
9 Kwai(快手) OneSmile China
10 QQ Tencent China
Note:
- All-Time refers to iOS App Store consumer spend from July 2010 to May 2018
- Analysis excludes consumer spend from pre-installed apps
- Company displays the current owner of the listed app. It does not include companies that have previously owned the app
22 COPYRIGHT 201822
Rank Company Headquarters
1 Tencent China
2 Supercell Finland
3 NetEase China
4 King United Kingdom
5 MZ United States
6 mixi Japan
7 GungHo Online Entertainment Japan
8 Electronic Arts United States
9 Activision Blizzard United States
10 BANDAI NAMCO Japan
Rank Company Headquarters
1 Electronic Arts United States
2 Tencent China
3 Gameloft France
4 Rovio Finland
5 Glu United States
6 Disney United States
7 Zynga United States
8 TabTale Israel
9 Storm8 United States
10 Ubisoft France
Note:
- All-Time refers to iOS App Store downloads and consumer spend from July 2010 to May 2018
- Analysis excludes downloads and consumer spend from pre-installed apps
- In the event of a company acquisition, app performance is assigned to the acquired company prior to the acquisition date, and to the acquiree after the acquisition date
Top Companies by All-Time iOS App Store
Downloads in Games
Top Companies by All-Time iOS App Store
Consumer Spend in Games
23 COPYRIGHT 201823
Rank Company Headquarters
1 Tencent China
2 InterActiveCorp (IAC) United States
3 LINE Japan
4 Netflix United States
5 Spotify Sweden
6 Pandora United States
7 Baidu China
8 Time Warner United States
9 Microsoft United States
10 Smule United States
Rank Company Headquarters
1 Google United States
2 Facebook United States
3 Tencent China
4 Baidu China
5 Alibaba Group China
6 Microsoft United States
7 Outfit7 Cyprus
8 Amazon United States
9 InterActiveCorp (IAC) United States
10 Meitu China
Top Companies by All-Time iOS App Store
Downloads Outside of Games
Top Companies by All-Time iOS App Store
Consumer Spend Outside of Games
Note:
- All-Time refers to iOS App Store downloads and consumer spend from July 2010 to May 2018
- Analysis excludes downloads and consumer spend from pre-installed apps
- In the event of a company acquisition, app performance is assigned to the acquired company prior to the acquisition date, and to the acquiree after the acquisition date
A Trip Through Time: The Most
Popular iOS Apps by Year
COPYRIGHT 2018
1. Documents To
Go
2. Shazam
3. LogMeIn Ignition 4. Star Walk
5. NAVIGON
Europe
6. TomTom
Western Europe
7. Quickoffice 8. WhatsApp
Messenger
9. Hipstamatic 10. TomTom
Europe
1. Talking Tom Cat 2. Facebook
3. Skype 4. Windows Live
Messenger
5. Twitter 6. Google
7. Shazam 8. Google Earth
9. Bump 10. Netflix
COPYRIGHT 201825
2010
● Two years into the App Store, and at the beginning
of App Annie supplying the industry's most trusted
data, social and communication apps such as
Facebook, Skype and Twitter topped the
worldwide download charts for apps excluding
Games. Facebook has been among the top 10
most downloaded apps in every subsequent year.
● WhatsApp Messenger was a top consumer-spend-
generating app in 2010 (at the time they charged
a $0.99 upfront fee). In 2010, approximately 10%
of all app downloads on the iOS App Store were
paid. Year-to-date in 2018, less than 1% of
downloads have been paid.
● Talking Tom Cat, an Entertainment app from
Outfit 7, was the most downloaded app in 2010.
This began a decade of success for Outfit 7, and
their apps have subsequently been downloaded
more than 7 billion times globally.Note:
- Top apps excluding Games on the iOS App Store worldwide
- Analysis excludes downloads and consumer spend from pre-installed apps
- 2010 data covers July 1st to December 31st
Consumer SpendDownloads
1. Documents To Go 2. Quickoffice
3. NAVIGON Europe 4. WhatsApp
Messenger
5. Shazam 6. LogMeIn Ignition
7. TomTom Western
Europe
8. GoodReader
9. MotionX GPS Drive 10. Zinio
1. Facebook 2. Skype
3. Twitter 4. Talking Tom Cat 2
5. Instagram 6. Viber
7. Google 8. Talking Tom Cat
9. Bump 10. Emoji Free!
COPYRIGHT 201826
2011
● In 2011, Instagram entered the top 10 apps by
downloads following its release in October of the
previous year. By 2012, the year in which it was
acquired by Facebook, Instagram would become
the most downloaded app globally.
● Bump — an award winning app that allowed users
to share contacts and photos by bumping devices
together — was a top downloaded app in 2011.
Subsequently acquired by Google in 2013 and
discontinued in 2014, the team went on to make
significant contributions to Google Photos and
Android Camera.
Note:
- Top apps excluding Games on the iOS App Store worldwide
- Analysis excludes downloads and consumer spend from pre-installed apps
Consumer SpendDownloads
1. Instagram 2. YouTube
3. Skype 4. Facebook
5. Twitter 6. Chrome Browser
7. Shazam 8. Flashlight by
iHandy
9. Viber 10. eBay
1. Comics 2. Badoo
3. Quickoffice 4. WhatsApp
Messenger
5. Pandora Music 6. Documents To
Go
7. Zinio 8. LINE
9. MLB At Bat 10. Zoosk
COPYRIGHT 201827
2012
● With the release of iOS 6.0, YouTube no longer
came pre-installed on new iPhones. In 2012, a newly
released standalone version quickly became the
second most downloaded app of the year — a
powerful demonstration of mobile’s future promise
as a video streaming platform.
● Dating apps Badoo and Zoosk became top
consumer-spend-generating apps in 2012. Over the
coming years, they were joined by the likes of
Tinder, Grindr and Lovoo to make Dating one of the
most lucrative app categories.
● MLB At Bat launched in 2012 with a range of
innovative features. Subscription payments for
streamed content allowed it to quickly become a
top grossing app, and as of May 2018 it remained
the most used sports league app in the world.
Note:
- Top apps excluding Games on the iOS App Store worldwide
- Analysis excludes downloads and consumer spend from pre-installed apps
Consumer SpendDownloads
1. YouTube 2. Google Maps
3. Skype 4. Facebook
5. Instagram 6. Snapchat
7. Facebook
Messenger
8. WhatsApp
Messenger
9. Twitter 10. Vine
1. Pandora Music 2. LINE
3. Zoosk 4. Skype
5. Badoo 6. LINE PLAY
7. Comics 8. MLB At Bat
9. Grindr 10. NYTimes
COPYRIGHT 201828
2013
● In 2013, the iOS App Store generated more than
$10 billion in consumer spend for the first time.
● Pandora Music hit the number 1 spot for
consumer spend in 2013. Pandora blazed a trail
for a music industry that has increasingly adopted
the mobile platform. In 2017, apps in the Music
category on the iOS App Store alone generated
more than $1 billion in worldwide consumer spend.
● Snapchat began its meteoric rise, appearing in the
top 10 for the first time since its 2011 release.
Note:
- Top apps excluding Games on the iOS App Store worldwide
- Analysis excludes downloads and consumer spend from pre-installed apps
Consumer SpendDownloads
COPYRIGHT 201829
2014
● Facebook Messenger immediately leapt to the
number 1 spot by downloads following its
unbundling from the main Facebook app.
Facebook Messenger and Facebook remained
in the number 1 and 2 spots, respectively, until
2017.
● Apple Pay was made available for the first time
in 2014. Within 3 days of the launch, 1 million
credit cards were registered with Apple Pay.
Mobile devices continue to grow in importance
as a personal financial hub. Worldwide in 2017,
there were over 1.4 billion app downloads from
the Finance category on the iOS App Store.
Note:
- Top apps excluding Games on the iOS App Store worldwide
- Analysis excludes downloads and consumer spend from pre-installed apps
Consumer SpendDownloads
1. Pandora Music 2. LINE
3. Zoosk 4. Skype
5. Badoo 6. LINE PLAY
7. Spotify 8. Grindr
9. Match.com 10. Deezer
1. Facebook
Messenger
2. Facebook
3. YouTube 4. Instagram
5. WhatsApp
Messenger
6. Google Maps
7. Skype 8. Snapchat
9. Google 10. Twitter
COPYRIGHT 201830
2015
● In 2015, China overtook the United States to
become the largest market by iOS App Store
downloads.
● Spotify, Hulu, Pandora Music and HBO NOW all
ranked in the top 10 apps by consumer spend.
This was the strongest showing yet for
entertainment companies and demonstrated just
how lucrative the iOS App Store had become as a
streaming platform.
Note:
- Top apps excluding Games on the iOS App Store worldwide
- Analysis excludes downloads and consumer spend from pre-installed apps
Consumer SpendDownloads
1. Facebook
Messenger
2. Facebook
3. YouTube 4. WhatsApp
Messenger
5. Instagram 6. Snapchat
7. Google Maps 8. QQ
9. Skype 10. WeChat
1. Spotify 2. Pandora Music
3. LINE 4. HBO NOW
5. Zoosk 6. Match.com
7. Skype 8. Tinder
9. Sing! by Smule 10. Hulu
COPYRIGHT 201831
2016
● In 2016, China overtook the US to become the
largest market by App Store consumer spend.
China began its reign as the largest iOS App Store
market by both downloads and consumer spend.
● Apple revamped their subscription model in
September 2016. The iOS App Store saw 50%
growth in consumer spend from 2016 to 2017 —
the fastest annual growth rate since 2011. Apps
had become the epicenter for organizing the
services we use.
● Chinese streaming giant iQIYI broke into the top
10 apps by spend for the first time in 2016. So far
in 2018, iQIYI remains one of the largest streaming
services by consumer spend in the world — driven
almost entirely by its performance in China.
Note:
- Top apps excluding Games on the iOS App Store worldwide
- Analysis excludes downloads and consumer spend from pre-installed apps
Consumer SpendDownloads
1. Spotify 2. Netflix
3. LINE 4. Tinder
5. HBO NOW 6. Pandora Music
7. iQIYI 8. Hulu
9. Inke 10. Sing! by
Smule
1. Facebook
Messenger
2. Facebook
3. YouTube 4. WhatsApp
Messenger
5. Snapchat 6. Instagram
7. Uber 8. Google Maps
9. WeChat 10. QQ
``
COPYRIGHT 201832
2017
● China dominated the 2017 charts. Nearly half of
top apps were owned by China-headquartered
companies.
● In June 2017, Apple celebrated the 10 year
anniversary of the iPhone and released the iPhone
X in November.
● Apple also launched a significant App Store
redesign in September 2017. iOS 11 aimed to
make app discovery easier and more compelling
for users.
Note:
- Top apps excluding Games on the iOS App Store worldwide
- Analysis excludes downloads and consumer spend from pre-installed apps
Consumer SpendDownloads
1. YouTube 2. Facebook
Messenger
3. Facebook 4. WeChat
5. Instagram 6. WhatsApp
Messenger
7. Google Maps 8. QQ
9. Taobao 10. Tencent Video
1. Netflix 2. Tencent Video
3. Tinder 4. iQIYI
5. Pandora Music 6. Spotify
7. Kwai(快手) 8. QQ
9. HBO NOW 10. LINE
COPYRIGHT 201833
2018 ● Year-to-date in 2018, Tik Tok, a popular short
form video platform and social network from
China, has leapt to the number 1 spot by global
downloads. Tik Tok allows users to create and
share their own short music videos and recently
announced it had more than 150 million daily
users in mainland China alone.
● Netflix sustained its number 1 spot for iOS App
Store consumer spend to start off 2018, in part
driven by its continued international expansion.
● Each year has brought new iPhones, new OS
updates and new in-demand apps. What remains
constant in 2018 is mobile being at the center of
our lives – bringing us entertainment, connecting
us to work and friends, facilitating romance,
playing our favorite music and navigating us to
new places. The iOS App Store has brought
unparalleled digital access to millions of people
around the world and will continue to enhance our
lives as we head into its 11th year and beyond.
Note:
- Top apps excluding Games on the iOS App Store worldwide
- 2018 data covers January 1st to May 31st
- Analysis excludes downloads and consumer spend from pre-installed apps
Consumer SpendDownloads
1. Netflix 2. Tencent Video
3. Tinder 4. iQIYI
5. Kwai(快手) 6. Pandora Music
7. YouTube 8. Youku
9. QQ 10. HBO NOW
1. Tik Tok 2. YouTube
3. Facebook
Messenger
4. Instagram
5. Facebook 6. WhatsApp
Messenger
7. WeChat 8. Google Maps
9. Snapchat 10. Gmail
● The 2017-2022 App Economy Forecast: 6 Billion
Devices, $157 Billion in Spend & More
● 2017 Retrospective: A Monumental Year for the App
Economy
● Top Predictions for the App Economy in 2018
● Why Your Mobile Strategy Needs an App
● New App Usage Report: How Many Apps Do Users
Install a Month?
● Metrics That Matter for Product Managers: The
Fundamentals
APP ANNIE
Grow your business with
the leader in app market
data and analytics
● App Annie Intelligence
App Annie Intelligence provides accurate
app market data and insights for millions
of apps across the globe.
Sign up for free now
●
● App Annie Connect
App Annie Connect gives you a full view
of your app performance. Consolidate all
your app store, usage and advertising
data in one unified dashboard.
Sign up for free now
COPYRIGHT 201834
Read Further Analysis on the App
Economy
About App Annie
App Annie delivers the most trusted app market data and insights for your business to
succeed in the global app economy. Over 1 million registered users rely on App Annie to
better understand the app market, their businesses and the opportunities around them. The
company is headquartered in San Francisco with 450 employees across 15 global offices.
App Annie has received $157 million in financing, including from investors such as Sequoia
Capital, Institutional Venture Partners, IDG Capital Partners, e.ventures, Greenspring
Associates, and Greycroft Partners.
For more information, please visit appannie.com, check out our Blog and follow us on
Twitter (@AppAnnie). To find out more about our offerings, visit our overview of the App
Annie Platform. For the most current monthly rankings of apps and publishers, check out
the App Annie Index. Report methodology and updates are available here.
COPYRIGHT 201835

Estadísticas App Store

  • 1.
    The Data Behind10 Years of the iOS App Store – 2018 –
  • 2.
    COPYRIGHT 2018 The iOSApp Store APPS THAT GENERATED MORE THAN $1M IN CONSUMER SPEND ON THE IOS APP STORE Nearly 10 THOUSAND TOTAL iOS APP STORE CONSUMER SPEND TOTAL NUMBER OF APPS AVAILABLE ON THE iOS APP STORE TOTAL iOS APP STORE DOWNLOADS MAY 2018JULY 2010 - DECEMBER 2017JULY 2010 - DECEMBER 2017 Over $130 BILLION Over 2.0 MILLION Over 170 BILLION SINCE JULY 2010
  • 3.
    App Annie Isthe Most Trusted Partner in the App Economy COPYRIGHT 20183 Our data is the most cited by app industry leaders and media Our enterprise customers span industries and the globe
  • 4.
    The Company &Technology Behind the Report App Annie helps companies build better app businesses and is used by 94 of the top 100 publishers across the globe. From competitive benchmarking to international expansion, we deliver the data and insights needed to succeed in the app economy. The information contained in this report is informed by App Annie Intelligence, the leading data solution for the app economy as well as our proprietary forecast model. To see how our app data for download, revenue, demographic and usage estimates and ASO can help guide your critical business decisions, sign up for a free account today. DISCOVER OPPORTUNITIES DEVELOP BETTER STRATEGIES OPTIMIZE USER ACQUISITION DRIVE DEEPER ENGAGEMENT ACCELERATE REVENUE Confidently Navigate the Entire App Lifecycle with App Annie Intelligence The industry’s trusted global app market data. Cutting edge insights. One Integrated platform. COPYRIGHT 20184
  • 5.
    Table of Contents 10Years, 10 Highlights of the iOS App Store 6 The Top iOS Apps of All Time 17 A Trip Through Time: The Most Popular iOS Apps by Year 24 Read Further Analysis on the App Economy 34
  • 6.
    10 Years, 10Highlights of the iOS App Store COPYRIGHT 2018
  • 7.
    iOS App StoreRevenue Growth Outpaces Downloads, Nearly Doubling Between 2015 and 2017 7 COPYRIGHT 20187 1. *Spend is gross, the iOS App Store's fees are included Worldwide iOS App Store Downloads Worldwide iOS App Store Consumer Spend Downloads(Billions) USD(Billions) 6 YEAR CAGR: 15% 6 YEAR CAGR: 52%
  • 8.
    The iOS AppStore Generates Nearly Twice as Much Consumer Spend as Google Play, Despite a Lower Device Install Base 8 COPYRIGHT 20188 2. Share of Worldwide Downloads Share of Worldwide Consumer Spend Note: Google Play is not available in China iOS App Store Google Play iOS App Store Google Play
  • 9.
    iPhone Users inSelect Markets Have Over 100 Apps Installed and Use Over 40 Apps Each Month 9 COPYRIGHT 20189 3. Average Monthly Apps Installed and Used on iPhones in 2017 in Select Countries Apps Used Apps Installed France Indonesia South Korea Japan Brazil Germany China India Australia United States United Kingdom Mexico
  • 10.
    APAC Accounts forNearly 60% of iOS App Store Consumer Spend COPYRIGHT 201810 4. APAC's rapid increase in global share of downloads and consumer spend followed the release of the iPhone 6 and iPhone 6 Plus in China in October 2014 Downloads Consumer Spend Share of iOS App Store Downloads and Spend by Region Americas APAC EMEA
  • 11.
    Games Account for31% of Downloads, But 75% of Spend 11 COPYRIGHT 201811 5. iOS App Store Downloads in 2017 iOS App Store Consumer Spend in 2017 30.5B $42.5B EMEA 7.8B Americas 7.9B APAC 14.8B EMEA $6.0B Americas $11.3B iPhone 6.8B APAC $25.2B iPad 1.1B Apps 4.7B Games 2.0B Apps 0.5B Games 0.6B iPhone $8.4B iPad $3.0B Apps $3.2B Games $5.2B Apps $0.7B Games $2.3B iPhone 6.7B iPad 1.2B Games 2.0B Apps 4.7B Games 0.6B Apps 0.6B iPhone 13.1B iPad 1.7B Apps 0.9B Games 0.8B Apps 9.7B Games 3.4B iPhone $4.3B iPad $1.7B Games $2.3B Apps $2.0B Games $1.0B Apps $0.7B iPhone $22.9B iPad $2.3B Apps $0.4B Games $1.8B Apps $3.6B Games $19.3B
  • 12.
    The United StatesIs the Largest Market by All-Time iOS App Store Consumer Spend and Downloads 12 COPYRIGHT 2018 6. Rank Country Downloads (Billions) 1 United States 40.1 2 China 39.9 3 Japan 9.5 4 United Kingdom 8.0 5 Russia 4.5 6 France 4.5 7 Germany 4.1 8 Canada 3.9 9 Australia 3.4 10 Italy 2.9 Top Markets by All-Time iOS App Store Downloads Note: All-Time refers to iOS App Store downloads from July 2010 to December 2017 Rank Country USD (Billions) 1 United States $36.0 2 China $27.7 3 Japan $25.2 4 United Kingdom $5.0 5 Australia $3.3 6 Canada $3.0 7 Germany $2.6 8 France $2.3 9 South Korea $2.2 10 Taiwan $2.1 Top Markets by All-Time iOS App Store Consumer Spend Note: All-Time refers to iOS App Store consumer spend from July 2010 to December 2017
  • 13.
    Over 4.5M AppsHave Been Released on the iOS App Store So Far 13 COPYRIGHT 201813 7. Apps Outside of Games Accounting for an Increasing Proportion of Releases Starting in September 2016, Apple enhanced its QA process, resulting in fewer, but higher quality, apps being released and retained on the store. Apps Outside of Games Games NumberofApps(Millions) Note: Release date is the first date an app ranked in the iOS App Store, for downloads or revenue, in any country Cumulative Apps Released on the iOS App Store Worldwide
  • 14.
    More Apps ThanEver Are Generating Millions of Dollars on the iOS App Store Worldwide 14 COPYRIGHT 201814 8. $1M–$10M Spend > $10M Spend NumberofApps Number of Apps With More Than $1M in Consumer Spend 5 YEAR CAGR: 30%
  • 15.
    In-App Subscription PaymentsHave Allowed Apps (Excluding Games) to Flourish on the iOS App Store 15 COPYRIGHT 201815 9. Documents to Go Comics Pandora Radio Pandora Radio Spotify Spotify Netflix Quickoffice Badoo LINE LINE Pandora Radio Netflix Tencent Video NAVIGON Europe Quickoffice Zoosk Zoosk LINE LINE Tinder WhatsApp Messenger WhatsApp Messenger Skype Skype HBO NOW Tinder iQIYI Shazam Pandora Radio Badoo Badoo Zoosk HBO NOW Pandora Radio Apps with in-app subscription payments at time of ranking Worldwide Consumer Spend for Apps Excluding Games on the iOS App Store Apple revamped their subscription model in September 2016 with iOS 10. Monetization options expanded, and subscriptions were opened to additional app categories. 50% growth in spend from 2016 to 2017 — fastest annual growth rate since 2011 In-app subscriptions first introduced in February 2011 WorldwideConsumer SpendinAllApps ExcludingGames Top5AppsExcluding GamesbyWorldwide ConsumerSpend
  • 16.
    There’s Plenty Moreto Come for the iOS App Store 16 COPYRIGHT 201816 10. By 2022, Consumer Spend in the iOS App Store Will Reach $75.7B, up 80% From 2017 5 YEAR CAGR: 12.2% USD(Billions) Note: Spend is gross, the iOS App Store's fees are included Worldwide iOS App Store Consumer Spend
  • 17.
    The Top iOSApps of All Time COPYRIGHT 2018
  • 18.
    Top Games byAll-Time Worldwide Downloads COPYRIGHT 2018 Rank Game Company Company Headquarters 1 Candy Crush Saga Activision Blizzard United States 2 Subway Surfers Kiloo Denmark 3 Fruit Ninja Halfbrick Australia 4 Clash of Clans Supercell Finland 5 Honour of Kings Tencent China 6 Minion Rush Vivendi France 7 Angry Birds Rovio Finland 8 Temple Run 2 Imangi United States 9 Temple Run Imangi United States 10 Asphalt 8: Airborne Vivendi France 18 Note: - All-Time refers to iOS App Store downloads from July 2010 to May 2018 - Analysis excludes downloads from pre-installed apps - Company displays the current owner of the listed app. It does not include companies that have previously owned the app
  • 19.
    Top Games byAll-Time Worldwide Consumer Spend 19 COPYRIGHT 201819 Rank Game Company Company Headquarters 1 Clash of Clans Supercell Finland 2 Candy Crush Saga Activision Blizzard United States 3 Monster Strike mixi Japan 4 Puzzle & Dragons GungHo Online Entertainment Japan 5 Honour of Kings Tencent China 6 Fantasy Westward Journey NetEase China 7 Game of War - Fire Age MZ United States 8 Fate/Grand Order Sony Japan 9 Clash Royale Supercell Finland 10 Pokémon GO Niantic United States Note: - All-Time refers to iOS App Store consumer spend from July 2010 to May 2018 - Analysis excludes consumer spend from pre-installed apps - Company displays the current owner of the listed app. It does not include companies that have previously owned the app
  • 20.
    Top Apps byAll-Time Worldwide Downloads 20 COPYRIGHT 201820 Rank App Company Company Headquarters 1 Facebook Facebook United States 2 Facebook Messenger Facebook United States 3 YouTube Google United States 4 Instagram Facebook United States 5 WhatsApp Messenger Facebook United States 6 Google Maps Google United States 7 Snapchat Snap United States 8 Skype Microsoft United States 9 WeChat Tencent China 10 QQ Tencent China Note: - All-Time refers to iOS App Store downloads from July 2010 to May 2018 - Analysis excludes downloads from pre-installed apps - Company displays the current owner of the listed app. It does not include companies that have previously owned the app
  • 21.
    Top Apps byAll-Time Worldwide Consumer Spend 21 COPYRIGHT 201821 Rank App Company Company Headquarters 1 Netflix Netflix United States 2 Spotify Spotify Sweden 3 Pandora Radio Pandora United States 4 Tencent Video Tencent China 5 Tinder InterActiveCorp (IAC) United States 6 LINE LINE Japan 7 iQIYI Baidu China 8 HBO NOW Time Warner United States 9 Kwai(快手) OneSmile China 10 QQ Tencent China Note: - All-Time refers to iOS App Store consumer spend from July 2010 to May 2018 - Analysis excludes consumer spend from pre-installed apps - Company displays the current owner of the listed app. It does not include companies that have previously owned the app
  • 22.
    22 COPYRIGHT 201822 RankCompany Headquarters 1 Tencent China 2 Supercell Finland 3 NetEase China 4 King United Kingdom 5 MZ United States 6 mixi Japan 7 GungHo Online Entertainment Japan 8 Electronic Arts United States 9 Activision Blizzard United States 10 BANDAI NAMCO Japan Rank Company Headquarters 1 Electronic Arts United States 2 Tencent China 3 Gameloft France 4 Rovio Finland 5 Glu United States 6 Disney United States 7 Zynga United States 8 TabTale Israel 9 Storm8 United States 10 Ubisoft France Note: - All-Time refers to iOS App Store downloads and consumer spend from July 2010 to May 2018 - Analysis excludes downloads and consumer spend from pre-installed apps - In the event of a company acquisition, app performance is assigned to the acquired company prior to the acquisition date, and to the acquiree after the acquisition date Top Companies by All-Time iOS App Store Downloads in Games Top Companies by All-Time iOS App Store Consumer Spend in Games
  • 23.
    23 COPYRIGHT 201823 RankCompany Headquarters 1 Tencent China 2 InterActiveCorp (IAC) United States 3 LINE Japan 4 Netflix United States 5 Spotify Sweden 6 Pandora United States 7 Baidu China 8 Time Warner United States 9 Microsoft United States 10 Smule United States Rank Company Headquarters 1 Google United States 2 Facebook United States 3 Tencent China 4 Baidu China 5 Alibaba Group China 6 Microsoft United States 7 Outfit7 Cyprus 8 Amazon United States 9 InterActiveCorp (IAC) United States 10 Meitu China Top Companies by All-Time iOS App Store Downloads Outside of Games Top Companies by All-Time iOS App Store Consumer Spend Outside of Games Note: - All-Time refers to iOS App Store downloads and consumer spend from July 2010 to May 2018 - Analysis excludes downloads and consumer spend from pre-installed apps - In the event of a company acquisition, app performance is assigned to the acquired company prior to the acquisition date, and to the acquiree after the acquisition date
  • 24.
    A Trip ThroughTime: The Most Popular iOS Apps by Year COPYRIGHT 2018
  • 25.
    1. Documents To Go 2.Shazam 3. LogMeIn Ignition 4. Star Walk 5. NAVIGON Europe 6. TomTom Western Europe 7. Quickoffice 8. WhatsApp Messenger 9. Hipstamatic 10. TomTom Europe 1. Talking Tom Cat 2. Facebook 3. Skype 4. Windows Live Messenger 5. Twitter 6. Google 7. Shazam 8. Google Earth 9. Bump 10. Netflix COPYRIGHT 201825 2010 ● Two years into the App Store, and at the beginning of App Annie supplying the industry's most trusted data, social and communication apps such as Facebook, Skype and Twitter topped the worldwide download charts for apps excluding Games. Facebook has been among the top 10 most downloaded apps in every subsequent year. ● WhatsApp Messenger was a top consumer-spend- generating app in 2010 (at the time they charged a $0.99 upfront fee). In 2010, approximately 10% of all app downloads on the iOS App Store were paid. Year-to-date in 2018, less than 1% of downloads have been paid. ● Talking Tom Cat, an Entertainment app from Outfit 7, was the most downloaded app in 2010. This began a decade of success for Outfit 7, and their apps have subsequently been downloaded more than 7 billion times globally.Note: - Top apps excluding Games on the iOS App Store worldwide - Analysis excludes downloads and consumer spend from pre-installed apps - 2010 data covers July 1st to December 31st Consumer SpendDownloads
  • 26.
    1. Documents ToGo 2. Quickoffice 3. NAVIGON Europe 4. WhatsApp Messenger 5. Shazam 6. LogMeIn Ignition 7. TomTom Western Europe 8. GoodReader 9. MotionX GPS Drive 10. Zinio 1. Facebook 2. Skype 3. Twitter 4. Talking Tom Cat 2 5. Instagram 6. Viber 7. Google 8. Talking Tom Cat 9. Bump 10. Emoji Free! COPYRIGHT 201826 2011 ● In 2011, Instagram entered the top 10 apps by downloads following its release in October of the previous year. By 2012, the year in which it was acquired by Facebook, Instagram would become the most downloaded app globally. ● Bump — an award winning app that allowed users to share contacts and photos by bumping devices together — was a top downloaded app in 2011. Subsequently acquired by Google in 2013 and discontinued in 2014, the team went on to make significant contributions to Google Photos and Android Camera. Note: - Top apps excluding Games on the iOS App Store worldwide - Analysis excludes downloads and consumer spend from pre-installed apps Consumer SpendDownloads
  • 27.
    1. Instagram 2.YouTube 3. Skype 4. Facebook 5. Twitter 6. Chrome Browser 7. Shazam 8. Flashlight by iHandy 9. Viber 10. eBay 1. Comics 2. Badoo 3. Quickoffice 4. WhatsApp Messenger 5. Pandora Music 6. Documents To Go 7. Zinio 8. LINE 9. MLB At Bat 10. Zoosk COPYRIGHT 201827 2012 ● With the release of iOS 6.0, YouTube no longer came pre-installed on new iPhones. In 2012, a newly released standalone version quickly became the second most downloaded app of the year — a powerful demonstration of mobile’s future promise as a video streaming platform. ● Dating apps Badoo and Zoosk became top consumer-spend-generating apps in 2012. Over the coming years, they were joined by the likes of Tinder, Grindr and Lovoo to make Dating one of the most lucrative app categories. ● MLB At Bat launched in 2012 with a range of innovative features. Subscription payments for streamed content allowed it to quickly become a top grossing app, and as of May 2018 it remained the most used sports league app in the world. Note: - Top apps excluding Games on the iOS App Store worldwide - Analysis excludes downloads and consumer spend from pre-installed apps Consumer SpendDownloads
  • 28.
    1. YouTube 2.Google Maps 3. Skype 4. Facebook 5. Instagram 6. Snapchat 7. Facebook Messenger 8. WhatsApp Messenger 9. Twitter 10. Vine 1. Pandora Music 2. LINE 3. Zoosk 4. Skype 5. Badoo 6. LINE PLAY 7. Comics 8. MLB At Bat 9. Grindr 10. NYTimes COPYRIGHT 201828 2013 ● In 2013, the iOS App Store generated more than $10 billion in consumer spend for the first time. ● Pandora Music hit the number 1 spot for consumer spend in 2013. Pandora blazed a trail for a music industry that has increasingly adopted the mobile platform. In 2017, apps in the Music category on the iOS App Store alone generated more than $1 billion in worldwide consumer spend. ● Snapchat began its meteoric rise, appearing in the top 10 for the first time since its 2011 release. Note: - Top apps excluding Games on the iOS App Store worldwide - Analysis excludes downloads and consumer spend from pre-installed apps Consumer SpendDownloads
  • 29.
    COPYRIGHT 201829 2014 ● FacebookMessenger immediately leapt to the number 1 spot by downloads following its unbundling from the main Facebook app. Facebook Messenger and Facebook remained in the number 1 and 2 spots, respectively, until 2017. ● Apple Pay was made available for the first time in 2014. Within 3 days of the launch, 1 million credit cards were registered with Apple Pay. Mobile devices continue to grow in importance as a personal financial hub. Worldwide in 2017, there were over 1.4 billion app downloads from the Finance category on the iOS App Store. Note: - Top apps excluding Games on the iOS App Store worldwide - Analysis excludes downloads and consumer spend from pre-installed apps Consumer SpendDownloads 1. Pandora Music 2. LINE 3. Zoosk 4. Skype 5. Badoo 6. LINE PLAY 7. Spotify 8. Grindr 9. Match.com 10. Deezer 1. Facebook Messenger 2. Facebook 3. YouTube 4. Instagram 5. WhatsApp Messenger 6. Google Maps 7. Skype 8. Snapchat 9. Google 10. Twitter
  • 30.
    COPYRIGHT 201830 2015 ● In2015, China overtook the United States to become the largest market by iOS App Store downloads. ● Spotify, Hulu, Pandora Music and HBO NOW all ranked in the top 10 apps by consumer spend. This was the strongest showing yet for entertainment companies and demonstrated just how lucrative the iOS App Store had become as a streaming platform. Note: - Top apps excluding Games on the iOS App Store worldwide - Analysis excludes downloads and consumer spend from pre-installed apps Consumer SpendDownloads 1. Facebook Messenger 2. Facebook 3. YouTube 4. WhatsApp Messenger 5. Instagram 6. Snapchat 7. Google Maps 8. QQ 9. Skype 10. WeChat 1. Spotify 2. Pandora Music 3. LINE 4. HBO NOW 5. Zoosk 6. Match.com 7. Skype 8. Tinder 9. Sing! by Smule 10. Hulu
  • 31.
    COPYRIGHT 201831 2016 ● In2016, China overtook the US to become the largest market by App Store consumer spend. China began its reign as the largest iOS App Store market by both downloads and consumer spend. ● Apple revamped their subscription model in September 2016. The iOS App Store saw 50% growth in consumer spend from 2016 to 2017 — the fastest annual growth rate since 2011. Apps had become the epicenter for organizing the services we use. ● Chinese streaming giant iQIYI broke into the top 10 apps by spend for the first time in 2016. So far in 2018, iQIYI remains one of the largest streaming services by consumer spend in the world — driven almost entirely by its performance in China. Note: - Top apps excluding Games on the iOS App Store worldwide - Analysis excludes downloads and consumer spend from pre-installed apps Consumer SpendDownloads 1. Spotify 2. Netflix 3. LINE 4. Tinder 5. HBO NOW 6. Pandora Music 7. iQIYI 8. Hulu 9. Inke 10. Sing! by Smule 1. Facebook Messenger 2. Facebook 3. YouTube 4. WhatsApp Messenger 5. Snapchat 6. Instagram 7. Uber 8. Google Maps 9. WeChat 10. QQ
  • 32.
    `` COPYRIGHT 201832 2017 ● Chinadominated the 2017 charts. Nearly half of top apps were owned by China-headquartered companies. ● In June 2017, Apple celebrated the 10 year anniversary of the iPhone and released the iPhone X in November. ● Apple also launched a significant App Store redesign in September 2017. iOS 11 aimed to make app discovery easier and more compelling for users. Note: - Top apps excluding Games on the iOS App Store worldwide - Analysis excludes downloads and consumer spend from pre-installed apps Consumer SpendDownloads 1. YouTube 2. Facebook Messenger 3. Facebook 4. WeChat 5. Instagram 6. WhatsApp Messenger 7. Google Maps 8. QQ 9. Taobao 10. Tencent Video 1. Netflix 2. Tencent Video 3. Tinder 4. iQIYI 5. Pandora Music 6. Spotify 7. Kwai(快手) 8. QQ 9. HBO NOW 10. LINE
  • 33.
    COPYRIGHT 201833 2018 ●Year-to-date in 2018, Tik Tok, a popular short form video platform and social network from China, has leapt to the number 1 spot by global downloads. Tik Tok allows users to create and share their own short music videos and recently announced it had more than 150 million daily users in mainland China alone. ● Netflix sustained its number 1 spot for iOS App Store consumer spend to start off 2018, in part driven by its continued international expansion. ● Each year has brought new iPhones, new OS updates and new in-demand apps. What remains constant in 2018 is mobile being at the center of our lives – bringing us entertainment, connecting us to work and friends, facilitating romance, playing our favorite music and navigating us to new places. The iOS App Store has brought unparalleled digital access to millions of people around the world and will continue to enhance our lives as we head into its 11th year and beyond. Note: - Top apps excluding Games on the iOS App Store worldwide - 2018 data covers January 1st to May 31st - Analysis excludes downloads and consumer spend from pre-installed apps Consumer SpendDownloads 1. Netflix 2. Tencent Video 3. Tinder 4. iQIYI 5. Kwai(快手) 6. Pandora Music 7. YouTube 8. Youku 9. QQ 10. HBO NOW 1. Tik Tok 2. YouTube 3. Facebook Messenger 4. Instagram 5. Facebook 6. WhatsApp Messenger 7. WeChat 8. Google Maps 9. Snapchat 10. Gmail
  • 34.
    ● The 2017-2022App Economy Forecast: 6 Billion Devices, $157 Billion in Spend & More ● 2017 Retrospective: A Monumental Year for the App Economy ● Top Predictions for the App Economy in 2018 ● Why Your Mobile Strategy Needs an App ● New App Usage Report: How Many Apps Do Users Install a Month? ● Metrics That Matter for Product Managers: The Fundamentals APP ANNIE Grow your business with the leader in app market data and analytics ● App Annie Intelligence App Annie Intelligence provides accurate app market data and insights for millions of apps across the globe. Sign up for free now ● ● App Annie Connect App Annie Connect gives you a full view of your app performance. Consolidate all your app store, usage and advertising data in one unified dashboard. Sign up for free now COPYRIGHT 201834 Read Further Analysis on the App Economy
  • 35.
    About App Annie AppAnnie delivers the most trusted app market data and insights for your business to succeed in the global app economy. Over 1 million registered users rely on App Annie to better understand the app market, their businesses and the opportunities around them. The company is headquartered in San Francisco with 450 employees across 15 global offices. App Annie has received $157 million in financing, including from investors such as Sequoia Capital, Institutional Venture Partners, IDG Capital Partners, e.ventures, Greenspring Associates, and Greycroft Partners. For more information, please visit appannie.com, check out our Blog and follow us on Twitter (@AppAnnie). To find out more about our offerings, visit our overview of the App Annie Platform. For the most current monthly rankings of apps and publishers, check out the App Annie Index. Report methodology and updates are available here. COPYRIGHT 201835