Essay 1 - Economic Inequality of Aboriginal Peoples In Canada
1. 1
ECONOMICINEQUALITYOF ABORIGINAL PEOPLESIN CANADA
MARCH 24, 15
DIANECOLLINS
“Poverty is not an accident. Like slavery and apartheid, it is man-
made and can be removed by the actions of human beings.“ – Nelson
Mandela
Mandela - a pragmatist or an idealist? Looking at the definition of poverty & it’s risk
factors, defining the Aboriginal demographic and investigating the income gap between
Aboriginals and the rest of Canada should answer the question - what part does
Government policy play in poverty?
POVERTY & RISK FACTORS
Poverty brings to mind families who are unable to meet the basic needs of living.
Families that struggle to balance precariously the limited income they have to pay for
heat, light and shelter against food, clothing and safety or worse yet are homeless. The
Canadian Government has no definition of poverty or a parliamentary rule on its
measure. Statistics Canada admits that they have no role in creating a definition for
government, but uses both the Low Income Cut-offs (LICOs)1
and Low Income
Measures (LIMs)2
to report.
There are two schools of thought on the risk factors of poverty. The Community
Empowerment Collective reports the big five factors of poverty3
are:
1. Disease
2. Apathy
3. Dependency
4. Dishonesty
5. Ignorance
The more rational and modern school of thought considers the six characteristics of
poverty4
to be:
1. Education
2. Labour force status
3. Source of income
4. Household type
5. Age of householder
1 http://www.statcan.gc.ca/pub/75f0002m/2009002/s2-eng.htm
2 http://www.statcan.gc.ca/pub/75f0002m/2009002/s3-eng.htm
3 http://cec.vcn.bc.ca/cmp/modules/emp-pov.htm
4 Michael Parkin, Robin Bade, Economics - Canada in the Global Environment,
Pearson, pg 444.
2. 2
6. Number of children
Looking through the lens of the enlighten school of thought we begin.
ABORIGINAL DEMOGRAPHIC & INCOME GAP
A study done in 2013 by the Canadian Centre for Policy Alternatives using 2006 census
data showed that poverty rates among Aboriginal Canadians are significantly higher
compared to the rest of Canada. By Aboriginal population we mean all those who self-
identify as Aboriginals, First Nations, Inuit and Metis.
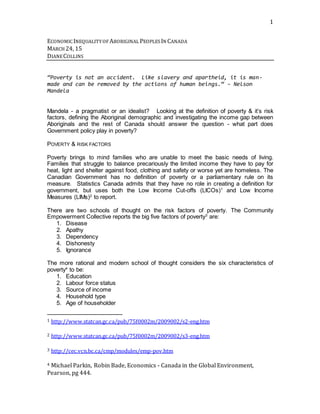
FIGURE 1.1 Median employment income for Aboriginal and non-Aboriginal populations5
In Figure 1.1 Aboriginal employment income is marginally increasing over the years, but
the gap between Aboriginal and non-Aboriginal employment figures remains staggering.
British Columbia has the second highest concentration of Aboriginals in Canada. In BC
the Aboriginal population grows at 3 times the rate of the non-Aboriginal population. The
median age of Aboriginals in BC is 28 years compared to the non-Aboriginal median age
of 41.
5http://www.policyalternatives.ca/sites/default/files/uploads/publications/reports/docs/Aborigin
al%20Income%20Gap.pdf
$- $5,000 $10,000 $15,000 $20,000 $25,000 $30,000
2006
2001
1996
Aboriginal
Non Aboriginal
3. 3
FIGURE 1.2 BC Aboriginal labour force activity characteristics6
The 15% unemployment rate is based on the labour force numbers. Worth considering
is a staggering 44.7% jobless rate by calculating (NL + U) / A.
Furthering our investigation we look at the graduation rates for Aboriginals in British
Columbia to get a sense of how Aboriginals are doing in the education system.
FIGURE 1.3 BC (dogwood diploma) – Aboriginal graduation7
In Figure 1.3 we see Aboriginal graduation rates hovering around 50%, whereas the
non-Aboriginal graduation rates are in the 73 percentile.
6 Statistics Canada 2006 Aboriginal Population profile for British Columbia
7 https://www.bced.gov.bc.ca/abed/perf2013.pdf
0 1000 2000 3000 4000 5000 6000 7000
2008/09
2009/10
2010/11
2011/12
Aboriginals in Gr 12
Dogwood Achieved
2006 Labour force activity for
Aboriginals over 15 years of age
my notes
Total
Total Aboriginal identity population 15+ A 140,820
In the labour force L 91,535
Employed E 77,850
Unemployed U 13,685
Not in the labour force NL 49,290
Participation rate P 65.0
Employment rate ER 55.3
Unemployment rate 44.7% jobless UER 15.0
4. 4
POLICY DIRECTION
Canada has legislated policy and programs to keep the impoverished from becoming
destitute. Examples are progressive income tax, employment insurance and family
allowance. It is the outdated ethos of a dominant nation that lives in the complex
legislation and policy around Aboriginal peoples that requires examining.
CONCLUSION
Research proves that Aboriginals on a per-capita basis have suffered among the poorest
of Canadians in unreasonably high numbers. The data proves that this is not a short-
term issue as even highly educated Aboriginal people face a considerable income gap
relative to non-Aboriginal people. There are direct costs to maintaining large populations
in poverty in terms of health and social programming as well as lost opportunity costs.
The 1996 Royal Commission on Aboriginal Peoples estimates the costs of failing to
change federal policy toward Aboriginal peoples — at $7.5 billion annually8
.
Can man create policy that allows people to thrive? Many economists think so and the
human development index9
takes us one step closer to answering that question.
8 http://www.aadnc-aandc.gc.ca/eng/1100100014597/1100100014637
9 https://www.youtube.com/watch?v=HYHow0VVeSQ