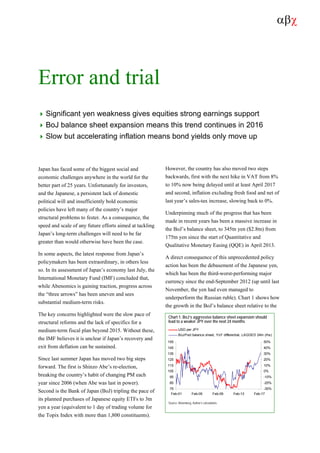
1) Significant yen weakness and massive expansion of the Bank of Japan's balance sheet provide strong earnings support for Japanese equities in 2015 and beyond 2016.
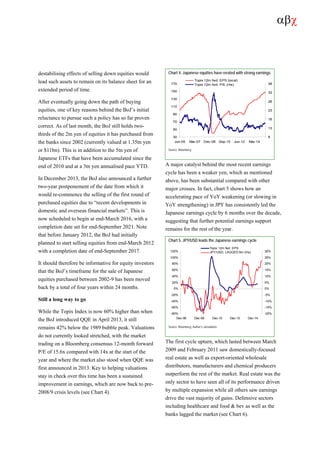
2) Slow but accelerating inflation in Japan means Japanese government bond yields can only move upward over the next 12 months.
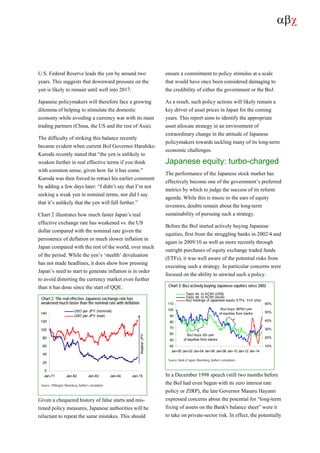
3) The Bank of Japan's large-scale purchases of assets like equities and government bonds are intended to stimulate the Japanese economy and inflation, but also risk continued downward pressure on the yen.