SlideShare a Scribd company logo
1 of 9
Download to read offline
ECONOMIC UPDATE &
CAPITAL MARKETS OUTLOOK
SECOND QUARTER 2014
•U.S. 10-year Treasury Note’s yield declined as low as
2.40% during Q2, and closed the 2nd quarter at 2.53%,
50 basis points lower than on New Year’s Day
2.53%
•The Volatility Index hit its lowest level since 2007. In May
and June, the S&P 500 Index closed inside a 1% band
every day
11.57
•Six consecutive positive quarters for the S&P 500 Index6 Qtrs
•Took the spotlight in Emerging Markets’ during Q2. A
landslide election paved the way for renewed
optimism, lifting the nation’s markets and currency
India
•Spanish 10-year sovereign debt yielded 2.63%. A major
rally in bonds benefitted European peripherals most,
extending outsized gains in 2014
2.63%
Five things to watch in H2 2014
i. Europe: Economic growth does not appear to be on a higher trajectory. Germany’s GDP slowed before
mid-year, so the general theme remains one of high debt and low growth. The ECB announced an
aggressive program to further increase liquidity and lending. Ahead, the central bank’s Asset Quality
Reviews for the major banks, which are considered vital to revitalize European credit and transparency
ii. Geopolitics: After a calm in Ukraine and the Middle East, the 3rd quarter could potentially see a replay
of turbulence and volatility in the region. That said, the story for the Emerging Markets as an asset class
has shifted in a positive way
iii. The Fed: Attention shifts to the Federal Reserve’s timetable to hike interest rates. Tapering of bond
purchases appears set to continue its glided path toward an October end-date. So, the countdown to
the Fed’s first increase in nearly a decade likely begins in earnest by year-end
iv. U.S. GDP: Consensus generally calls for a better 2nd-half. The view is for broad improvement through
most sectors of the economy. Housing may be key, as data has disappointed and, as importantly, been
a focal point at the Fed
v. Asia: Excitement in India after a historic national election deserves attention. Will PM Modi be able to
deliver, or at least provide a framework for potential reforms to come? Will foreign investors dive into
new opportunities in Asia’s 3rd largest economy? A key factor in India’s favor is the high credibility in
the Reserve Bank of India
Asset Class Highlights & Implementation Implications
•Generally Overweight Cash, as a result of realizing gains and opportunistically
look for more favorable entry
Overweight Cash
•Generally Neutral to Underweight Fixed Income, tactical exposures should focus
on: Unconstrained Investment Grade Debt, Opportunistic Credit and
Opportunistic Emerging Market Debt
Neutral to Underweight Fixed Income
•Generally Overweight Equities, tactical exposures should focus on: Blend of
Small and Midcap USA, European Equities & Small Cap European Equities, Japan
Equities, and Emerging Markets
Overweight Equities
•Neutral to slightly Overweight Income Producing Real Assets, with tactical
exposures focusing on: MLPs & US Energy, while Neutral Commodities and
Precious Metals
Neutral to Overweight Income Producing Real Assets
•Neutral Alternative Strategies, with an underweight in Global Macro and a
complete exit of the Managed Futures strategy. Focusing on Event Driven,
Relative Value and Equity Long Short Strategies, with tactical exposures
towards: Opportunistic credit, Distressed European Assets and Distressed Real-
Estate Europe
Neutral Alternative Strategies
2
Macroeconomics
The markets’ upward trajectory unchanged
The second quarter of 2014 was positive for
stocks and bonds. Stock markets, at home and
overseas, focused on better economic growth in
spite of a tough U.S. winter, and enjoying nearly
record-setting low volatility, withstood the
geopolitical turmoil in Ukraine, welcomed a
landslide election in India, and benefited from a
sharp decline in interest rates across developed
markets.
At its two quarterly meetings, the Federal
Reserve showed confidence an economic
rebound was in the works. However, the housing
sector continued to lag last year's pace, with
annualized comparatives still in decline. In a
normal economy housing contributes 4 to 5% to
domestic GDP, yet it has remained behind on the
curve compared to where the nation's
demographics indicate it should be. Higher
mortgage rates dented homes sales last year, so
the U.S. housing recovery is still incomplete eight
years after the sector peaked.
The biggest stories of Q2: long-dated U.S.
Treasury yields declined to 12-month lows, along
with the European Central Bank’s (ECB) much
anticipated decision to further ease monetary
policy on the continent. Both had ripple effects in
the marketplace. A significant drop in bond yields
was noted after Q1 GDP was noticeably weaker
than consensus forecasts. The fact an already
soft number turned sharply negative was
surprising, and provoked reassessments of the
overall economy: are we indeed on a higher
growth trajectory? Or, after much anticipation,
would 2014 turn out to be another year of
mediocre performance? The Federal Reserve
acknowledged the lower growth line in their
updated figures for the second-half and calendar
year.
The Fed’s general theme of broad-based
improvement in the economy remains intact, it’s
just been pushed-out to the second-half. How that
current market and Fed view stacks up to lower
bond yields is a bit of a conundrum. For now, the
accepted explanation includes a shift to long-term
bonds from equities by institutional pension
funds, a benign inflation environment, and the
tapering of bond purchases by the Fed remaining
predictable. Predictions for higher interest rates
at the beginning of the year did not come to pass,
so one of the questions going forward is: will bond
yields continue to decline or reverse course in H2
based on better expected economic growth?
The ECB reduced the overnight rate to a new low,
followed-up by cutting deposit rates to negative
territory for the first time in its 15-year history, and
devised new lending programs to inspire an
increase in credit from banks to small businesses
specifically. As Mr. Draghi has pointed out more
than once, this is not a quick fix, simply another
lever to create more monetary stimulus in the
Euro-zone, and entice the largest commercial
institutions with low-rate loans to increase loan
portfolios. Ahead of the ECB’s stress test results
later this year, that idea may prove a tough sell!
Emerging Markets (EM) benefited most from a
reversal in market perception. Where the opening
quarter saw a continuation of last year’s caution
toward the sector, that attitude began to change
by the end of Q1. Replacing concerns for local
currency valuations, markets focused on low
debt-to-growth ratio, high nominal yields vis-à-vis
developed markets, and a number of central
banks prioritizing the inflation fight with higher
rates. The result was a strong increase in fund
flows in equities and bonds, initially to cover
previous short positions in the asset classes.
Later, and throughout the majority of Q2, new
flows poured into EM. A very different picture
from 12 and even 6 months ago.
The U.S. Dollar was relatively stable, though it
traded to a new 3-year low (almost $1.40) against
the Euro, before steps by the ECB brought the
currency pair’s value closer to its price at the start
of 2014. The British Pound appreciated vs. all its
major counter-parties. In commodities, gold
rallied in June to close Q2 on a positive note.
Also, copper and Brent, two indicators of
economic growth, increased, perhaps giving
notice of better days ahead for global growth.
3
Global Markets’ Performance
Emerging Market sovereign bonds had a strong
Q2, up 5%, nearly doubling their YTD
performance. The driving force was better U.S.
growth combined with optimism in India, and
stabilization in China. Outflows turned to inflows
ahead of the quarter and continued the pattern
well into Q2.
The Global Bond Index registered a solid gain,
with investors favoring U.S. debt and duration on
a relative basis. In a continuation of Q1, the 2nd
quarter brought higher prices, partly on remnants
of a harsh winter which lowered economic output,
but also on anecdotal evidence that pension
funds were reallocating to fixed income after a
very strong year in equity markets. In addition, the
Federal Reserve has stayed-the-course on bond
tapering. The Fed’s updated forecast presented
a benign view on growth and inflation, and made
clear that the ‘lower for longer’ mantra remains
the consensus, though it is not unanimous.
The S&P 500 Index generated a sixth
consecutive quarter of positive returns. After a
rocky start in April, it was a smoother ride than
experienced in Q1. Interest rates continued to fall,
providing further support to the asset class.
Strong inflows across developed and developing
countries’ markets marked the 2nd quarter.
Emerging Markets saw a complete reversal from
outflows in Q1, and inflows were consistent and
steady.
Overseas, Europe and Japan closed in the black.
European bourses nearly matched the S&P 500,
lifted by the European Central Bank’s promise,
implicit and later explicit, to do more to stimulate
the continent’s economy, prompted by the ECB’s
concern of very low inflation. In Japan, the Nikkei
caught fire from late May through the end of June
after it struggled to begin the fiscal-year.
Q2 saw a second positive performance in gold
and crude oil. However, this quarter the ride was
bumpy and uneven, with flows and sentiment
shifting back & forth, especially for the Midas
metal. Oil saw a smoother month-to-month
performance. Ongoing geopolitical risks shifted to
Iraq from Ukraine late in Q2, and along with signs
the U.S. economy had strengthened following a
colder than normal winter.
4
Equity Market Performance by Country
In the developed world, equity prices moved
higher in the second quarter of 2014, and more
uniformly than in Q1. Japan did best with a flurry
in June. Fund flows into Continental Europe
began subsiding ahead of quarter-end. The U.S.
had a solid April-to-June quarter after marginal
gains in Q1. Market expectations of a material
pick-up in the economy played a role. Europe’s
economy continued to expand, albeit from a very
low growth rate.
Japan was impacted by concerns that a
consumption tax to start the new fiscal-year
would slow growth. A tough U.S. winter added to
the worries. Expectations the domestic economy
could see its best year since well before the
financial crisis were later questioned.
Australia’s rebound continued in Q2, reaching
mid-year with a double-digit gain. Commodity
prices were generally higher, providing a lift to
share prices and its currency.
A mostly favorable second quarter for EM
equities, because of better economic data, and a
lessening of geopolitical tensions. Capital flows to
the sector improved substantially as weeks of
outflows reversed course in Q2. First, the
Russian-Ukraine crisis, followed by the situation
in Iraq, subsided enough to prevent a spike in oil
prices. That boosted investor confidence. EM
economies are very sensitive to oil prices, which
has an outsized effect on inflation and, therefore,
interest rates.
On a YTD basis, Russia and China proved
exceptions in the asset class. Though Russia’s
economy has suffered a dramatic slowdown. In
contrast, China’s economy showed greater
stability, allowing equity prices to enjoy a small
recovery in the quarter.
India was a special story, the landslide election of
PM Modi gave hope and optimism among the
population and investors.
That said, India’s chronic current account deficit,
plus high inflation may make it difficult to maintain
very strong YTD returns.
5
Currency Performance vs. USD
The U.S. Dollar weakened versus a number of
EM currencies in Q2, particularly the Colombian
Peso and Russian Ruble. The Ruble remains
negative YTD. The Indian Rupee softened in Q2
but held on to most of its earlier gains.
The Chinese Yuan has been an interesting story
in 2014. It recorded a first-half loss for the first
time in many years, after appreciating for the
better part of eight years. The Chinese
government’s concerted effort to stop speculators
has been effective YTD.
The Brazilian Real has steadily gained the past 6
months, while the Mexican Peso traded a much
tighter range vs. the U.S. Dollar. The South
African Rand registered a 1% loss in Q2, and 2%
YTD, following much the same pattern.
Against the Euro, the Dollar recovered from its
lowest levels to finish the first-half with a slight
gain. The Yen kept its gains vs. the Dollar to close
out a very different 1st half than last year. The
British Pound touched its highest point in 5 years,
up 4% YTD.
In the EM space, this divergent performance
marks a contrast to last year when almost all EM
currencies lost ground to the U.S. Dollar.
The Australian Dollar, followed the same path as
Brazil’s Real, steadily appreciated against the
Dollar quarter-to-quarter…partly due to a better
outlook for China, its biggest trading partner and
an improving trend in global commodity prices.
6
Valuations – Fixed Income
U.S. corporate bond spreads narrowed further in
the second quarter alongside a material decline
in domestic interest rates. Additionally, global
bond yields fell in concert with U.S. fixed income.
European sovereign debt (peripherals)
outperformed.
The Fed’s decision to continue tapering its
monthly totals at their April and June meetings
were anticipated by the markets. The Fed’s
position is that tapering is not on a pre-set course,
but the bar has been set very high to change the
pace and amount of its program.
After a quiet start in April, Treasury prices moved
substantially higher in May and June, reaching
levels not seen in nearly 12 months. On balance,
inflows outpaced outflows by a wide margin in
Q2.
High Yield (HY) spreads moved even lower, to
new nominal records vs. U.S. 90-day Treasury
Bills. In Washington, the fiscal headwinds have
diminished; the multi-year budget agreement has
helped remove a good deal of uncertainty. After
consolidating in the first quarter, the second
quarter saw a return to the previous pattern;
spreads narrowed, and risk appetite increased.
Emerging Markets (EM) spreads improved with
steady inflows. In contrast to Q1, debt did not
encounter headwinds from equity outflows, which
saw successive weeks of inflows throughout Q2.
The sub-asset class built on gains in Q1, as
inflows led to higher prices.
As in Developed Markets, EM saw a narrowing in
interest rate spreads. That pattern stayed intact
with U.S. yields descending as well, narrowing
differentials.
Most important, the markets’ view of EM debt
remained positive, helped by still attractive
nominal yields vs. DM. In summary, EM
headwinds continue to dissipate in response to
the Fed’s tapering program. However, in contrast
to last quarter, pockets reflecting full valuations
are more commonplace.
7
Valuations – Equities
The S&P 500 Index saw its price-to-earnings
(P/E) multiple rise above its historical average.
Earnings growth beat expectations for Q1 2014
(the bar was very low). However, revenues
remained on the soft side, as has been the case
over several consecutive quarters. In 2014,
financials have not outperformed, and have
actually trailed non-financial corporate earnings.
Money center banks have reported mixed results,
with investment and mortgage income down in
Q1, with a repeat expected in Q2.
The MSCI Europe Index P/E ratio moved higher,
above its historical average. Historically,
European P/E ratios surpass similar readings in
the U.S., and with many investors still considering
Europe in catch-up mode, some valuations
remain attractive. In Q2, monthly flows were
overwhelmingly positive, until close to mid-year,
when in late June some rotation away from
European shares was evident. U.S. flows were
mostly positive over the course of the quarter.
The MSCI Japan Index recovered in Q2. A steep
decline in Q1 followed on the heels of a historic
50% gain, measured in Yen, in 2013. Driven by
the sharp bounce and revaluation, the MSCI
Japan Index was able to register a positive
performance for the calendar year (measured in
US Dollars). Finally, the 12-month P/E ratio
remains more than one standard deviation below
its historical average.
In China, Q2 saw a continuation of the last
several years. That is, equities were generally out
of favor. Stabilization of the general economy has
helped at the margins. Among the headwinds:
accounting and transparency issues, a slowdown
from high growth, and higher interest rates. And,
credit creation has slowed.
Valuations have not picked-up, and remain one-
standard deviation below historical averages.
Economic uncertainty has lessened with better
manufacturing data, though questions on the
longer-term effects of government rebalancing
between consumption and investment remain to
be answered.
8
Sources:
Bloomberg LP.
Disclaimer:
This review contains our current opinions and commentary, and does not represent a recommendation of
any particular security, strategy, investment product or manager. The views expressed here are subject to
change without notice. Our commentary is distributed for informational and educational purposes only and
should not be considered as investment advice or an offer of any security or service for sale. Information
contained herein has been obtained from sources we believe to be reliable, but we do not guarantee its
completeness or accuracy. No part of this report may be reproduced in any form, or referred to in any other
publication, without WE’s written permission.
Relevant Indices:
AUSTRALIA: Australian Stock Exchange All Ordinaries Index – AUSTRIA: Viena Stock Exchange Austrian
Traded Index – BELGIUM: Viena Stock Exchange Austrian Traded Index – BRAZIL: Ibovespa Brazil Sao
Paulo Stock Exchange Index – CANADA: S&P/TSX Composite Index – CHILE: Santiago Stock Exchange
IPSA Index – CHINA: Shanghai Shenzhen CSI 300 Index – COLOMBIA: Indice General de la Bolsa de
Valores de Colombia - CZECH REPUBLIC: Prague Stock Exchange Index – DENMARK: OMX
Copengagen 20 Index – EGYPT: Egyptian EGX 30 Price Return Index – FINLAND: OMX Helsinki Index –
FRANCE: CAC 40 Index – GERMANY: Deutsche Borse AG German Stock Index DAX – GREECE: Athens
Stock Exchange General Index - HONG KONG: Hong Kong Hang Seng Index – HUNGARY: Budapest
Stock Exchange Index – INDIA: S&P BSE India Sensex Index – INDONESIA: Jakarta Stock Exchange
Composite Index – IRELAND: Irish Stock Exchange Overall Index – ISRAEL: Tel Aviv 25 Index – ITALY:
FTSE MIB Index – JAPAN: Nikkei 225 – MALAYSIA: FTSE Bursa Malaysia KLCI Index – MEXICO: Mexican
Stock Exchange Bolsa IPC Index – MOROCCO: Madex Free Float Index – NETHERLANDS: AEX-Index -
NEW ZEALAND: New Zealand Exchange – NORWAY: Oslo Stock Exchange OBX Price Index – PERU:
Bolsa de Valores de Lima General Sector Index – PHILIPPINES: Philippines Stock Exchange PSEi Index
– POLAND: Warsaw Stock Exchange Top 20 Index – PORTUGAL: PSI 20 Index – RUSSIA: Russian
Trading System Cash Index – SINGAPORE: Straits Times Index STI - SOUTH AFRICA: FTSE/JSE Africa
All Share Index - SOUTH KOREA: Korea Stock Exchange Kospi Index – SPAIN: IBEX 35 Index –
SWEDEN: OMX Stockholm 30 Index – SWITZERLAND: Swiss Market Index – TAIWAN: Taiwan Stock
Exchange Weighted Index – THAILAND: Stock Exchange of Thailand SET Index – TURKEY: Borsa
Istanbul Stock Exchange National 100 Index - UNITED KINGDOM: FTSE 100 Index - UNITED STATES:
Dow Jones Industrial Average.
Global Industrial Bond Spread: USD Global Industrial (BBB) 10-yr vs. Treasury Bill (U.S) 90 Day. High Yield
Bond Spread: USD Composite (BB) 5-yr vs. Treasury Bill (U.S) 90 Day. US Bond Spread: USD US (AA)
10-yr vs. Treasury Bill (U.S) 90 Day. Emerging Market Bond Spread: CS Emerging Market Corporate Bond
Total Yield vs. Treasury Bill (U.S) 90 Day.
9

More Related Content

What's hot

Emerging markets outlook, October 2013
Emerging markets outlook, October 2013Emerging markets outlook, October 2013
Emerging markets outlook, October 2013Swedbank
 
November 9 l Session 2 l GBIH
November 9 l Session 2 l GBIHNovember 9 l Session 2 l GBIH
November 9 l Session 2 l GBIHGBIHSupport
 
Monthly Newsletter Mar'16
Monthly Newsletter Mar'16Monthly Newsletter Mar'16
Monthly Newsletter Mar'16Taha Ekram
 
Currency monthly 9th dec'16
Currency monthly   9th dec'16Currency monthly   9th dec'16
Currency monthly 9th dec'16Choice Equity
 
Stock marketoutlook 0616
Stock marketoutlook 0616Stock marketoutlook 0616
Stock marketoutlook 0616Charles Graham
 
July 14 I Session 2 I GBIH
July 14 I Session 2 I GBIHJuly 14 I Session 2 I GBIH
July 14 I Session 2 I GBIHGBIHSupport
 
FOMC REPORT_JUNE
FOMC REPORT_JUNEFOMC REPORT_JUNE
FOMC REPORT_JUNECongyi Liu
 
BSIF Investment-Environment-Committee-Report-Fall-2015
BSIF Investment-Environment-Committee-Report-Fall-2015BSIF Investment-Environment-Committee-Report-Fall-2015
BSIF Investment-Environment-Committee-Report-Fall-2015Julian Fung
 
Swedbank Economic Outlook April 2011
Swedbank Economic Outlook April 2011Swedbank Economic Outlook April 2011
Swedbank Economic Outlook April 2011Swedbank
 
BSIF Investment-Environment-Committee-Report-Spring-2016
BSIF Investment-Environment-Committee-Report-Spring-2016BSIF Investment-Environment-Committee-Report-Spring-2016
BSIF Investment-Environment-Committee-Report-Spring-2016Julian Fung
 
Interest Rates Opportunities
Interest Rates OpportunitiesInterest Rates Opportunities
Interest Rates OpportunitiesMatarr Gaye
 
Investment Outlook 2016 - Franklin Templeton Investments
Investment Outlook 2016 - Franklin Templeton InvestmentsInvestment Outlook 2016 - Franklin Templeton Investments
Investment Outlook 2016 - Franklin Templeton InvestmentsCarlos Francisco Gómez Guzmán
 
Caton's corner august economic update
Caton's corner august economic updateCaton's corner august economic update
Caton's corner august economic updateJosh Develop
 
Monthly investment perspective_2013-04_v7_av
Monthly investment perspective_2013-04_v7_avMonthly investment perspective_2013-04_v7_av
Monthly investment perspective_2013-04_v7_avphoglund
 
Emerging Markets December 2011
Emerging Markets December 2011Emerging Markets December 2011
Emerging Markets December 2011Swedbank
 

What's hot (19)

Emerging markets outlook, October 2013
Emerging markets outlook, October 2013Emerging markets outlook, October 2013
Emerging markets outlook, October 2013
 
Error and trial
Error and trialError and trial
Error and trial
 
February 2013 World Economic Situation and Prospects
February 2013 World Economic Situation and ProspectsFebruary 2013 World Economic Situation and Prospects
February 2013 World Economic Situation and Prospects
 
November 9 l Session 2 l GBIH
November 9 l Session 2 l GBIHNovember 9 l Session 2 l GBIH
November 9 l Session 2 l GBIH
 
Monthly Newsletter Mar'16
Monthly Newsletter Mar'16Monthly Newsletter Mar'16
Monthly Newsletter Mar'16
 
Currency monthly 9th dec'16
Currency monthly   9th dec'16Currency monthly   9th dec'16
Currency monthly 9th dec'16
 
Stock marketoutlook 0616
Stock marketoutlook 0616Stock marketoutlook 0616
Stock marketoutlook 0616
 
July 14 I Session 2 I GBIH
July 14 I Session 2 I GBIHJuly 14 I Session 2 I GBIH
July 14 I Session 2 I GBIH
 
FOMC REPORT_JUNE
FOMC REPORT_JUNEFOMC REPORT_JUNE
FOMC REPORT_JUNE
 
BSIF Investment-Environment-Committee-Report-Fall-2015
BSIF Investment-Environment-Committee-Report-Fall-2015BSIF Investment-Environment-Committee-Report-Fall-2015
BSIF Investment-Environment-Committee-Report-Fall-2015
 
Swedbank Economic Outlook April 2011
Swedbank Economic Outlook April 2011Swedbank Economic Outlook April 2011
Swedbank Economic Outlook April 2011
 
BSIF Investment-Environment-Committee-Report-Spring-2016
BSIF Investment-Environment-Committee-Report-Spring-2016BSIF Investment-Environment-Committee-Report-Spring-2016
BSIF Investment-Environment-Committee-Report-Spring-2016
 
Weekly Market Review - January 03, 2014
Weekly Market Review - January 03, 2014Weekly Market Review - January 03, 2014
Weekly Market Review - January 03, 2014
 
Interest Rates Opportunities
Interest Rates OpportunitiesInterest Rates Opportunities
Interest Rates Opportunities
 
Investment Outlook 2016 - Franklin Templeton Investments
Investment Outlook 2016 - Franklin Templeton InvestmentsInvestment Outlook 2016 - Franklin Templeton Investments
Investment Outlook 2016 - Franklin Templeton Investments
 
Caton's corner august economic update
Caton's corner august economic updateCaton's corner august economic update
Caton's corner august economic update
 
Monthly investment perspective_2013-04_v7_av
Monthly investment perspective_2013-04_v7_avMonthly investment perspective_2013-04_v7_av
Monthly investment perspective_2013-04_v7_av
 
Emerging Markets December 2011
Emerging Markets December 2011Emerging Markets December 2011
Emerging Markets December 2011
 
Weekly Market Review - August 16, 2013
Weekly Market Review - August 16, 2013Weekly Market Review - August 16, 2013
Weekly Market Review - August 16, 2013
 

Similar to We Q2 2014 update

Investment Edge Quarter 1 2011
Investment Edge Quarter 1 2011Investment Edge Quarter 1 2011
Investment Edge Quarter 1 2011simonkbowen
 
7 wells fargo 2015 mid-year outlook - turning points
7 wells fargo 2015 mid-year outlook - turning points7 wells fargo 2015 mid-year outlook - turning points
7 wells fargo 2015 mid-year outlook - turning points123jumpad
 
Investment Edge Q4 2010
Investment Edge Q4 2010Investment Edge Q4 2010
Investment Edge Q4 2010simonkbowen
 
Vietnam's Recent Economic Development 2013
Vietnam's Recent Economic Development  2013Vietnam's Recent Economic Development  2013
Vietnam's Recent Economic Development 2013Quynh LE
 
Whats Ahead In 2012 - An Investment Perspective (Spring Update)
Whats Ahead In 2012 - An Investment Perspective (Spring Update)Whats Ahead In 2012 - An Investment Perspective (Spring Update)
Whats Ahead In 2012 - An Investment Perspective (Spring Update)scottmeek
 
2012 global credit outlook sovereign debt problems weigh on a mostly tepid fo...
2012 global credit outlook sovereign debt problems weigh on a mostly tepid fo...2012 global credit outlook sovereign debt problems weigh on a mostly tepid fo...
2012 global credit outlook sovereign debt problems weigh on a mostly tepid fo...Pim Piepers
 
July 2011 Market Update
July 2011 Market UpdateJuly 2011 Market Update
July 2011 Market Updatedoug2229
 
Putnam Perspective: Fixed Income Outlook Q2 2014
Putnam Perspective: Fixed Income Outlook Q2 2014Putnam Perspective: Fixed Income Outlook Q2 2014
Putnam Perspective: Fixed Income Outlook Q2 2014Putnam Investments
 
Mid year outlook market perspectives july 2012 final
Mid year outlook market perspectives july 2012 finalMid year outlook market perspectives july 2012 final
Mid year outlook market perspectives july 2012 finalRankia
 
Jpc weekly market view 2 december 2015
Jpc weekly market view 2 december 2015Jpc weekly market view 2 december 2015
Jpc weekly market view 2 december 2015Jon Taubert
 
Third Quarter 2015 Economic Report (Oct 2015)
Third Quarter 2015 Economic Report (Oct 2015) Third Quarter 2015 Economic Report (Oct 2015)
Third Quarter 2015 Economic Report (Oct 2015) Marketing Durban Chamber
 
Investment Strategy: Midyear Update
Investment Strategy: Midyear UpdateInvestment Strategy: Midyear Update
Investment Strategy: Midyear UpdateSarah Cuddy
 
Encouragin Signs for 2014
Encouragin Signs for 2014Encouragin Signs for 2014
Encouragin Signs for 2014Miqui Mel
 
Putnam Fixed Income Outlook Q1 2013
Putnam Fixed Income Outlook Q1 2013Putnam Fixed Income Outlook Q1 2013
Putnam Fixed Income Outlook Q1 2013Putnam Investments
 

Similar to We Q2 2014 update (20)

Investment Edge Quarter 1 2011
Investment Edge Quarter 1 2011Investment Edge Quarter 1 2011
Investment Edge Quarter 1 2011
 
7 wells fargo 2015 mid-year outlook - turning points
7 wells fargo 2015 mid-year outlook - turning points7 wells fargo 2015 mid-year outlook - turning points
7 wells fargo 2015 mid-year outlook - turning points
 
Investment Edge Q4 2010
Investment Edge Q4 2010Investment Edge Q4 2010
Investment Edge Q4 2010
 
July 2013 World Economic Situation and Prospects
July 2013 World Economic Situation and ProspectsJuly 2013 World Economic Situation and Prospects
July 2013 World Economic Situation and Prospects
 
April 2013 World Economic Situation and Prospects
April 2013 World Economic Situation and ProspectsApril 2013 World Economic Situation and Prospects
April 2013 World Economic Situation and Prospects
 
File 707525
File 707525File 707525
File 707525
 
Vietnam's Recent Economic Development 2013
Vietnam's Recent Economic Development  2013Vietnam's Recent Economic Development  2013
Vietnam's Recent Economic Development 2013
 
Whats Ahead In 2012 - An Investment Perspective (Spring Update)
Whats Ahead In 2012 - An Investment Perspective (Spring Update)Whats Ahead In 2012 - An Investment Perspective (Spring Update)
Whats Ahead In 2012 - An Investment Perspective (Spring Update)
 
2012 global credit outlook sovereign debt problems weigh on a mostly tepid fo...
2012 global credit outlook sovereign debt problems weigh on a mostly tepid fo...2012 global credit outlook sovereign debt problems weigh on a mostly tepid fo...
2012 global credit outlook sovereign debt problems weigh on a mostly tepid fo...
 
July 2011 Market Update
July 2011 Market UpdateJuly 2011 Market Update
July 2011 Market Update
 
Putnam Perspective: Fixed Income Outlook Q2 2014
Putnam Perspective: Fixed Income Outlook Q2 2014Putnam Perspective: Fixed Income Outlook Q2 2014
Putnam Perspective: Fixed Income Outlook Q2 2014
 
Monthly Briefing on the World Economic Situation and Prospects (WESP), No. 61
Monthly Briefing on the World Economic Situation and Prospects (WESP), No. 61Monthly Briefing on the World Economic Situation and Prospects (WESP), No. 61
Monthly Briefing on the World Economic Situation and Prospects (WESP), No. 61
 
Mid year outlook market perspectives july 2012 final
Mid year outlook market perspectives july 2012 finalMid year outlook market perspectives july 2012 final
Mid year outlook market perspectives july 2012 final
 
Jpc weekly market view 2 december 2015
Jpc weekly market view 2 december 2015Jpc weekly market view 2 december 2015
Jpc weekly market view 2 december 2015
 
Third Quarter 2015 Economic Report (Oct 2015)
Third Quarter 2015 Economic Report (Oct 2015) Third Quarter 2015 Economic Report (Oct 2015)
Third Quarter 2015 Economic Report (Oct 2015)
 
Investment Strategy: Midyear Update
Investment Strategy: Midyear UpdateInvestment Strategy: Midyear Update
Investment Strategy: Midyear Update
 
Economy Matters - Nov-Dec 2014
Economy Matters - Nov-Dec 2014Economy Matters - Nov-Dec 2014
Economy Matters - Nov-Dec 2014
 
Encouragin Signs for 2014
Encouragin Signs for 2014Encouragin Signs for 2014
Encouragin Signs for 2014
 
Putnam Fixed Income Outlook Q1 2013
Putnam Fixed Income Outlook Q1 2013Putnam Fixed Income Outlook Q1 2013
Putnam Fixed Income Outlook Q1 2013
 
US FED TAPERING
US FED TAPERINGUS FED TAPERING
US FED TAPERING
 

Recently uploaded

Malad Call Girl in Services 9892124323 | ₹,4500 With Room Free Delivery
Malad Call Girl in Services  9892124323 | ₹,4500 With Room Free DeliveryMalad Call Girl in Services  9892124323 | ₹,4500 With Room Free Delivery
Malad Call Girl in Services 9892124323 | ₹,4500 With Room Free DeliveryPooja Nehwal
 
Q3 2024 Earnings Conference Call and Webcast Slides
Q3 2024 Earnings Conference Call and Webcast SlidesQ3 2024 Earnings Conference Call and Webcast Slides
Q3 2024 Earnings Conference Call and Webcast SlidesMarketing847413
 
05_Annelore Lenoir_Docbyte_MeetupDora&Cybersecurity.pptx
05_Annelore Lenoir_Docbyte_MeetupDora&Cybersecurity.pptx05_Annelore Lenoir_Docbyte_MeetupDora&Cybersecurity.pptx
05_Annelore Lenoir_Docbyte_MeetupDora&Cybersecurity.pptxFinTech Belgium
 
06_Joeri Van Speybroek_Dell_MeetupDora&Cybersecurity.pdf
06_Joeri Van Speybroek_Dell_MeetupDora&Cybersecurity.pdf06_Joeri Van Speybroek_Dell_MeetupDora&Cybersecurity.pdf
06_Joeri Van Speybroek_Dell_MeetupDora&Cybersecurity.pdfFinTech Belgium
 
Vip Call US 📞 7738631006 ✅Call Girls In Sakinaka ( Mumbai )
Vip Call US 📞 7738631006 ✅Call Girls In Sakinaka ( Mumbai )Vip Call US 📞 7738631006 ✅Call Girls In Sakinaka ( Mumbai )
Vip Call US 📞 7738631006 ✅Call Girls In Sakinaka ( Mumbai )Pooja Nehwal
 
Log your LOA pain with Pension Lab's brilliant campaign
Log your LOA pain with Pension Lab's brilliant campaignLog your LOA pain with Pension Lab's brilliant campaign
Log your LOA pain with Pension Lab's brilliant campaignHenry Tapper
 
Dharavi Russian callg Girls, { 09892124323 } || Call Girl In Mumbai ...
Dharavi Russian callg Girls, { 09892124323 } || Call Girl In Mumbai ...Dharavi Russian callg Girls, { 09892124323 } || Call Girl In Mumbai ...
Dharavi Russian callg Girls, { 09892124323 } || Call Girl In Mumbai ...Pooja Nehwal
 
CALL ON ➥8923113531 🔝Call Girls Gomti Nagar Lucknow best sexual service
CALL ON ➥8923113531 🔝Call Girls Gomti Nagar Lucknow best sexual serviceCALL ON ➥8923113531 🔝Call Girls Gomti Nagar Lucknow best sexual service
CALL ON ➥8923113531 🔝Call Girls Gomti Nagar Lucknow best sexual serviceanilsa9823
 
Dividend Policy and Dividend Decision Theories.pptx
Dividend Policy and Dividend Decision Theories.pptxDividend Policy and Dividend Decision Theories.pptx
Dividend Policy and Dividend Decision Theories.pptxanshikagoel52
 
VVIP Pune Call Girls Katraj (7001035870) Pune Escorts Nearby with Complete Sa...
VVIP Pune Call Girls Katraj (7001035870) Pune Escorts Nearby with Complete Sa...VVIP Pune Call Girls Katraj (7001035870) Pune Escorts Nearby with Complete Sa...
VVIP Pune Call Girls Katraj (7001035870) Pune Escorts Nearby with Complete Sa...Call Girls in Nagpur High Profile
 
Quarter 4- Module 3 Principles of Marketing
Quarter 4- Module 3 Principles of MarketingQuarter 4- Module 3 Principles of Marketing
Quarter 4- Module 3 Principles of MarketingMaristelaRamos12
 
20240429 Calibre April 2024 Investor Presentation.pdf
20240429 Calibre April 2024 Investor Presentation.pdf20240429 Calibre April 2024 Investor Presentation.pdf
20240429 Calibre April 2024 Investor Presentation.pdfAdnet Communications
 
The Economic History of the U.S. Lecture 30.pdf
The Economic History of the U.S. Lecture 30.pdfThe Economic History of the U.S. Lecture 30.pdf
The Economic History of the U.S. Lecture 30.pdfGale Pooley
 
The Economic History of the U.S. Lecture 17.pdf
The Economic History of the U.S. Lecture 17.pdfThe Economic History of the U.S. Lecture 17.pdf
The Economic History of the U.S. Lecture 17.pdfGale Pooley
 
(DIYA) Bhumkar Chowk Call Girls Just Call 7001035870 [ Cash on Delivery ] Pun...
(DIYA) Bhumkar Chowk Call Girls Just Call 7001035870 [ Cash on Delivery ] Pun...(DIYA) Bhumkar Chowk Call Girls Just Call 7001035870 [ Cash on Delivery ] Pun...
(DIYA) Bhumkar Chowk Call Girls Just Call 7001035870 [ Cash on Delivery ] Pun...ranjana rawat
 
The Economic History of the U.S. Lecture 18.pdf
The Economic History of the U.S. Lecture 18.pdfThe Economic History of the U.S. Lecture 18.pdf
The Economic History of the U.S. Lecture 18.pdfGale Pooley
 
The Economic History of the U.S. Lecture 21.pdf
The Economic History of the U.S. Lecture 21.pdfThe Economic History of the U.S. Lecture 21.pdf
The Economic History of the U.S. Lecture 21.pdfGale Pooley
 
High Class Call Girls Nagpur Grishma Call 7001035870 Meet With Nagpur Escorts
High Class Call Girls Nagpur Grishma Call 7001035870 Meet With Nagpur EscortsHigh Class Call Girls Nagpur Grishma Call 7001035870 Meet With Nagpur Escorts
High Class Call Girls Nagpur Grishma Call 7001035870 Meet With Nagpur Escortsranjana rawat
 
The Economic History of the U.S. Lecture 20.pdf
The Economic History of the U.S. Lecture 20.pdfThe Economic History of the U.S. Lecture 20.pdf
The Economic History of the U.S. Lecture 20.pdfGale Pooley
 

Recently uploaded (20)

Malad Call Girl in Services 9892124323 | ₹,4500 With Room Free Delivery
Malad Call Girl in Services  9892124323 | ₹,4500 With Room Free DeliveryMalad Call Girl in Services  9892124323 | ₹,4500 With Room Free Delivery
Malad Call Girl in Services 9892124323 | ₹,4500 With Room Free Delivery
 
Q3 2024 Earnings Conference Call and Webcast Slides
Q3 2024 Earnings Conference Call and Webcast SlidesQ3 2024 Earnings Conference Call and Webcast Slides
Q3 2024 Earnings Conference Call and Webcast Slides
 
05_Annelore Lenoir_Docbyte_MeetupDora&Cybersecurity.pptx
05_Annelore Lenoir_Docbyte_MeetupDora&Cybersecurity.pptx05_Annelore Lenoir_Docbyte_MeetupDora&Cybersecurity.pptx
05_Annelore Lenoir_Docbyte_MeetupDora&Cybersecurity.pptx
 
06_Joeri Van Speybroek_Dell_MeetupDora&Cybersecurity.pdf
06_Joeri Van Speybroek_Dell_MeetupDora&Cybersecurity.pdf06_Joeri Van Speybroek_Dell_MeetupDora&Cybersecurity.pdf
06_Joeri Van Speybroek_Dell_MeetupDora&Cybersecurity.pdf
 
Vip Call US 📞 7738631006 ✅Call Girls In Sakinaka ( Mumbai )
Vip Call US 📞 7738631006 ✅Call Girls In Sakinaka ( Mumbai )Vip Call US 📞 7738631006 ✅Call Girls In Sakinaka ( Mumbai )
Vip Call US 📞 7738631006 ✅Call Girls In Sakinaka ( Mumbai )
 
Log your LOA pain with Pension Lab's brilliant campaign
Log your LOA pain with Pension Lab's brilliant campaignLog your LOA pain with Pension Lab's brilliant campaign
Log your LOA pain with Pension Lab's brilliant campaign
 
Dharavi Russian callg Girls, { 09892124323 } || Call Girl In Mumbai ...
Dharavi Russian callg Girls, { 09892124323 } || Call Girl In Mumbai ...Dharavi Russian callg Girls, { 09892124323 } || Call Girl In Mumbai ...
Dharavi Russian callg Girls, { 09892124323 } || Call Girl In Mumbai ...
 
CALL ON ➥8923113531 🔝Call Girls Gomti Nagar Lucknow best sexual service
CALL ON ➥8923113531 🔝Call Girls Gomti Nagar Lucknow best sexual serviceCALL ON ➥8923113531 🔝Call Girls Gomti Nagar Lucknow best sexual service
CALL ON ➥8923113531 🔝Call Girls Gomti Nagar Lucknow best sexual service
 
Dividend Policy and Dividend Decision Theories.pptx
Dividend Policy and Dividend Decision Theories.pptxDividend Policy and Dividend Decision Theories.pptx
Dividend Policy and Dividend Decision Theories.pptx
 
VVIP Pune Call Girls Katraj (7001035870) Pune Escorts Nearby with Complete Sa...
VVIP Pune Call Girls Katraj (7001035870) Pune Escorts Nearby with Complete Sa...VVIP Pune Call Girls Katraj (7001035870) Pune Escorts Nearby with Complete Sa...
VVIP Pune Call Girls Katraj (7001035870) Pune Escorts Nearby with Complete Sa...
 
Quarter 4- Module 3 Principles of Marketing
Quarter 4- Module 3 Principles of MarketingQuarter 4- Module 3 Principles of Marketing
Quarter 4- Module 3 Principles of Marketing
 
20240429 Calibre April 2024 Investor Presentation.pdf
20240429 Calibre April 2024 Investor Presentation.pdf20240429 Calibre April 2024 Investor Presentation.pdf
20240429 Calibre April 2024 Investor Presentation.pdf
 
The Economic History of the U.S. Lecture 30.pdf
The Economic History of the U.S. Lecture 30.pdfThe Economic History of the U.S. Lecture 30.pdf
The Economic History of the U.S. Lecture 30.pdf
 
The Economic History of the U.S. Lecture 17.pdf
The Economic History of the U.S. Lecture 17.pdfThe Economic History of the U.S. Lecture 17.pdf
The Economic History of the U.S. Lecture 17.pdf
 
(DIYA) Bhumkar Chowk Call Girls Just Call 7001035870 [ Cash on Delivery ] Pun...
(DIYA) Bhumkar Chowk Call Girls Just Call 7001035870 [ Cash on Delivery ] Pun...(DIYA) Bhumkar Chowk Call Girls Just Call 7001035870 [ Cash on Delivery ] Pun...
(DIYA) Bhumkar Chowk Call Girls Just Call 7001035870 [ Cash on Delivery ] Pun...
 
Veritas Interim Report 1 January–31 March 2024
Veritas Interim Report 1 January–31 March 2024Veritas Interim Report 1 January–31 March 2024
Veritas Interim Report 1 January–31 March 2024
 
The Economic History of the U.S. Lecture 18.pdf
The Economic History of the U.S. Lecture 18.pdfThe Economic History of the U.S. Lecture 18.pdf
The Economic History of the U.S. Lecture 18.pdf
 
The Economic History of the U.S. Lecture 21.pdf
The Economic History of the U.S. Lecture 21.pdfThe Economic History of the U.S. Lecture 21.pdf
The Economic History of the U.S. Lecture 21.pdf
 
High Class Call Girls Nagpur Grishma Call 7001035870 Meet With Nagpur Escorts
High Class Call Girls Nagpur Grishma Call 7001035870 Meet With Nagpur EscortsHigh Class Call Girls Nagpur Grishma Call 7001035870 Meet With Nagpur Escorts
High Class Call Girls Nagpur Grishma Call 7001035870 Meet With Nagpur Escorts
 
The Economic History of the U.S. Lecture 20.pdf
The Economic History of the U.S. Lecture 20.pdfThe Economic History of the U.S. Lecture 20.pdf
The Economic History of the U.S. Lecture 20.pdf
 

We Q2 2014 update

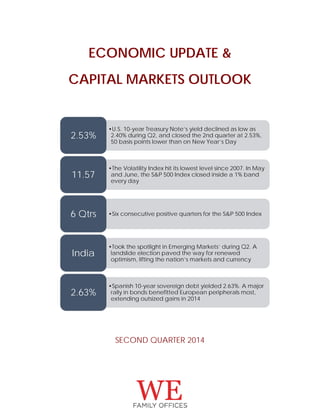
  • 1. ECONOMIC UPDATE & CAPITAL MARKETS OUTLOOK SECOND QUARTER 2014 •U.S. 10-year Treasury Note’s yield declined as low as 2.40% during Q2, and closed the 2nd quarter at 2.53%, 50 basis points lower than on New Year’s Day 2.53% •The Volatility Index hit its lowest level since 2007. In May and June, the S&P 500 Index closed inside a 1% band every day 11.57 •Six consecutive positive quarters for the S&P 500 Index6 Qtrs •Took the spotlight in Emerging Markets’ during Q2. A landslide election paved the way for renewed optimism, lifting the nation’s markets and currency India •Spanish 10-year sovereign debt yielded 2.63%. A major rally in bonds benefitted European peripherals most, extending outsized gains in 2014 2.63%
  • 2. Five things to watch in H2 2014 i. Europe: Economic growth does not appear to be on a higher trajectory. Germany’s GDP slowed before mid-year, so the general theme remains one of high debt and low growth. The ECB announced an aggressive program to further increase liquidity and lending. Ahead, the central bank’s Asset Quality Reviews for the major banks, which are considered vital to revitalize European credit and transparency ii. Geopolitics: After a calm in Ukraine and the Middle East, the 3rd quarter could potentially see a replay of turbulence and volatility in the region. That said, the story for the Emerging Markets as an asset class has shifted in a positive way iii. The Fed: Attention shifts to the Federal Reserve’s timetable to hike interest rates. Tapering of bond purchases appears set to continue its glided path toward an October end-date. So, the countdown to the Fed’s first increase in nearly a decade likely begins in earnest by year-end iv. U.S. GDP: Consensus generally calls for a better 2nd-half. The view is for broad improvement through most sectors of the economy. Housing may be key, as data has disappointed and, as importantly, been a focal point at the Fed v. Asia: Excitement in India after a historic national election deserves attention. Will PM Modi be able to deliver, or at least provide a framework for potential reforms to come? Will foreign investors dive into new opportunities in Asia’s 3rd largest economy? A key factor in India’s favor is the high credibility in the Reserve Bank of India Asset Class Highlights & Implementation Implications •Generally Overweight Cash, as a result of realizing gains and opportunistically look for more favorable entry Overweight Cash •Generally Neutral to Underweight Fixed Income, tactical exposures should focus on: Unconstrained Investment Grade Debt, Opportunistic Credit and Opportunistic Emerging Market Debt Neutral to Underweight Fixed Income •Generally Overweight Equities, tactical exposures should focus on: Blend of Small and Midcap USA, European Equities & Small Cap European Equities, Japan Equities, and Emerging Markets Overweight Equities •Neutral to slightly Overweight Income Producing Real Assets, with tactical exposures focusing on: MLPs & US Energy, while Neutral Commodities and Precious Metals Neutral to Overweight Income Producing Real Assets •Neutral Alternative Strategies, with an underweight in Global Macro and a complete exit of the Managed Futures strategy. Focusing on Event Driven, Relative Value and Equity Long Short Strategies, with tactical exposures towards: Opportunistic credit, Distressed European Assets and Distressed Real- Estate Europe Neutral Alternative Strategies 2
  • 3. Macroeconomics The markets’ upward trajectory unchanged The second quarter of 2014 was positive for stocks and bonds. Stock markets, at home and overseas, focused on better economic growth in spite of a tough U.S. winter, and enjoying nearly record-setting low volatility, withstood the geopolitical turmoil in Ukraine, welcomed a landslide election in India, and benefited from a sharp decline in interest rates across developed markets. At its two quarterly meetings, the Federal Reserve showed confidence an economic rebound was in the works. However, the housing sector continued to lag last year's pace, with annualized comparatives still in decline. In a normal economy housing contributes 4 to 5% to domestic GDP, yet it has remained behind on the curve compared to where the nation's demographics indicate it should be. Higher mortgage rates dented homes sales last year, so the U.S. housing recovery is still incomplete eight years after the sector peaked. The biggest stories of Q2: long-dated U.S. Treasury yields declined to 12-month lows, along with the European Central Bank’s (ECB) much anticipated decision to further ease monetary policy on the continent. Both had ripple effects in the marketplace. A significant drop in bond yields was noted after Q1 GDP was noticeably weaker than consensus forecasts. The fact an already soft number turned sharply negative was surprising, and provoked reassessments of the overall economy: are we indeed on a higher growth trajectory? Or, after much anticipation, would 2014 turn out to be another year of mediocre performance? The Federal Reserve acknowledged the lower growth line in their updated figures for the second-half and calendar year. The Fed’s general theme of broad-based improvement in the economy remains intact, it’s just been pushed-out to the second-half. How that current market and Fed view stacks up to lower bond yields is a bit of a conundrum. For now, the accepted explanation includes a shift to long-term bonds from equities by institutional pension funds, a benign inflation environment, and the tapering of bond purchases by the Fed remaining predictable. Predictions for higher interest rates at the beginning of the year did not come to pass, so one of the questions going forward is: will bond yields continue to decline or reverse course in H2 based on better expected economic growth? The ECB reduced the overnight rate to a new low, followed-up by cutting deposit rates to negative territory for the first time in its 15-year history, and devised new lending programs to inspire an increase in credit from banks to small businesses specifically. As Mr. Draghi has pointed out more than once, this is not a quick fix, simply another lever to create more monetary stimulus in the Euro-zone, and entice the largest commercial institutions with low-rate loans to increase loan portfolios. Ahead of the ECB’s stress test results later this year, that idea may prove a tough sell! Emerging Markets (EM) benefited most from a reversal in market perception. Where the opening quarter saw a continuation of last year’s caution toward the sector, that attitude began to change by the end of Q1. Replacing concerns for local currency valuations, markets focused on low debt-to-growth ratio, high nominal yields vis-à-vis developed markets, and a number of central banks prioritizing the inflation fight with higher rates. The result was a strong increase in fund flows in equities and bonds, initially to cover previous short positions in the asset classes. Later, and throughout the majority of Q2, new flows poured into EM. A very different picture from 12 and even 6 months ago. The U.S. Dollar was relatively stable, though it traded to a new 3-year low (almost $1.40) against the Euro, before steps by the ECB brought the currency pair’s value closer to its price at the start of 2014. The British Pound appreciated vs. all its major counter-parties. In commodities, gold rallied in June to close Q2 on a positive note. Also, copper and Brent, two indicators of economic growth, increased, perhaps giving notice of better days ahead for global growth. 3
  • 4. Global Markets’ Performance Emerging Market sovereign bonds had a strong Q2, up 5%, nearly doubling their YTD performance. The driving force was better U.S. growth combined with optimism in India, and stabilization in China. Outflows turned to inflows ahead of the quarter and continued the pattern well into Q2. The Global Bond Index registered a solid gain, with investors favoring U.S. debt and duration on a relative basis. In a continuation of Q1, the 2nd quarter brought higher prices, partly on remnants of a harsh winter which lowered economic output, but also on anecdotal evidence that pension funds were reallocating to fixed income after a very strong year in equity markets. In addition, the Federal Reserve has stayed-the-course on bond tapering. The Fed’s updated forecast presented a benign view on growth and inflation, and made clear that the ‘lower for longer’ mantra remains the consensus, though it is not unanimous. The S&P 500 Index generated a sixth consecutive quarter of positive returns. After a rocky start in April, it was a smoother ride than experienced in Q1. Interest rates continued to fall, providing further support to the asset class. Strong inflows across developed and developing countries’ markets marked the 2nd quarter. Emerging Markets saw a complete reversal from outflows in Q1, and inflows were consistent and steady. Overseas, Europe and Japan closed in the black. European bourses nearly matched the S&P 500, lifted by the European Central Bank’s promise, implicit and later explicit, to do more to stimulate the continent’s economy, prompted by the ECB’s concern of very low inflation. In Japan, the Nikkei caught fire from late May through the end of June after it struggled to begin the fiscal-year. Q2 saw a second positive performance in gold and crude oil. However, this quarter the ride was bumpy and uneven, with flows and sentiment shifting back & forth, especially for the Midas metal. Oil saw a smoother month-to-month performance. Ongoing geopolitical risks shifted to Iraq from Ukraine late in Q2, and along with signs the U.S. economy had strengthened following a colder than normal winter. 4
  • 5. Equity Market Performance by Country In the developed world, equity prices moved higher in the second quarter of 2014, and more uniformly than in Q1. Japan did best with a flurry in June. Fund flows into Continental Europe began subsiding ahead of quarter-end. The U.S. had a solid April-to-June quarter after marginal gains in Q1. Market expectations of a material pick-up in the economy played a role. Europe’s economy continued to expand, albeit from a very low growth rate. Japan was impacted by concerns that a consumption tax to start the new fiscal-year would slow growth. A tough U.S. winter added to the worries. Expectations the domestic economy could see its best year since well before the financial crisis were later questioned. Australia’s rebound continued in Q2, reaching mid-year with a double-digit gain. Commodity prices were generally higher, providing a lift to share prices and its currency. A mostly favorable second quarter for EM equities, because of better economic data, and a lessening of geopolitical tensions. Capital flows to the sector improved substantially as weeks of outflows reversed course in Q2. First, the Russian-Ukraine crisis, followed by the situation in Iraq, subsided enough to prevent a spike in oil prices. That boosted investor confidence. EM economies are very sensitive to oil prices, which has an outsized effect on inflation and, therefore, interest rates. On a YTD basis, Russia and China proved exceptions in the asset class. Though Russia’s economy has suffered a dramatic slowdown. In contrast, China’s economy showed greater stability, allowing equity prices to enjoy a small recovery in the quarter. India was a special story, the landslide election of PM Modi gave hope and optimism among the population and investors. That said, India’s chronic current account deficit, plus high inflation may make it difficult to maintain very strong YTD returns. 5
  • 6. Currency Performance vs. USD The U.S. Dollar weakened versus a number of EM currencies in Q2, particularly the Colombian Peso and Russian Ruble. The Ruble remains negative YTD. The Indian Rupee softened in Q2 but held on to most of its earlier gains. The Chinese Yuan has been an interesting story in 2014. It recorded a first-half loss for the first time in many years, after appreciating for the better part of eight years. The Chinese government’s concerted effort to stop speculators has been effective YTD. The Brazilian Real has steadily gained the past 6 months, while the Mexican Peso traded a much tighter range vs. the U.S. Dollar. The South African Rand registered a 1% loss in Q2, and 2% YTD, following much the same pattern. Against the Euro, the Dollar recovered from its lowest levels to finish the first-half with a slight gain. The Yen kept its gains vs. the Dollar to close out a very different 1st half than last year. The British Pound touched its highest point in 5 years, up 4% YTD. In the EM space, this divergent performance marks a contrast to last year when almost all EM currencies lost ground to the U.S. Dollar. The Australian Dollar, followed the same path as Brazil’s Real, steadily appreciated against the Dollar quarter-to-quarter…partly due to a better outlook for China, its biggest trading partner and an improving trend in global commodity prices. 6
  • 7. Valuations – Fixed Income U.S. corporate bond spreads narrowed further in the second quarter alongside a material decline in domestic interest rates. Additionally, global bond yields fell in concert with U.S. fixed income. European sovereign debt (peripherals) outperformed. The Fed’s decision to continue tapering its monthly totals at their April and June meetings were anticipated by the markets. The Fed’s position is that tapering is not on a pre-set course, but the bar has been set very high to change the pace and amount of its program. After a quiet start in April, Treasury prices moved substantially higher in May and June, reaching levels not seen in nearly 12 months. On balance, inflows outpaced outflows by a wide margin in Q2. High Yield (HY) spreads moved even lower, to new nominal records vs. U.S. 90-day Treasury Bills. In Washington, the fiscal headwinds have diminished; the multi-year budget agreement has helped remove a good deal of uncertainty. After consolidating in the first quarter, the second quarter saw a return to the previous pattern; spreads narrowed, and risk appetite increased. Emerging Markets (EM) spreads improved with steady inflows. In contrast to Q1, debt did not encounter headwinds from equity outflows, which saw successive weeks of inflows throughout Q2. The sub-asset class built on gains in Q1, as inflows led to higher prices. As in Developed Markets, EM saw a narrowing in interest rate spreads. That pattern stayed intact with U.S. yields descending as well, narrowing differentials. Most important, the markets’ view of EM debt remained positive, helped by still attractive nominal yields vs. DM. In summary, EM headwinds continue to dissipate in response to the Fed’s tapering program. However, in contrast to last quarter, pockets reflecting full valuations are more commonplace. 7
  • 8. Valuations – Equities The S&P 500 Index saw its price-to-earnings (P/E) multiple rise above its historical average. Earnings growth beat expectations for Q1 2014 (the bar was very low). However, revenues remained on the soft side, as has been the case over several consecutive quarters. In 2014, financials have not outperformed, and have actually trailed non-financial corporate earnings. Money center banks have reported mixed results, with investment and mortgage income down in Q1, with a repeat expected in Q2. The MSCI Europe Index P/E ratio moved higher, above its historical average. Historically, European P/E ratios surpass similar readings in the U.S., and with many investors still considering Europe in catch-up mode, some valuations remain attractive. In Q2, monthly flows were overwhelmingly positive, until close to mid-year, when in late June some rotation away from European shares was evident. U.S. flows were mostly positive over the course of the quarter. The MSCI Japan Index recovered in Q2. A steep decline in Q1 followed on the heels of a historic 50% gain, measured in Yen, in 2013. Driven by the sharp bounce and revaluation, the MSCI Japan Index was able to register a positive performance for the calendar year (measured in US Dollars). Finally, the 12-month P/E ratio remains more than one standard deviation below its historical average. In China, Q2 saw a continuation of the last several years. That is, equities were generally out of favor. Stabilization of the general economy has helped at the margins. Among the headwinds: accounting and transparency issues, a slowdown from high growth, and higher interest rates. And, credit creation has slowed. Valuations have not picked-up, and remain one- standard deviation below historical averages. Economic uncertainty has lessened with better manufacturing data, though questions on the longer-term effects of government rebalancing between consumption and investment remain to be answered. 8
  • 9. Sources: Bloomberg LP. Disclaimer: This review contains our current opinions and commentary, and does not represent a recommendation of any particular security, strategy, investment product or manager. The views expressed here are subject to change without notice. Our commentary is distributed for informational and educational purposes only and should not be considered as investment advice or an offer of any security or service for sale. Information contained herein has been obtained from sources we believe to be reliable, but we do not guarantee its completeness or accuracy. No part of this report may be reproduced in any form, or referred to in any other publication, without WE’s written permission. Relevant Indices: AUSTRALIA: Australian Stock Exchange All Ordinaries Index – AUSTRIA: Viena Stock Exchange Austrian Traded Index – BELGIUM: Viena Stock Exchange Austrian Traded Index – BRAZIL: Ibovespa Brazil Sao Paulo Stock Exchange Index – CANADA: S&P/TSX Composite Index – CHILE: Santiago Stock Exchange IPSA Index – CHINA: Shanghai Shenzhen CSI 300 Index – COLOMBIA: Indice General de la Bolsa de Valores de Colombia - CZECH REPUBLIC: Prague Stock Exchange Index – DENMARK: OMX Copengagen 20 Index – EGYPT: Egyptian EGX 30 Price Return Index – FINLAND: OMX Helsinki Index – FRANCE: CAC 40 Index – GERMANY: Deutsche Borse AG German Stock Index DAX – GREECE: Athens Stock Exchange General Index - HONG KONG: Hong Kong Hang Seng Index – HUNGARY: Budapest Stock Exchange Index – INDIA: S&P BSE India Sensex Index – INDONESIA: Jakarta Stock Exchange Composite Index – IRELAND: Irish Stock Exchange Overall Index – ISRAEL: Tel Aviv 25 Index – ITALY: FTSE MIB Index – JAPAN: Nikkei 225 – MALAYSIA: FTSE Bursa Malaysia KLCI Index – MEXICO: Mexican Stock Exchange Bolsa IPC Index – MOROCCO: Madex Free Float Index – NETHERLANDS: AEX-Index - NEW ZEALAND: New Zealand Exchange – NORWAY: Oslo Stock Exchange OBX Price Index – PERU: Bolsa de Valores de Lima General Sector Index – PHILIPPINES: Philippines Stock Exchange PSEi Index – POLAND: Warsaw Stock Exchange Top 20 Index – PORTUGAL: PSI 20 Index – RUSSIA: Russian Trading System Cash Index – SINGAPORE: Straits Times Index STI - SOUTH AFRICA: FTSE/JSE Africa All Share Index - SOUTH KOREA: Korea Stock Exchange Kospi Index – SPAIN: IBEX 35 Index – SWEDEN: OMX Stockholm 30 Index – SWITZERLAND: Swiss Market Index – TAIWAN: Taiwan Stock Exchange Weighted Index – THAILAND: Stock Exchange of Thailand SET Index – TURKEY: Borsa Istanbul Stock Exchange National 100 Index - UNITED KINGDOM: FTSE 100 Index - UNITED STATES: Dow Jones Industrial Average. Global Industrial Bond Spread: USD Global Industrial (BBB) 10-yr vs. Treasury Bill (U.S) 90 Day. High Yield Bond Spread: USD Composite (BB) 5-yr vs. Treasury Bill (U.S) 90 Day. US Bond Spread: USD US (AA) 10-yr vs. Treasury Bill (U.S) 90 Day. Emerging Market Bond Spread: CS Emerging Market Corporate Bond Total Yield vs. Treasury Bill (U.S) 90 Day. 9