Download to read offline


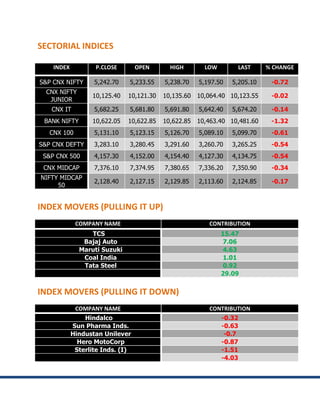


- The Sensex and Nifty indices in India declined slightly on Friday, with the Sensex falling 0.70% and the Nifty dropping 0.72%, led by declines in banking stocks. - Asian stock markets were also down slightly but were on track for their largest weekly gain since January, as strong US corporate earnings lifted the S&P 500 index. - Key Indian stock market indexes such as the BSE Sensex, Nifty 50, and Nifty Bank declined around 1% each while sectoral indices such as IT, metal and realty also ended in red.


