Download to read offline

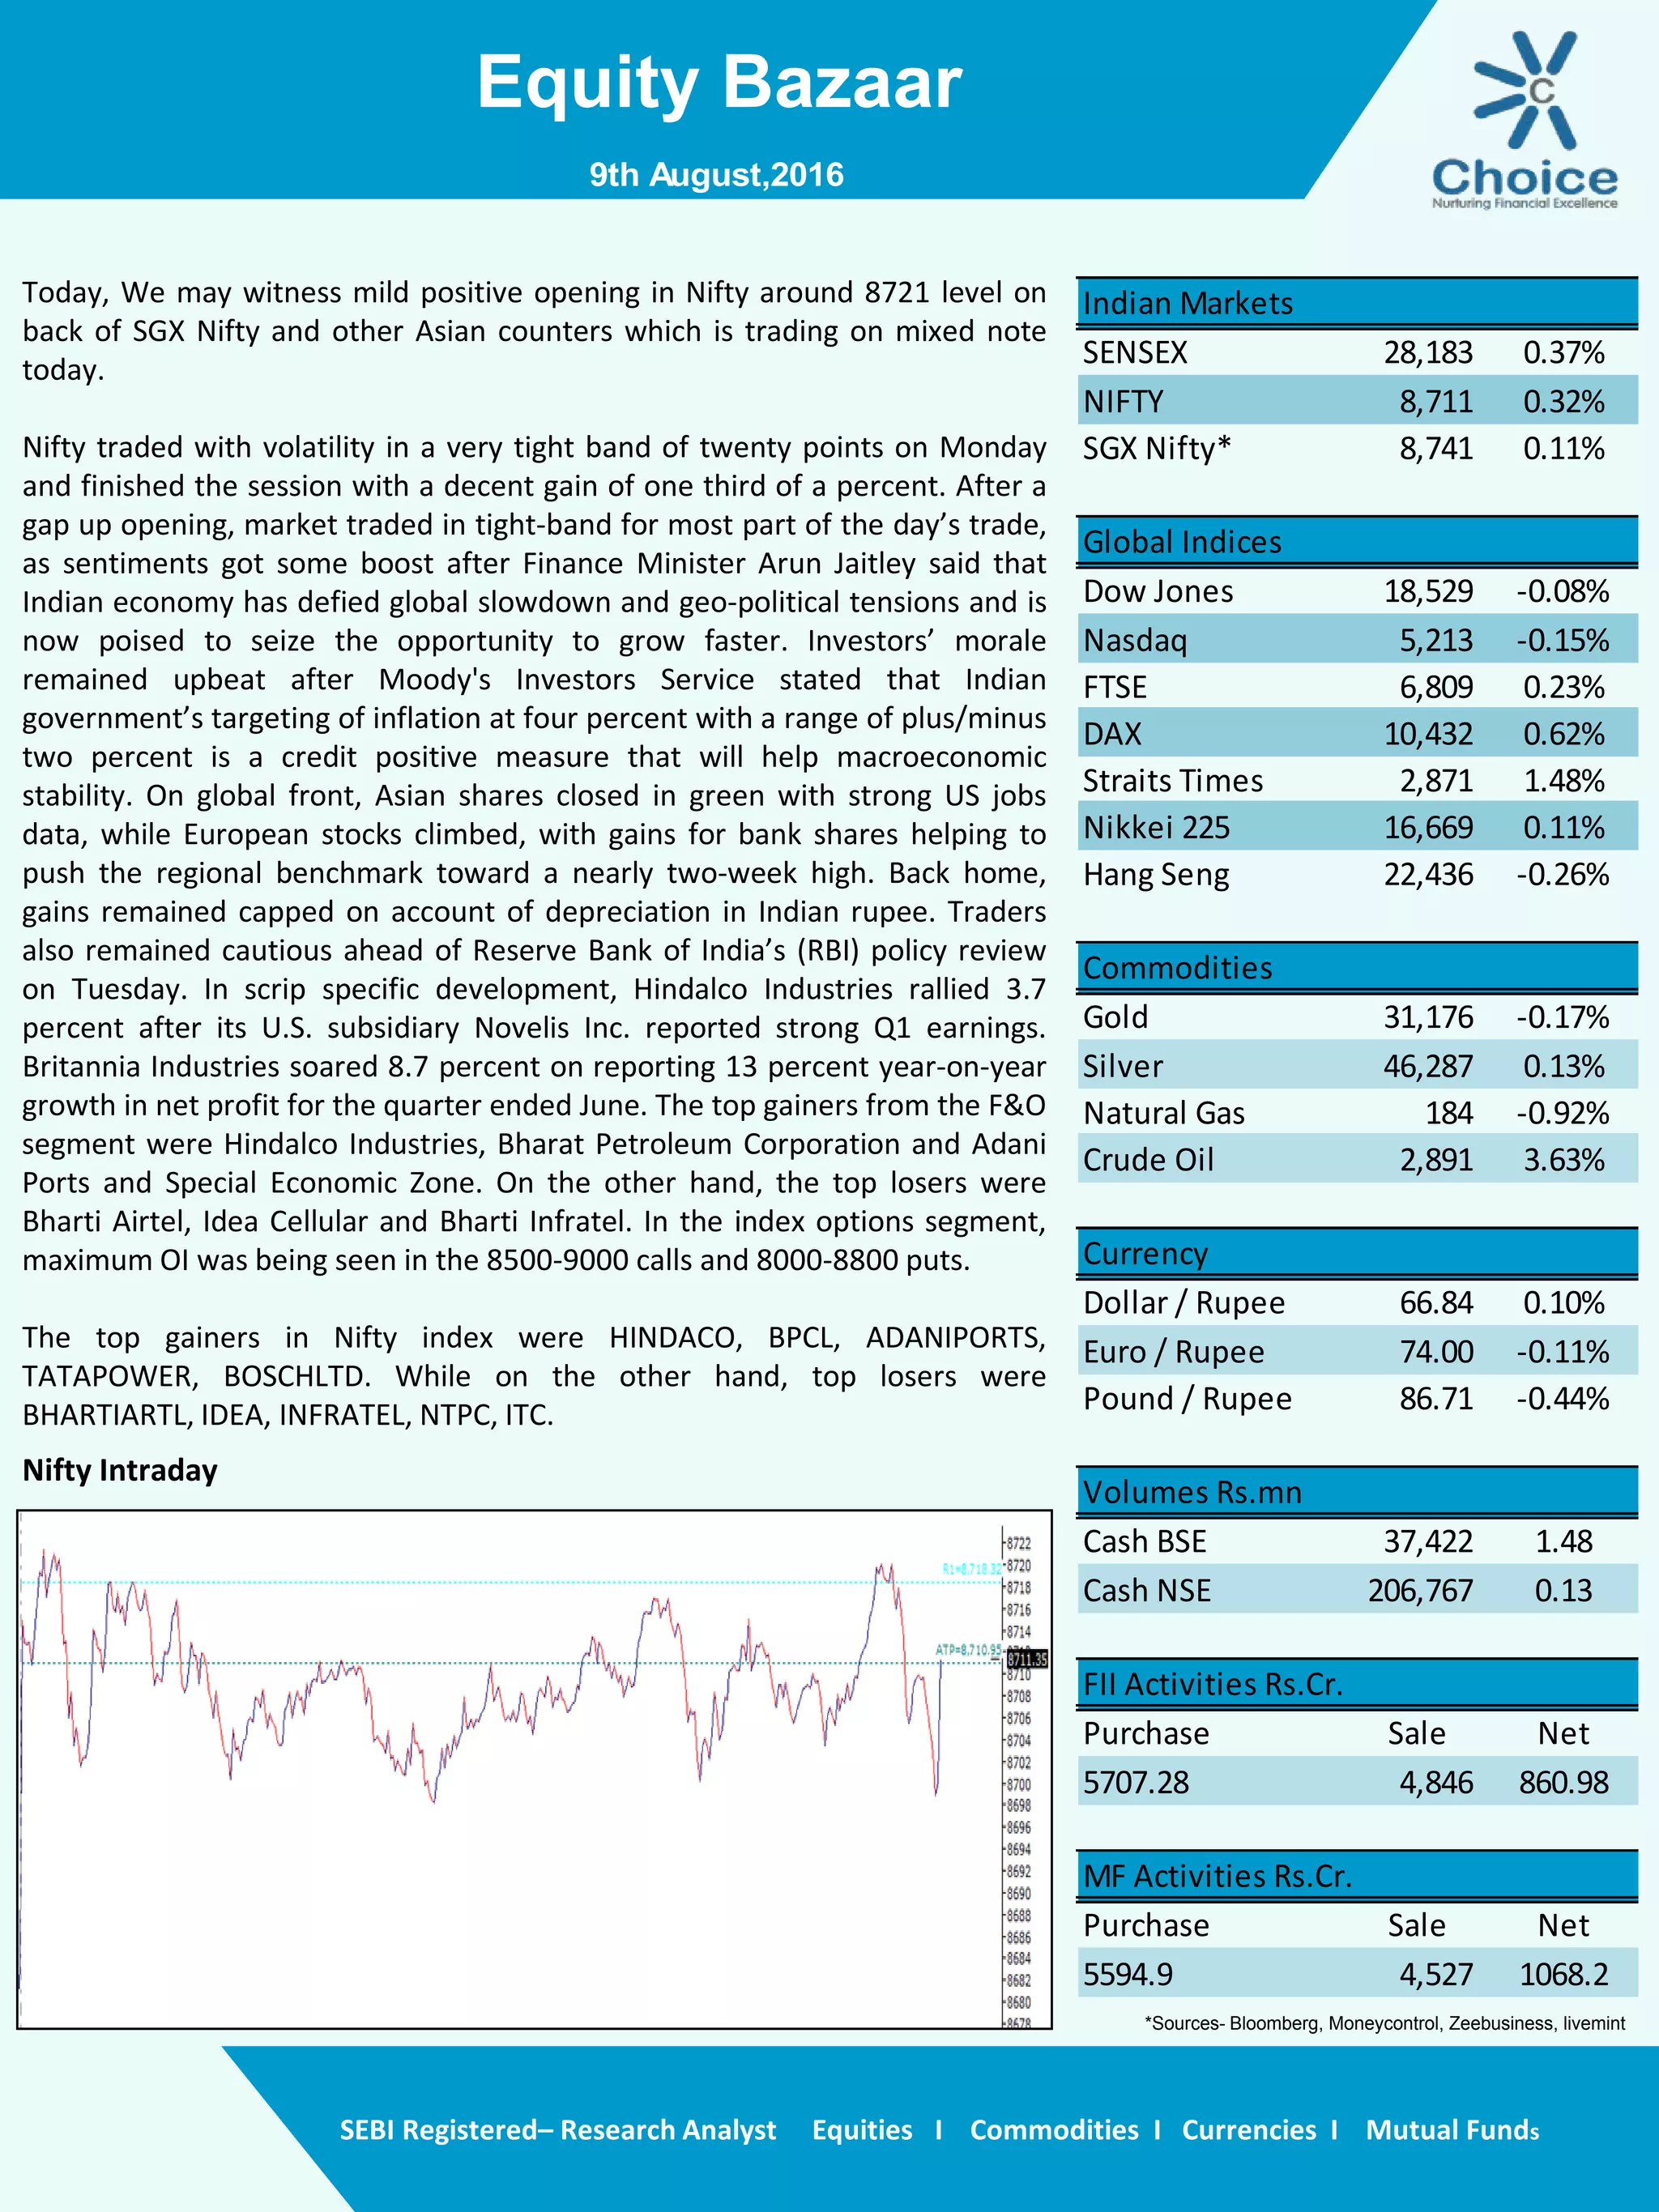


On August 9, 2016, the Nifty may have a mild positive opening influenced by SGX Nifty and mixed Asian markets. The market showed volatility but ended with a gain, buoyed by positive remarks from the finance minister about India's economy and favorable assessments from Moody's. Key stocks like Hindalco and Britannia saw significant gains, while concerns about the depreciation of the Indian rupee and an upcoming RBI policy review kept investors cautious.


