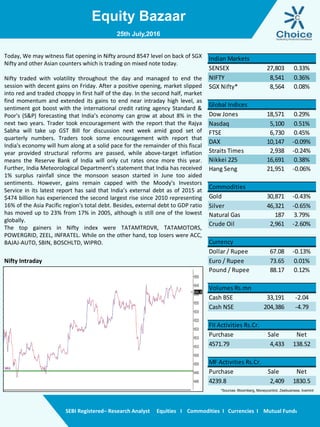
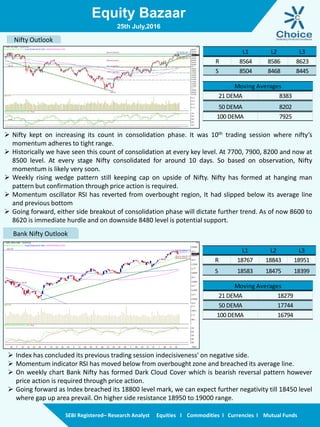
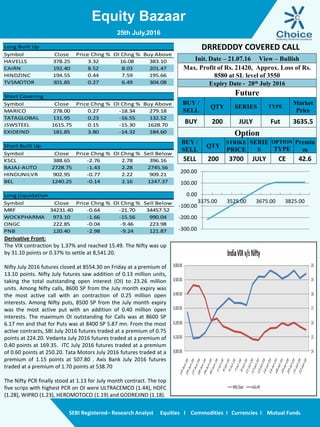
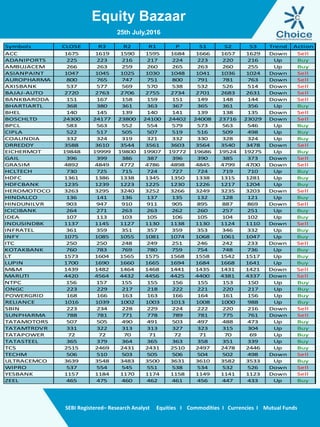
Equity Bazaar
SEBI Registered– Research Analyst Equities I Commodities I Currencies I Mutual Funds
Nifty Intraday
Today, We may witness flat opening in Nifty around 8547 level on back of SGX
Nifty and other Asian counters which is trading on mixed note today.
Nifty traded with volatility throughout the day and managed to end the
session with decent gains on Friday. After a positive opening, market slipped
into red and traded choppy in first half of the day. In the second half, market
find momentum and extended its gains to end near intraday high level, as
sentiment got boost with the international credit rating agency Standard &
Poor's (S&P) forecasting that India’s economy can grow at about 8% in the
next two years. Trader took encouragement with the report that the Rajya
Sabha will take up GST Bill for discussion next week amid good set of
quarterly numbers. Traders took some encouragement with report that
India's economy will hum along at a solid pace for the remainder of this fiscal
year provided structural reforms are passed, while above-target inflation
means the Reserve Bank of India will only cut rates once more this year.
Further, India Meteorological Department’s statement that India has received
1% surplus rainfall since the monsoon season started in June too aided
sentiments. However, gains remain capped with the Moody's Investors
Service in its latest report has said that India’s external debt as of 2015 at
$474 billion has experienced the second largest rise since 2010 representing
16% of the Asia Pacific region's total debt. Besides, external debt to GDP ratio
has moved up to 23% from 17% in 2005, although is still one of the lowest
globally.
The top gainers in Nifty index were TATAMTRDVR, TATAMOTORS,
POWERGRID, ZEEL, INFRATEL. While on the other hand, top losers were ACC,
BAJAJ-AUTO, SBIN, BOSCHLTD, WIPRO.
25th July,2016
SENSEX 27,803 0.33%
NIFTY 8,541 0.36%
SGX Nifty* 8,564 0.08%
Global Indices
Dow Jones 18,571 0.29%
Nasdaq 5,100 0.51%
FTSE 6,730 0.45%
DAX 10,147 -0.09%
Straits Times 2,938 -0.24%
Nikkei 225 16,691 0.38%
Hang Seng 21,951 -0.06%
Commodities
Gold 30,871 -0.43%
Silver 46,321 -0.65%
Natural Gas 187 3.79%
Crude Oil 2,961 -2.60%
Currency
Dollar / Rupee 67.08 -0.13%
Euro / Rupee 73.65 0.01%
Pound / Rupee 88.17 0.12%
Volumes Rs.mn
Cash BSE 33,191 -2.04
Cash NSE 204,386 -4.79
FII Activities Rs.Cr.
Purchase Sale Net
4571.79 4,433 138.52
MF Activities Rs.Cr.
Purchase Sale Net
4239.8 2,409 1830.5
Indian Markets
*Sources- Bloomberg, Moneycontrol, Zeebusiness, livemint
Equity Bazaar
SEBI Registered– Research Analyst Equities I Commodities I Currencies I Mutual Funds
Nifty Outlook
Bank Nifty Outlook
25th July,2016
L1 L2 L3
R 8564 8586 8623
S 8504 8468 8445
21 DEMA 8383
50 DEMA 8202
100 DEMA 7925
Moving Averages
L1 L2 L3
R 18767 18843 18951
S 18583 18475 18399
21 DEMA 18279
50 DEMA 17744
100 DEMA 16794
Moving Averages
 Nifty kept on increasing its count in consolidation phase. It was 10th trading session where nifty’s
momentum adheres to tight range.
 Historically we have seen this count of consolidation at every key level. At 7700, 7900, 8200 and now at
8500 level. At every stage Nifty consolidated for around 10 days. So based on observation, Nifty
momentum is likely very soon.
 Weekly rising wedge pattern still keeping cap on upside of Nifty. Nifty has formed at hanging man
pattern but confirmation through price action is required.
 Momentum oscillator RSI has reverted from overbought region, It had slipped below its average line
and previous bottom
 Going forward, either side breakout of consolidation phase will dictate further trend. As of now 8600 to
8620 is immediate hurdle and on downside 8480 level is potential support.
 Index has concluded its previous trading session indecisiveness' on negative side.
 Momentum indicator RSI has moved below from overbought zone and breached its average line.
 On weekly chart Bank Nifty has formed Dark Cloud Cover which is bearish reversal pattern however
price action is required through price action.
 Going forward as Index breached its 18800 level mark, we can expect further negativity till 18450 level
where gap up area prevail. On higher side resistance 18950 to 19000 range.
Equity Bazaar
SEBI Registered– Research Analyst Equities I Commodities I Currencies I Mutual Funds
Derivative Front:
The VIX contraction by 1.37% and reached 15.49. The Nifty was up
by 31.10 points or 0.37% to settle at 8,541.20.
Nifty July 2016 futures closed at 8554.30 on Friday at a premium of
13.10 points. Nifty July futures saw addition of 0.13 million units,
taking the total outstanding open interest (OI) to 23.26 million
units. Among Nifty calls, 8600 SP from the July month expiry was
the most active call with an contraction of 0.25 million open
interests. Among Nifty puts, 8500 SP from the July month expiry
was the most active put with an addition of 0.40 million open
interests. The maximum OI outstanding for Calls was at 8600 SP
6.17 mn and that for Puts was at 8400 SP 5.87 mn. From the most
active contracts, SBI July 2016 futures traded at a premium of 0.75
points at 224.20. Vedanta July 2016 futures traded at a premium of
0.40 points at 169.35. ITC July 2016 futures traded at a premium
of 0.60 points at 250.20. Tata Motors July 2016 futures traded at a
premium of 1.15 points at 507.80 . Axis Bank July 2016 futures
traded at a premium of 1.70 points at 538.70
The Nifty PCR finally stood at 1.13 for July month contract. The top
five scrips with highest PCR on OI were ULTRACEMCO (1.44), HDFC
(1.28), WIPRO (1.23), HEROMOTOCO (1.19) and GODREJIND (1.18).
25th July,2016
Long Built Up
Symbol Close Price Chng % OI Chng % Buy Above
HAVELLS 378.25 3.32 16.08 383.10
CAIRN 192.40 8.52 8.03 201.47
HINDZINC 194.55 0.44 7.59 195.66
TVSMOTOR 301.85 0.27 6.49 304.08
Short Covering
Symbol Close Price Chng % OI Chng % Buy Above
MARICO 278.00 0.27 -18.34 279.18
TATAGLOBAL 131.95 0.23 -16.55 132.52
JSWSTEEL 1615.75 0.15 -15.30 1628.70
EXIDEIND 181.85 3.80 -14.32 184.60
Short Built Up
Symbol Close Price Chng % OI Chng % Sell Below
KSCL 388.65 -2.76 2.78 396.16
BAJAJ-AUTO 2728.75 -1.43 2.28 2745.56
HINDUNILVR 902.95 -0.77 2.22 909.21
BEL 1240.25 -0.14 2.16 1247.37
Long Liquidation
Symbol Close Price Chng % OI Chng % Sell Below
MRF 34231.40 -0.64 -21.70 34457.52
WOCKPHARMA 973.10 -1.66 -15.56 990.04
ONGC 222.85 -0.04 -9.46 223.98
PNB 120.40 -2.98 -9.24 121.87
Init. Date – 21.07.16 View – Bullish
Max. Profit of Rs. 21420, Approx. Loss of Rs.
8580 at SL level of 3550
Expiry Date - 28th July 2016
Future
BUY /
SELL
QTY SERIES TYPE
Market
Price
BUY 200 JULY Fut 3635.5
Option
BUY /
SELL
QTY
STRIKE
PRICE
SERIE
S
OPTION
TYPE
Premiu
m
SELL 200 3700 JULY CE 42.6
DRREDDDY COVERED CALL
-300.00
-200.00
-100.00
0.00
100.00
200.00
3375.00 3525.00 3675.00 3825.00
Equity Bazaar
SEBI Registered– Research Analyst Equities I Commodities I Currencies I Mutual Funds
25th July,2016
Symbols CLOSE R3 R2 R1 P S1 S2 S3 Trend Action
ACC 1675 1619 1590 1595 1684 1666 1657 1629 Down Sell
ADANIPORTS 225 223 216 217 224 223 220 216 Up Buy
AMBUJACEM 266 263 259 260 265 263 260 255 Up Buy
ASIANPAINT 1047 1045 1025 1030 1048 1041 1036 1024 Down Sell
AUROPHARMA 800 765 747 751 800 791 781 763 Down Sell
AXISBANK 537 577 569 570 538 532 526 514 Down Sell
BAJAJ-AUTO 2720 2763 2706 2755 2734 2701 2683 2631 Down Sell
BANKBARODA 151 167 158 159 151 149 148 144 Down Sell
BHARTIARTL 368 380 361 363 367 365 361 356 Up Buy
BHEL 140 145 139 140 141 139 138 135 Down Sell
BOSCHLTD 24300 24177 23800 24100 24402 24008 23716 23029 Down Sell
BPCL 583 563 552 554 579 573 563 546 Up Buy
CIPLA 522 517 505 507 519 516 509 498 Up Buy
COALINDIA 332 324 319 321 332 330 328 324 Up Buy
DRREDDY 3588 3610 3544 3561 3603 3564 3540 3478 Down Sell
EICHERMOT 19848 19999 19800 19907 19772 19686 19524 19275 Up Buy
GAIL 396 399 386 387 396 390 385 373 Down Sell
GRASIM 4892 4849 4772 4786 4898 4845 4799 4700 Down Sell
HCLTECH 730 725 715 724 727 724 719 710 Up Buy
HDFC 1361 1386 1338 1345 1350 1338 1315 1281 Up Buy
HDFCBANK 1235 1239 1223 1225 1230 1226 1217 1204 Up Buy
HEROMOTOCO 3263 3295 3240 3252 3266 3249 3235 3203 Down Sell
HINDALCO 136 141 136 137 135 132 128 121 Up Buy
HINDUNILVR 903 947 910 911 905 895 887 869 Down Sell
ICICIBANK 264 271 263 263 262 260 257 251 Up Buy
IDEA 107 113 103 105 106 105 104 102 Up Buy
INDUSINDBK 1137 1145 1127 1130 1138 1130 1124 1110 Down Sell
INFRATEL 361 359 351 357 359 353 346 332 Up Buy
INFY 1075 1085 1055 1081 1074 1068 1061 1047 Up Buy
ITC 250 250 248 249 251 246 242 233 Down Sell
KOTAKBANK 760 783 769 780 759 754 748 736 Up Buy
LT 1573 1604 1565 1575 1568 1558 1542 1517 Up Buy
LUPIN 1700 1690 1660 1665 1694 1684 1668 1641 Up Buy
M&M 1439 1482 1464 1468 1441 1435 1431 1421 Down Sell
MARUTI 4420 4564 4432 4456 4425 4400 4381 4337 Down Sell
NTPC 156 157 155 155 156 155 153 150 Up Buy
ONGC 223 229 217 218 222 221 220 217 Up Buy
POWERGRID 168 166 163 163 166 164 161 156 Up Buy
RELIANCE 1016 1039 1002 1003 1013 1008 1000 988 Up Buy
SBIN 223 234 228 229 224 222 220 216 Down Sell
SUNPHARMA 788 781 771 778 789 781 775 761 Down Sell
TATAMOTORS 507 505 490 491 503 497 488 473 Up Buy
TATAMTRDVR 331 322 313 313 327 323 315 304 Up Buy
TATAPOWER 72 72 70 71 72 71 70 69 Up Buy
TATASTEEL 365 379 364 365 363 358 351 339 Up Buy
TCS 2515 2469 2431 2431 2510 2497 2478 2446 Up Buy
TECHM 506 510 503 505 506 504 502 498 Down Sell
ULTRACEMCO 3639 3548 3483 3500 3631 3610 3582 3533 Up Buy
WIPRO 537 554 545 551 538 534 532 526 Down Sell
YESBANK 1157 1184 1170 1174 1158 1149 1141 1123 Down Sell
ZEEL 465 475 460 462 461 456 447 433 Up Buy
Equity Bazaar
SEBI Registered– Research Analyst Equities I Commodities I Currencies I Mutual Funds
Contact Us
www.choiceindia.com
Kunal Parmar
Research Associate
kunal.parmar@choiceindia.com
Vikas Chaudhari
Research Associate
vikas.chaudhari@choiceindia.com
www.choiceindia.comcustomercare@choiceindia.com
Disclaimer
This is solely for information of clients of Choice Broking and does not construe to be an investment advice. It is also not intended as an offer or solicitation for the purchase and sale of any financial
instruments. Any action taken by you on the basis of the information contained herein is your responsibility alone and Choice Broking its subsidiaries or its employees or associates will not be liable in
any manner for the consequences of such action taken by you. We have exercised due diligence in checking the correctness and authenticity of the information contained in this recommendation, but
Choice Broking or any of its subsidiaries or associates or employees shall not be in any way responsible for any loss or damage that may arise to any person from any inadvertent error in the
information contained in this recommendation or any action taken on basis of this information. Technical analysis studies market psychology, price patterns and volume levels. It is used to forecast
future price and market movements. Technical analysis is complementary to fundamental analysis and news sources. The recommendations issued herewith might be contrary to recommendations
issued by Choice Broking in the company research undertaken as the recommendations stated in this report is derived purely from technical analysis. Choice Broking has based this document on
information obtained from sources it believes to be reliable but which it has not independently verified; Choice Broking makes no guarantee, representation or warranty and accepts no responsibility
or liability as to its accuracy or completeness. The opinions contained within the report are based upon publicly available information at the time of publication and are subject to change without
notice. The information and any disclosures provided herein are in summary form and have been prepared for informational purposes. The recommendations and suggested price levels are intended
purely for trading purposes. The recommendations are valid for the day of the report however trading trends and volumes might vary substantially on an intraday basis and the recommendations may
be subject to change. The information and any disclosures provided herein may be considered confidential. Any use, distribution, modification, copying, forwarding or disclosure by any person is
strictly prohibited. The information and any disclosures provided herein do not constitute a solicitation or offer to purchase or sell any security or other financial product or instrument. The current
performance may be unaudited. Past performance does not guarantee future returns. There can be no assurance that investments will achieve any targeted rates of return, and there is no guarantee
against the loss of your entire investment.
POTENTIAL CONFLICT OF INTEREST DISCLOSURE (as on date of report) Disclosure of interest statement – • Analyst interest of the stock /Instrument(s): - No. • Firm interest of the stock /
Instrument (s): - No.
Amit Pathania
Research Associate
amit.pathania@choiceindia.com
25th July,2016
Kapil Shah
Research Associate
kapil.shah@choiceindia.com
Kapil Shah
Digitally signed by Kapil Shah
DN: cn=Kapil Shah, o=Choice Equity Pvt Ltd,
ou=Research Team,
email=kapil.shah@choiceindia.com, c=US
Date: 2016.07.25 08:36:17 +05'30'

Equity bazaar 25.07.2016

  • 1.
    Equity Bazaar SEBI Registered–Research Analyst Equities I Commodities I Currencies I Mutual Funds Nifty Intraday Today, We may witness flat opening in Nifty around 8547 level on back of SGX Nifty and other Asian counters which is trading on mixed note today. Nifty traded with volatility throughout the day and managed to end the session with decent gains on Friday. After a positive opening, market slipped into red and traded choppy in first half of the day. In the second half, market find momentum and extended its gains to end near intraday high level, as sentiment got boost with the international credit rating agency Standard & Poor's (S&P) forecasting that India’s economy can grow at about 8% in the next two years. Trader took encouragement with the report that the Rajya Sabha will take up GST Bill for discussion next week amid good set of quarterly numbers. Traders took some encouragement with report that India's economy will hum along at a solid pace for the remainder of this fiscal year provided structural reforms are passed, while above-target inflation means the Reserve Bank of India will only cut rates once more this year. Further, India Meteorological Department’s statement that India has received 1% surplus rainfall since the monsoon season started in June too aided sentiments. However, gains remain capped with the Moody's Investors Service in its latest report has said that India’s external debt as of 2015 at $474 billion has experienced the second largest rise since 2010 representing 16% of the Asia Pacific region's total debt. Besides, external debt to GDP ratio has moved up to 23% from 17% in 2005, although is still one of the lowest globally. The top gainers in Nifty index were TATAMTRDVR, TATAMOTORS, POWERGRID, ZEEL, INFRATEL. While on the other hand, top losers were ACC, BAJAJ-AUTO, SBIN, BOSCHLTD, WIPRO. 25th July,2016 SENSEX 27,803 0.33% NIFTY 8,541 0.36% SGX Nifty* 8,564 0.08% Global Indices Dow Jones 18,571 0.29% Nasdaq 5,100 0.51% FTSE 6,730 0.45% DAX 10,147 -0.09% Straits Times 2,938 -0.24% Nikkei 225 16,691 0.38% Hang Seng 21,951 -0.06% Commodities Gold 30,871 -0.43% Silver 46,321 -0.65% Natural Gas 187 3.79% Crude Oil 2,961 -2.60% Currency Dollar / Rupee 67.08 -0.13% Euro / Rupee 73.65 0.01% Pound / Rupee 88.17 0.12% Volumes Rs.mn Cash BSE 33,191 -2.04 Cash NSE 204,386 -4.79 FII Activities Rs.Cr. Purchase Sale Net 4571.79 4,433 138.52 MF Activities Rs.Cr. Purchase Sale Net 4239.8 2,409 1830.5 Indian Markets *Sources- Bloomberg, Moneycontrol, Zeebusiness, livemint
  • 2.
    Equity Bazaar SEBI Registered–Research Analyst Equities I Commodities I Currencies I Mutual Funds Nifty Outlook Bank Nifty Outlook 25th July,2016 L1 L2 L3 R 8564 8586 8623 S 8504 8468 8445 21 DEMA 8383 50 DEMA 8202 100 DEMA 7925 Moving Averages L1 L2 L3 R 18767 18843 18951 S 18583 18475 18399 21 DEMA 18279 50 DEMA 17744 100 DEMA 16794 Moving Averages  Nifty kept on increasing its count in consolidation phase. It was 10th trading session where nifty’s momentum adheres to tight range.  Historically we have seen this count of consolidation at every key level. At 7700, 7900, 8200 and now at 8500 level. At every stage Nifty consolidated for around 10 days. So based on observation, Nifty momentum is likely very soon.  Weekly rising wedge pattern still keeping cap on upside of Nifty. Nifty has formed at hanging man pattern but confirmation through price action is required.  Momentum oscillator RSI has reverted from overbought region, It had slipped below its average line and previous bottom  Going forward, either side breakout of consolidation phase will dictate further trend. As of now 8600 to 8620 is immediate hurdle and on downside 8480 level is potential support.  Index has concluded its previous trading session indecisiveness' on negative side.  Momentum indicator RSI has moved below from overbought zone and breached its average line.  On weekly chart Bank Nifty has formed Dark Cloud Cover which is bearish reversal pattern however price action is required through price action.  Going forward as Index breached its 18800 level mark, we can expect further negativity till 18450 level where gap up area prevail. On higher side resistance 18950 to 19000 range.
  • 3.
    Equity Bazaar SEBI Registered–Research Analyst Equities I Commodities I Currencies I Mutual Funds Derivative Front: The VIX contraction by 1.37% and reached 15.49. The Nifty was up by 31.10 points or 0.37% to settle at 8,541.20. Nifty July 2016 futures closed at 8554.30 on Friday at a premium of 13.10 points. Nifty July futures saw addition of 0.13 million units, taking the total outstanding open interest (OI) to 23.26 million units. Among Nifty calls, 8600 SP from the July month expiry was the most active call with an contraction of 0.25 million open interests. Among Nifty puts, 8500 SP from the July month expiry was the most active put with an addition of 0.40 million open interests. The maximum OI outstanding for Calls was at 8600 SP 6.17 mn and that for Puts was at 8400 SP 5.87 mn. From the most active contracts, SBI July 2016 futures traded at a premium of 0.75 points at 224.20. Vedanta July 2016 futures traded at a premium of 0.40 points at 169.35. ITC July 2016 futures traded at a premium of 0.60 points at 250.20. Tata Motors July 2016 futures traded at a premium of 1.15 points at 507.80 . Axis Bank July 2016 futures traded at a premium of 1.70 points at 538.70 The Nifty PCR finally stood at 1.13 for July month contract. The top five scrips with highest PCR on OI were ULTRACEMCO (1.44), HDFC (1.28), WIPRO (1.23), HEROMOTOCO (1.19) and GODREJIND (1.18). 25th July,2016 Long Built Up Symbol Close Price Chng % OI Chng % Buy Above HAVELLS 378.25 3.32 16.08 383.10 CAIRN 192.40 8.52 8.03 201.47 HINDZINC 194.55 0.44 7.59 195.66 TVSMOTOR 301.85 0.27 6.49 304.08 Short Covering Symbol Close Price Chng % OI Chng % Buy Above MARICO 278.00 0.27 -18.34 279.18 TATAGLOBAL 131.95 0.23 -16.55 132.52 JSWSTEEL 1615.75 0.15 -15.30 1628.70 EXIDEIND 181.85 3.80 -14.32 184.60 Short Built Up Symbol Close Price Chng % OI Chng % Sell Below KSCL 388.65 -2.76 2.78 396.16 BAJAJ-AUTO 2728.75 -1.43 2.28 2745.56 HINDUNILVR 902.95 -0.77 2.22 909.21 BEL 1240.25 -0.14 2.16 1247.37 Long Liquidation Symbol Close Price Chng % OI Chng % Sell Below MRF 34231.40 -0.64 -21.70 34457.52 WOCKPHARMA 973.10 -1.66 -15.56 990.04 ONGC 222.85 -0.04 -9.46 223.98 PNB 120.40 -2.98 -9.24 121.87 Init. Date – 21.07.16 View – Bullish Max. Profit of Rs. 21420, Approx. Loss of Rs. 8580 at SL level of 3550 Expiry Date - 28th July 2016 Future BUY / SELL QTY SERIES TYPE Market Price BUY 200 JULY Fut 3635.5 Option BUY / SELL QTY STRIKE PRICE SERIE S OPTION TYPE Premiu m SELL 200 3700 JULY CE 42.6 DRREDDDY COVERED CALL -300.00 -200.00 -100.00 0.00 100.00 200.00 3375.00 3525.00 3675.00 3825.00
  • 4.
    Equity Bazaar SEBI Registered–Research Analyst Equities I Commodities I Currencies I Mutual Funds 25th July,2016 Symbols CLOSE R3 R2 R1 P S1 S2 S3 Trend Action ACC 1675 1619 1590 1595 1684 1666 1657 1629 Down Sell ADANIPORTS 225 223 216 217 224 223 220 216 Up Buy AMBUJACEM 266 263 259 260 265 263 260 255 Up Buy ASIANPAINT 1047 1045 1025 1030 1048 1041 1036 1024 Down Sell AUROPHARMA 800 765 747 751 800 791 781 763 Down Sell AXISBANK 537 577 569 570 538 532 526 514 Down Sell BAJAJ-AUTO 2720 2763 2706 2755 2734 2701 2683 2631 Down Sell BANKBARODA 151 167 158 159 151 149 148 144 Down Sell BHARTIARTL 368 380 361 363 367 365 361 356 Up Buy BHEL 140 145 139 140 141 139 138 135 Down Sell BOSCHLTD 24300 24177 23800 24100 24402 24008 23716 23029 Down Sell BPCL 583 563 552 554 579 573 563 546 Up Buy CIPLA 522 517 505 507 519 516 509 498 Up Buy COALINDIA 332 324 319 321 332 330 328 324 Up Buy DRREDDY 3588 3610 3544 3561 3603 3564 3540 3478 Down Sell EICHERMOT 19848 19999 19800 19907 19772 19686 19524 19275 Up Buy GAIL 396 399 386 387 396 390 385 373 Down Sell GRASIM 4892 4849 4772 4786 4898 4845 4799 4700 Down Sell HCLTECH 730 725 715 724 727 724 719 710 Up Buy HDFC 1361 1386 1338 1345 1350 1338 1315 1281 Up Buy HDFCBANK 1235 1239 1223 1225 1230 1226 1217 1204 Up Buy HEROMOTOCO 3263 3295 3240 3252 3266 3249 3235 3203 Down Sell HINDALCO 136 141 136 137 135 132 128 121 Up Buy HINDUNILVR 903 947 910 911 905 895 887 869 Down Sell ICICIBANK 264 271 263 263 262 260 257 251 Up Buy IDEA 107 113 103 105 106 105 104 102 Up Buy INDUSINDBK 1137 1145 1127 1130 1138 1130 1124 1110 Down Sell INFRATEL 361 359 351 357 359 353 346 332 Up Buy INFY 1075 1085 1055 1081 1074 1068 1061 1047 Up Buy ITC 250 250 248 249 251 246 242 233 Down Sell KOTAKBANK 760 783 769 780 759 754 748 736 Up Buy LT 1573 1604 1565 1575 1568 1558 1542 1517 Up Buy LUPIN 1700 1690 1660 1665 1694 1684 1668 1641 Up Buy M&M 1439 1482 1464 1468 1441 1435 1431 1421 Down Sell MARUTI 4420 4564 4432 4456 4425 4400 4381 4337 Down Sell NTPC 156 157 155 155 156 155 153 150 Up Buy ONGC 223 229 217 218 222 221 220 217 Up Buy POWERGRID 168 166 163 163 166 164 161 156 Up Buy RELIANCE 1016 1039 1002 1003 1013 1008 1000 988 Up Buy SBIN 223 234 228 229 224 222 220 216 Down Sell SUNPHARMA 788 781 771 778 789 781 775 761 Down Sell TATAMOTORS 507 505 490 491 503 497 488 473 Up Buy TATAMTRDVR 331 322 313 313 327 323 315 304 Up Buy TATAPOWER 72 72 70 71 72 71 70 69 Up Buy TATASTEEL 365 379 364 365 363 358 351 339 Up Buy TCS 2515 2469 2431 2431 2510 2497 2478 2446 Up Buy TECHM 506 510 503 505 506 504 502 498 Down Sell ULTRACEMCO 3639 3548 3483 3500 3631 3610 3582 3533 Up Buy WIPRO 537 554 545 551 538 534 532 526 Down Sell YESBANK 1157 1184 1170 1174 1158 1149 1141 1123 Down Sell ZEEL 465 475 460 462 461 456 447 433 Up Buy
  • 5.
    Equity Bazaar SEBI Registered–Research Analyst Equities I Commodities I Currencies I Mutual Funds Contact Us www.choiceindia.com Kunal Parmar Research Associate kunal.parmar@choiceindia.com Vikas Chaudhari Research Associate vikas.chaudhari@choiceindia.com www.choiceindia.comcustomercare@choiceindia.com Disclaimer This is solely for information of clients of Choice Broking and does not construe to be an investment advice. It is also not intended as an offer or solicitation for the purchase and sale of any financial instruments. Any action taken by you on the basis of the information contained herein is your responsibility alone and Choice Broking its subsidiaries or its employees or associates will not be liable in any manner for the consequences of such action taken by you. We have exercised due diligence in checking the correctness and authenticity of the information contained in this recommendation, but Choice Broking or any of its subsidiaries or associates or employees shall not be in any way responsible for any loss or damage that may arise to any person from any inadvertent error in the information contained in this recommendation or any action taken on basis of this information. Technical analysis studies market psychology, price patterns and volume levels. It is used to forecast future price and market movements. Technical analysis is complementary to fundamental analysis and news sources. The recommendations issued herewith might be contrary to recommendations issued by Choice Broking in the company research undertaken as the recommendations stated in this report is derived purely from technical analysis. Choice Broking has based this document on information obtained from sources it believes to be reliable but which it has not independently verified; Choice Broking makes no guarantee, representation or warranty and accepts no responsibility or liability as to its accuracy or completeness. The opinions contained within the report are based upon publicly available information at the time of publication and are subject to change without notice. The information and any disclosures provided herein are in summary form and have been prepared for informational purposes. The recommendations and suggested price levels are intended purely for trading purposes. The recommendations are valid for the day of the report however trading trends and volumes might vary substantially on an intraday basis and the recommendations may be subject to change. The information and any disclosures provided herein may be considered confidential. Any use, distribution, modification, copying, forwarding or disclosure by any person is strictly prohibited. The information and any disclosures provided herein do not constitute a solicitation or offer to purchase or sell any security or other financial product or instrument. The current performance may be unaudited. Past performance does not guarantee future returns. There can be no assurance that investments will achieve any targeted rates of return, and there is no guarantee against the loss of your entire investment. POTENTIAL CONFLICT OF INTEREST DISCLOSURE (as on date of report) Disclosure of interest statement – • Analyst interest of the stock /Instrument(s): - No. • Firm interest of the stock / Instrument (s): - No. Amit Pathania Research Associate amit.pathania@choiceindia.com 25th July,2016 Kapil Shah Research Associate kapil.shah@choiceindia.com Kapil Shah Digitally signed by Kapil Shah DN: cn=Kapil Shah, o=Choice Equity Pvt Ltd, ou=Research Team, email=kapil.shah@choiceindia.com, c=US Date: 2016.07.25 08:36:17 +05'30'