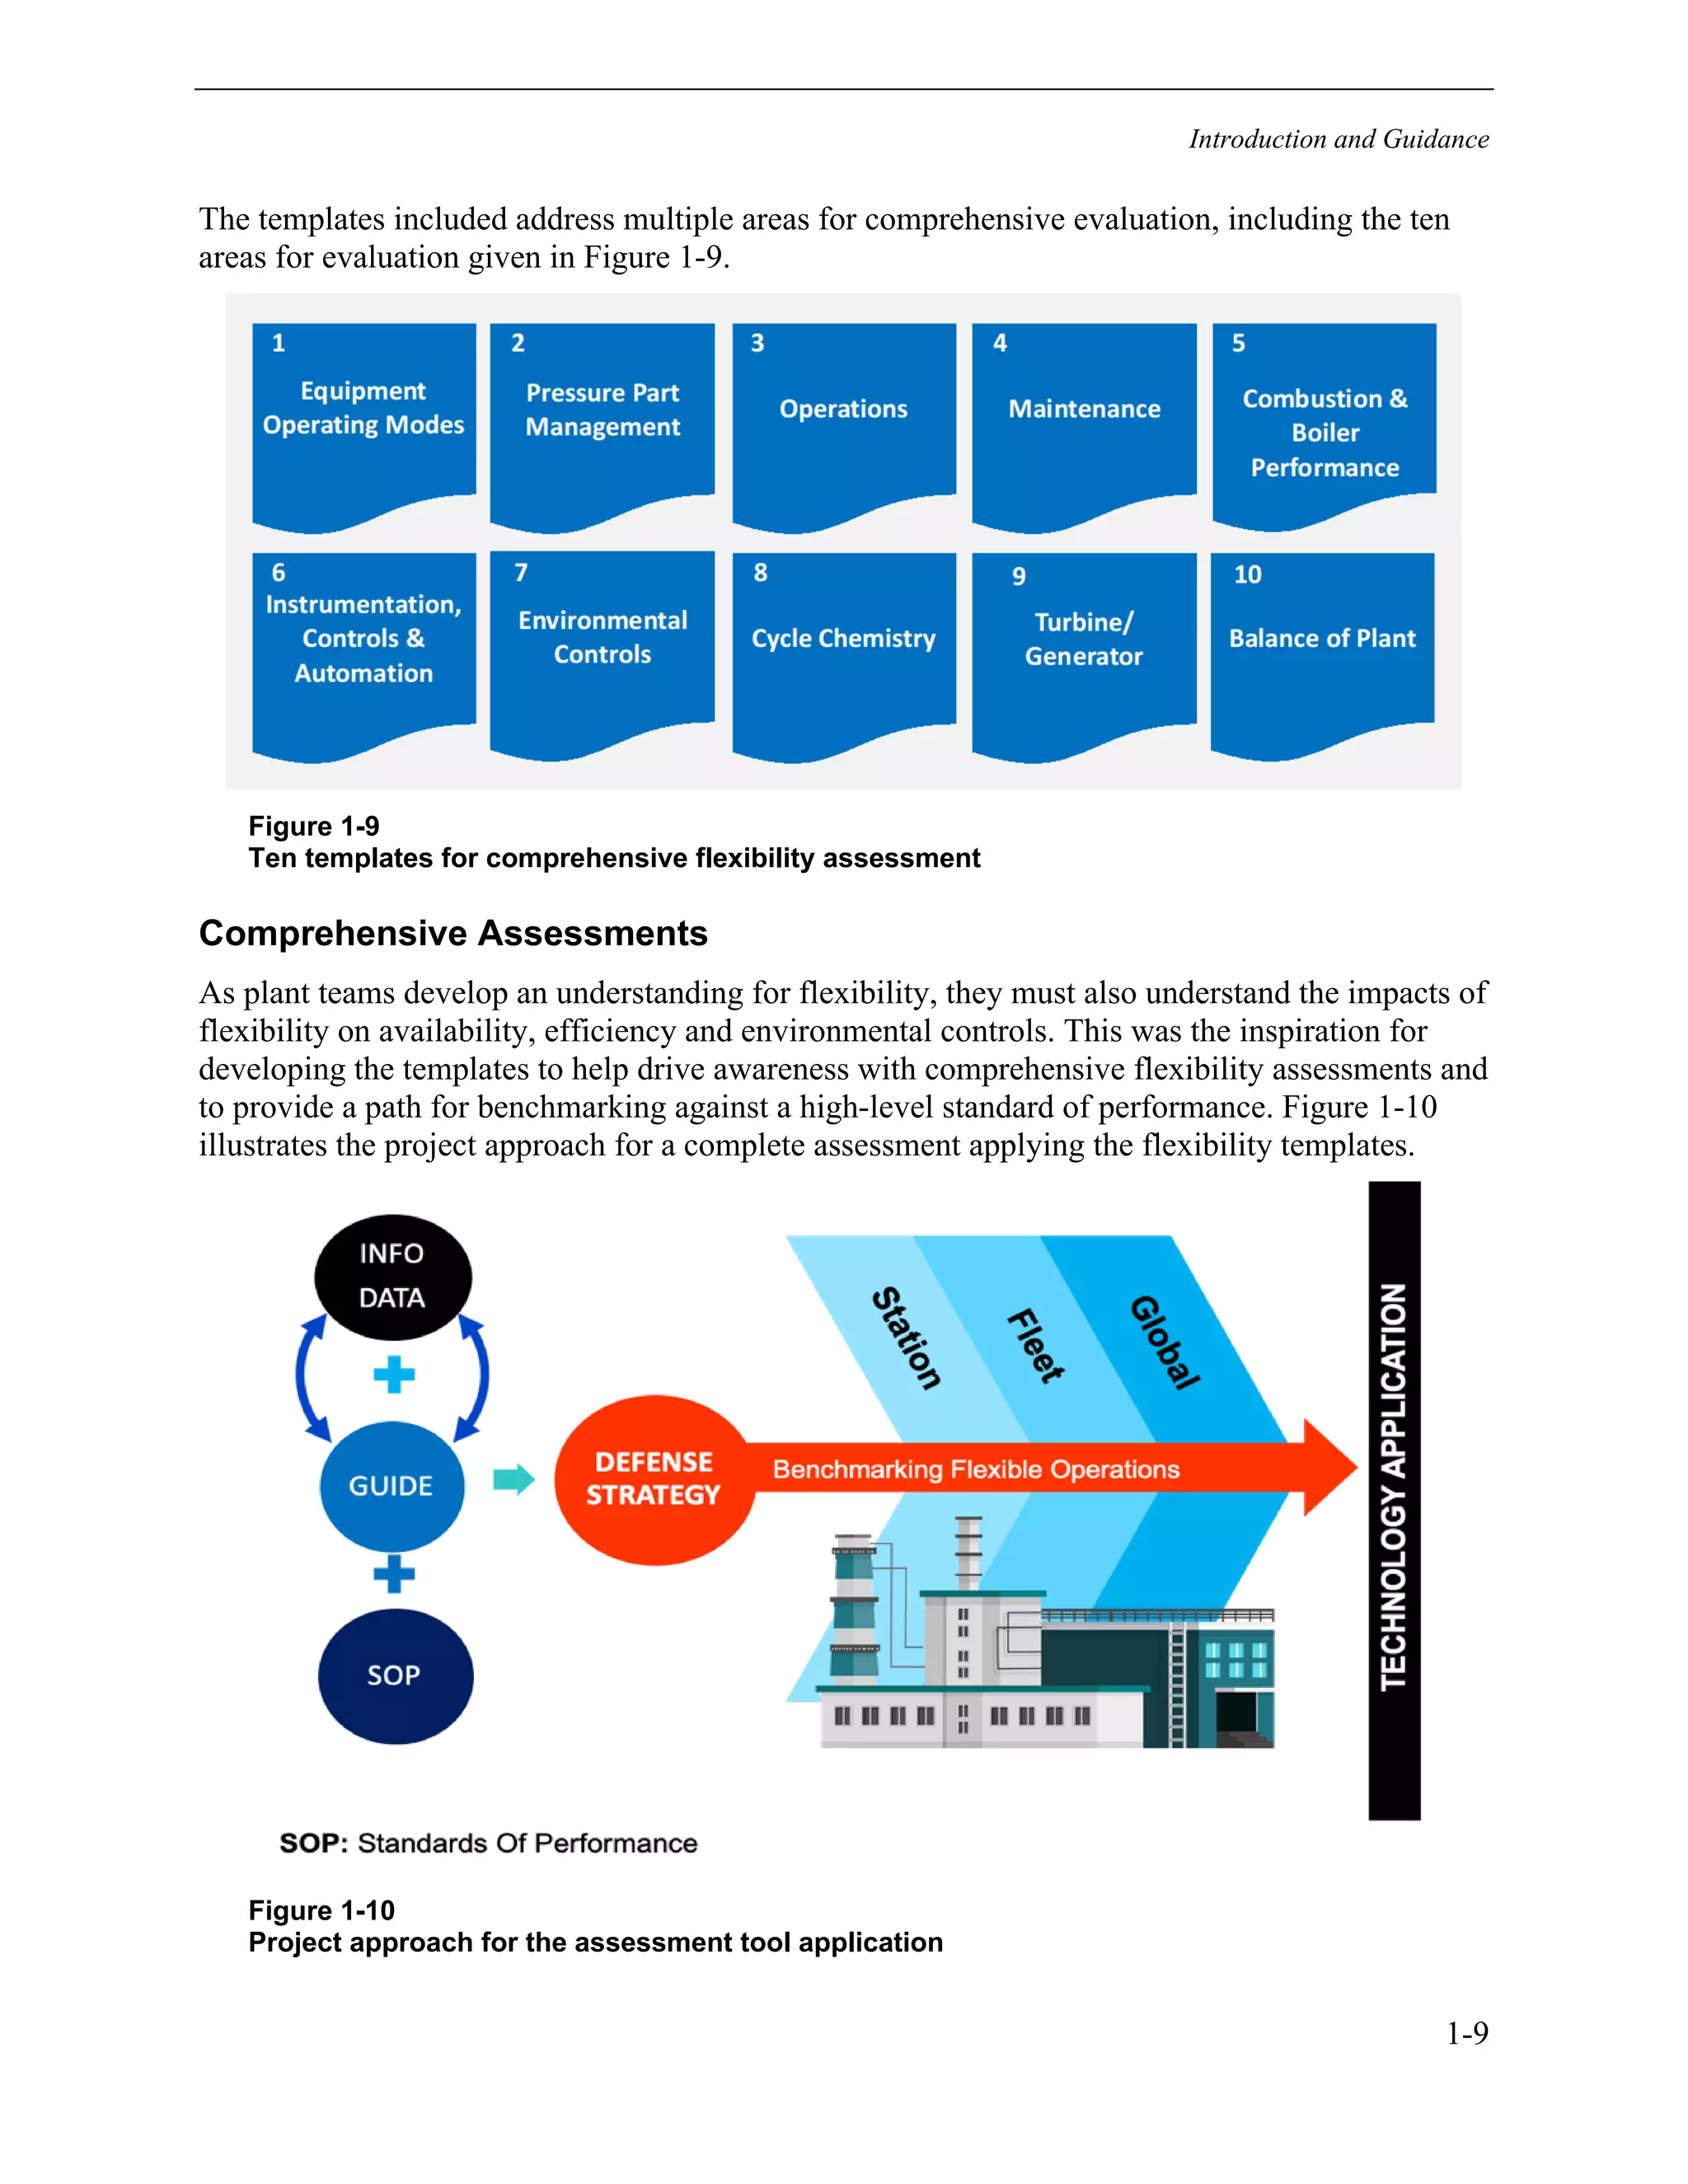
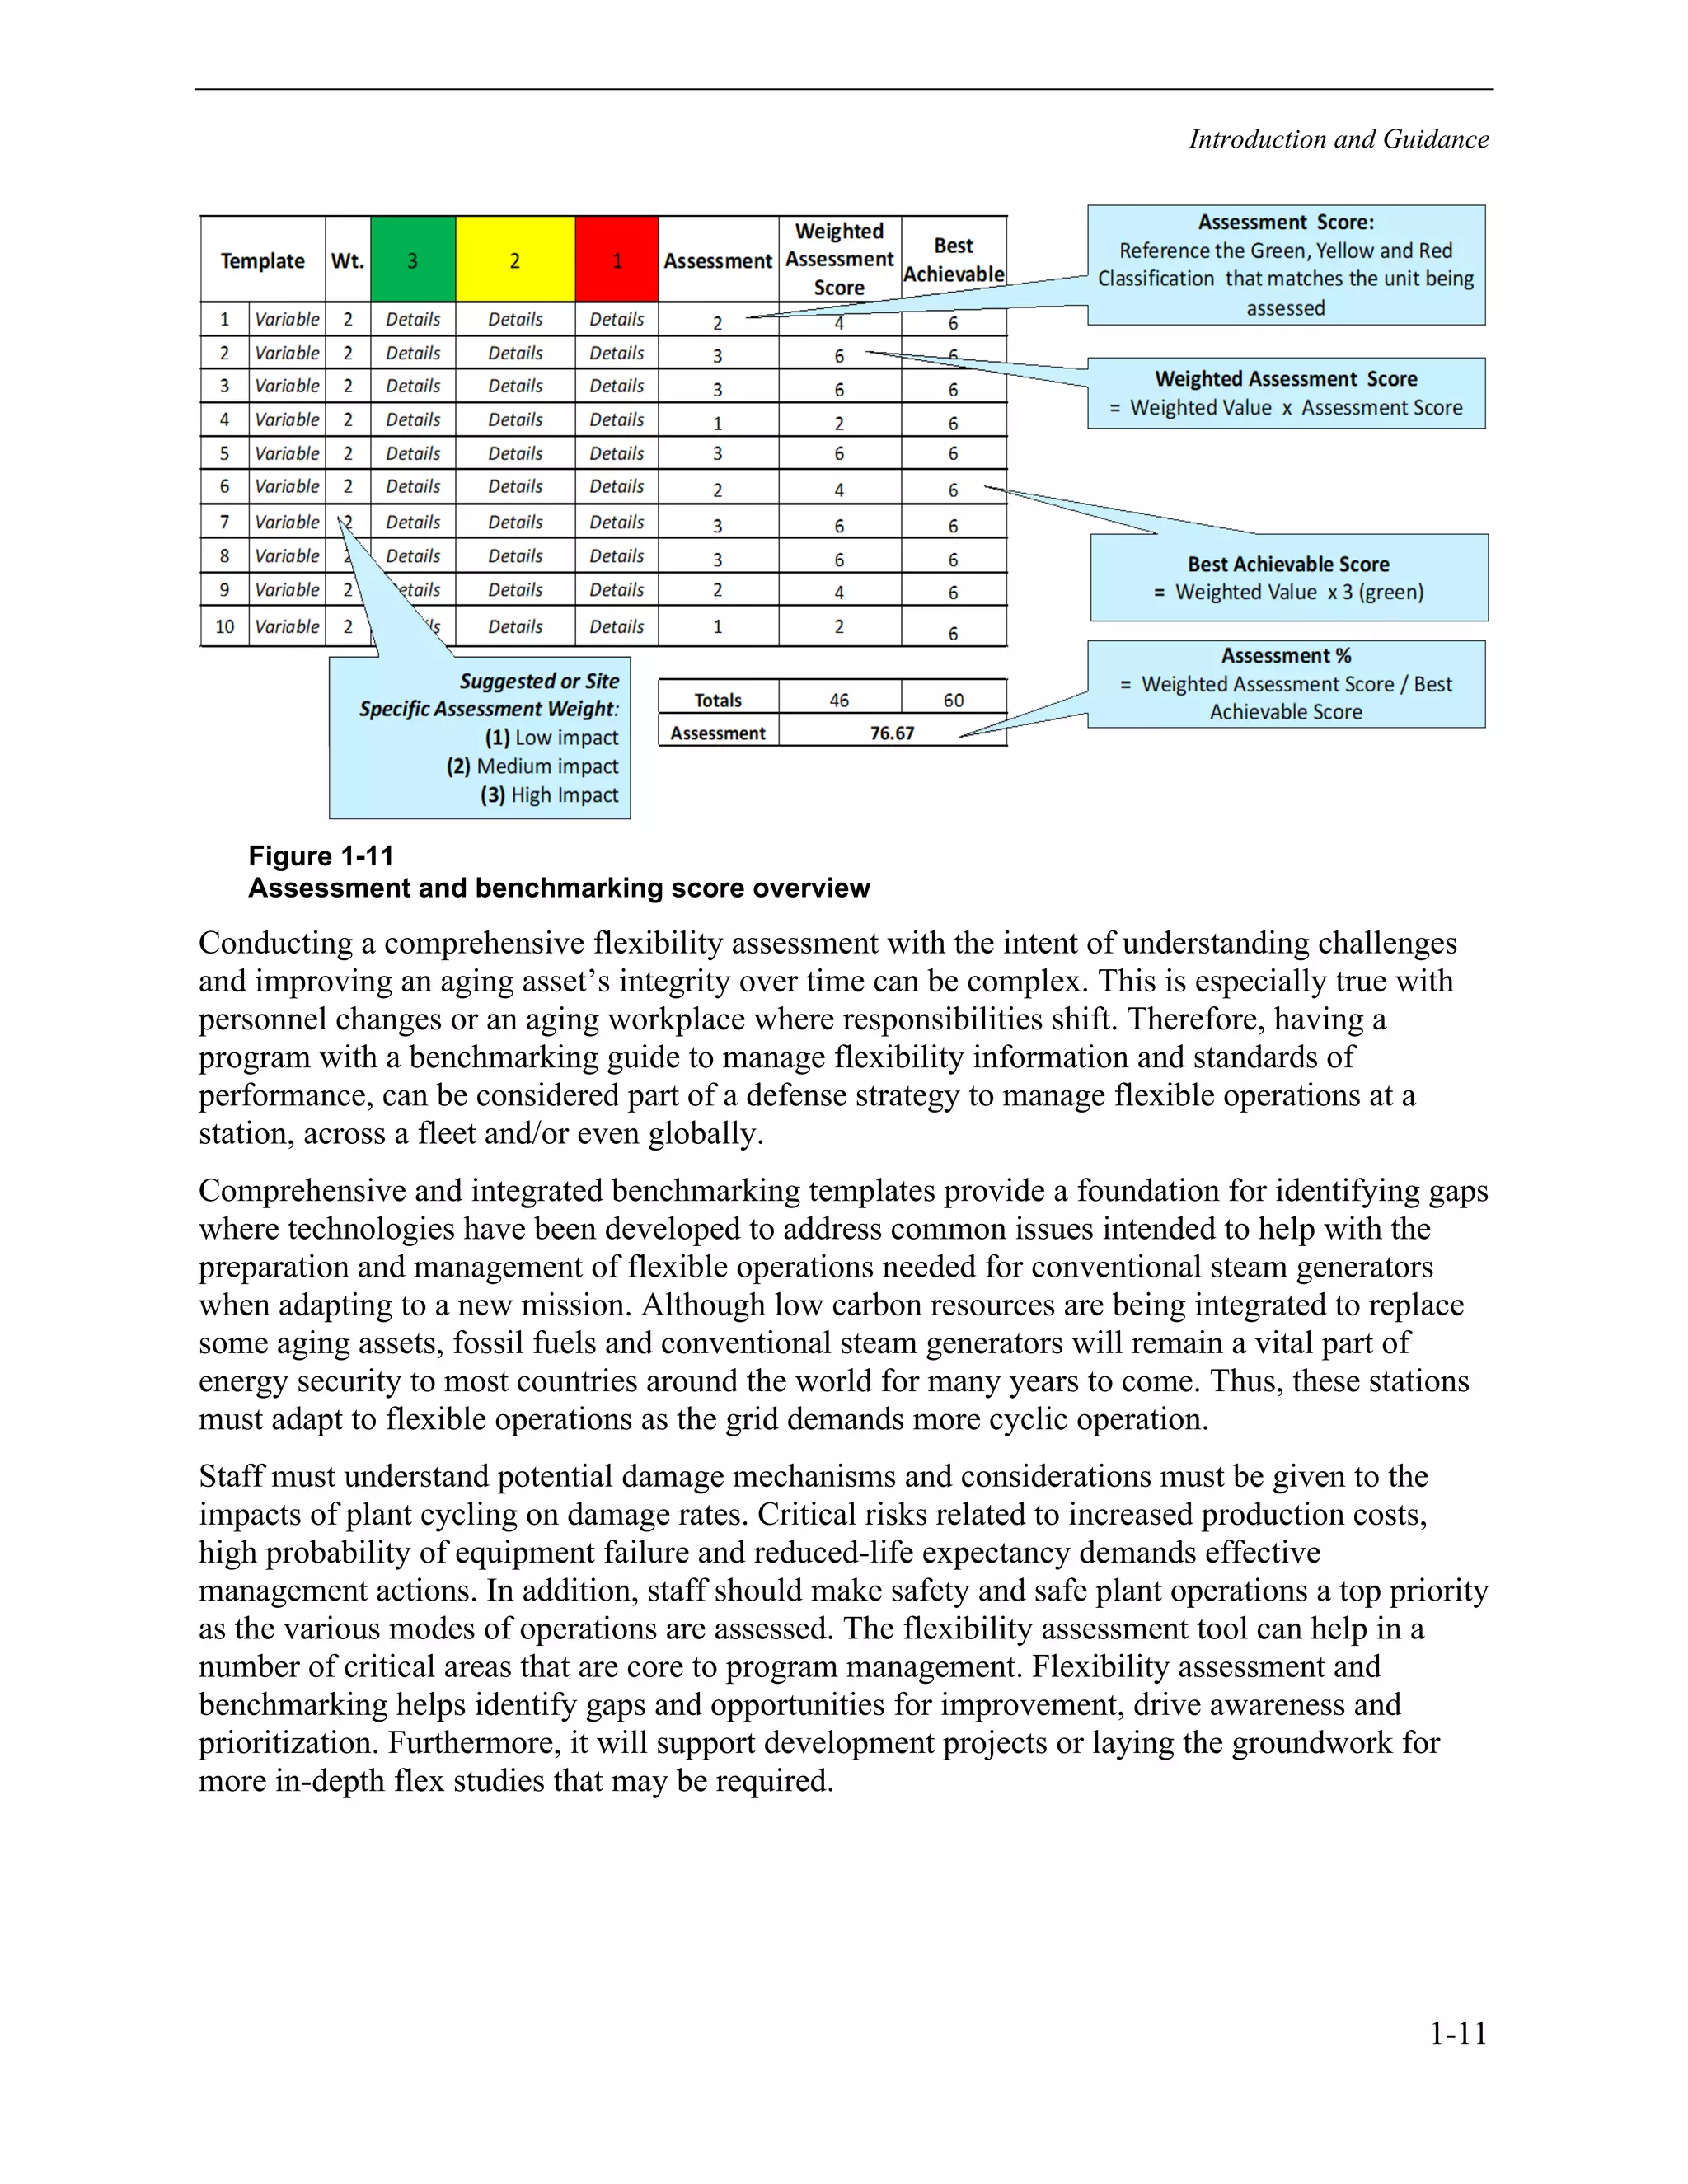
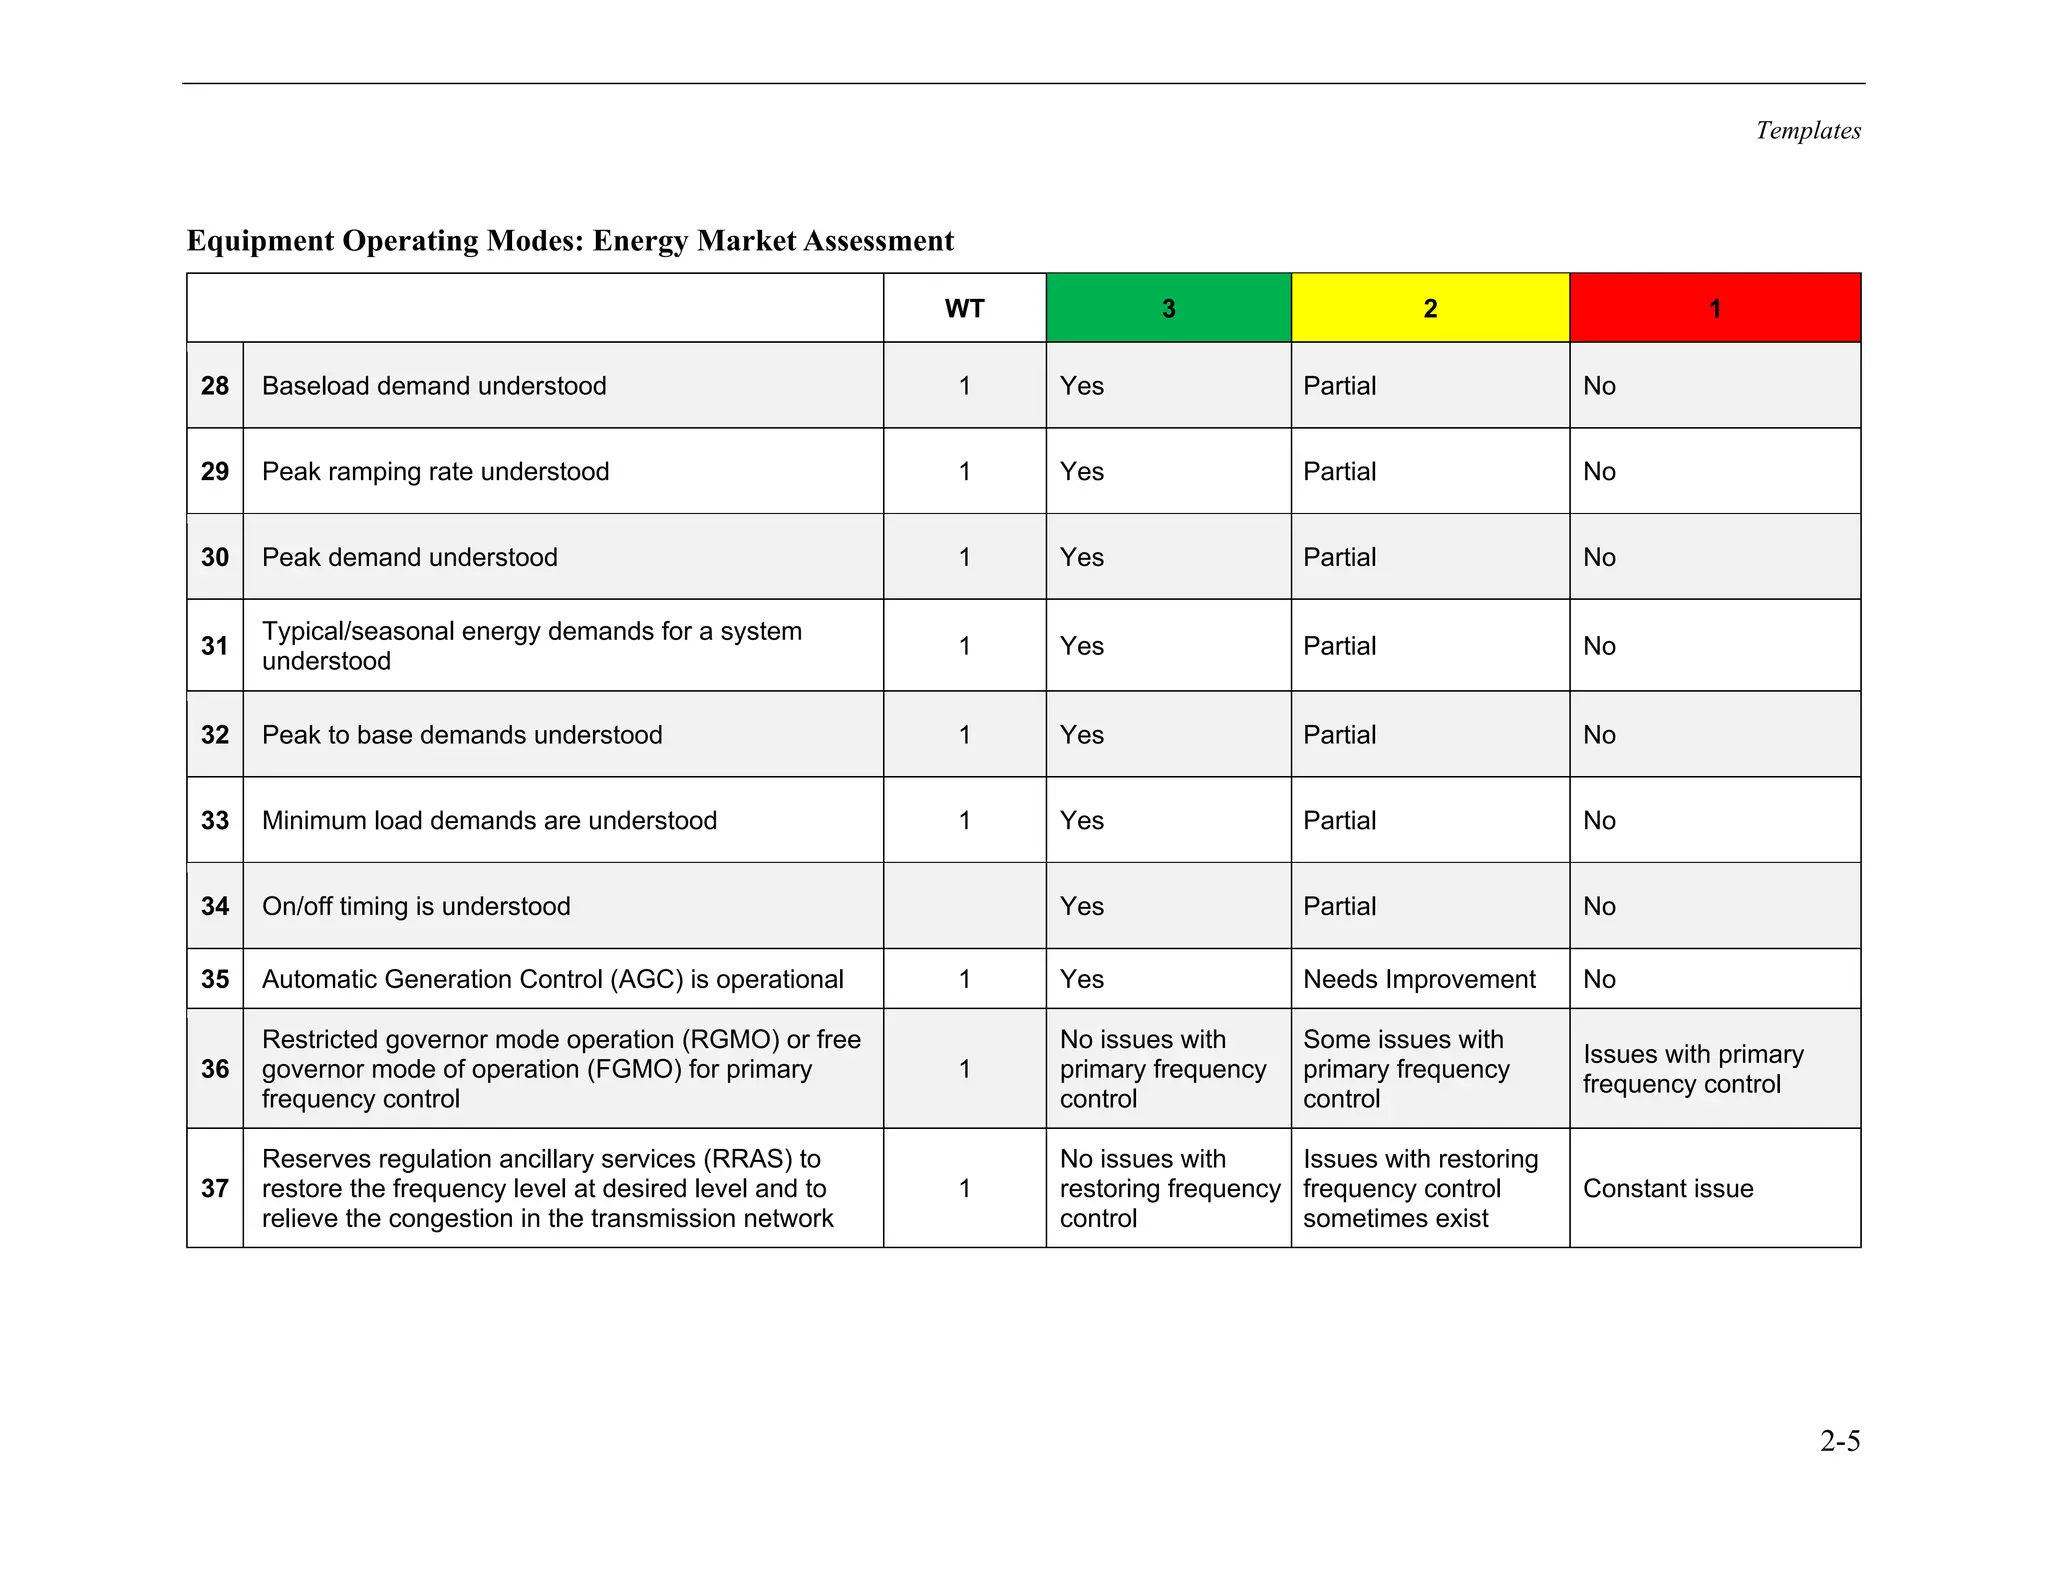
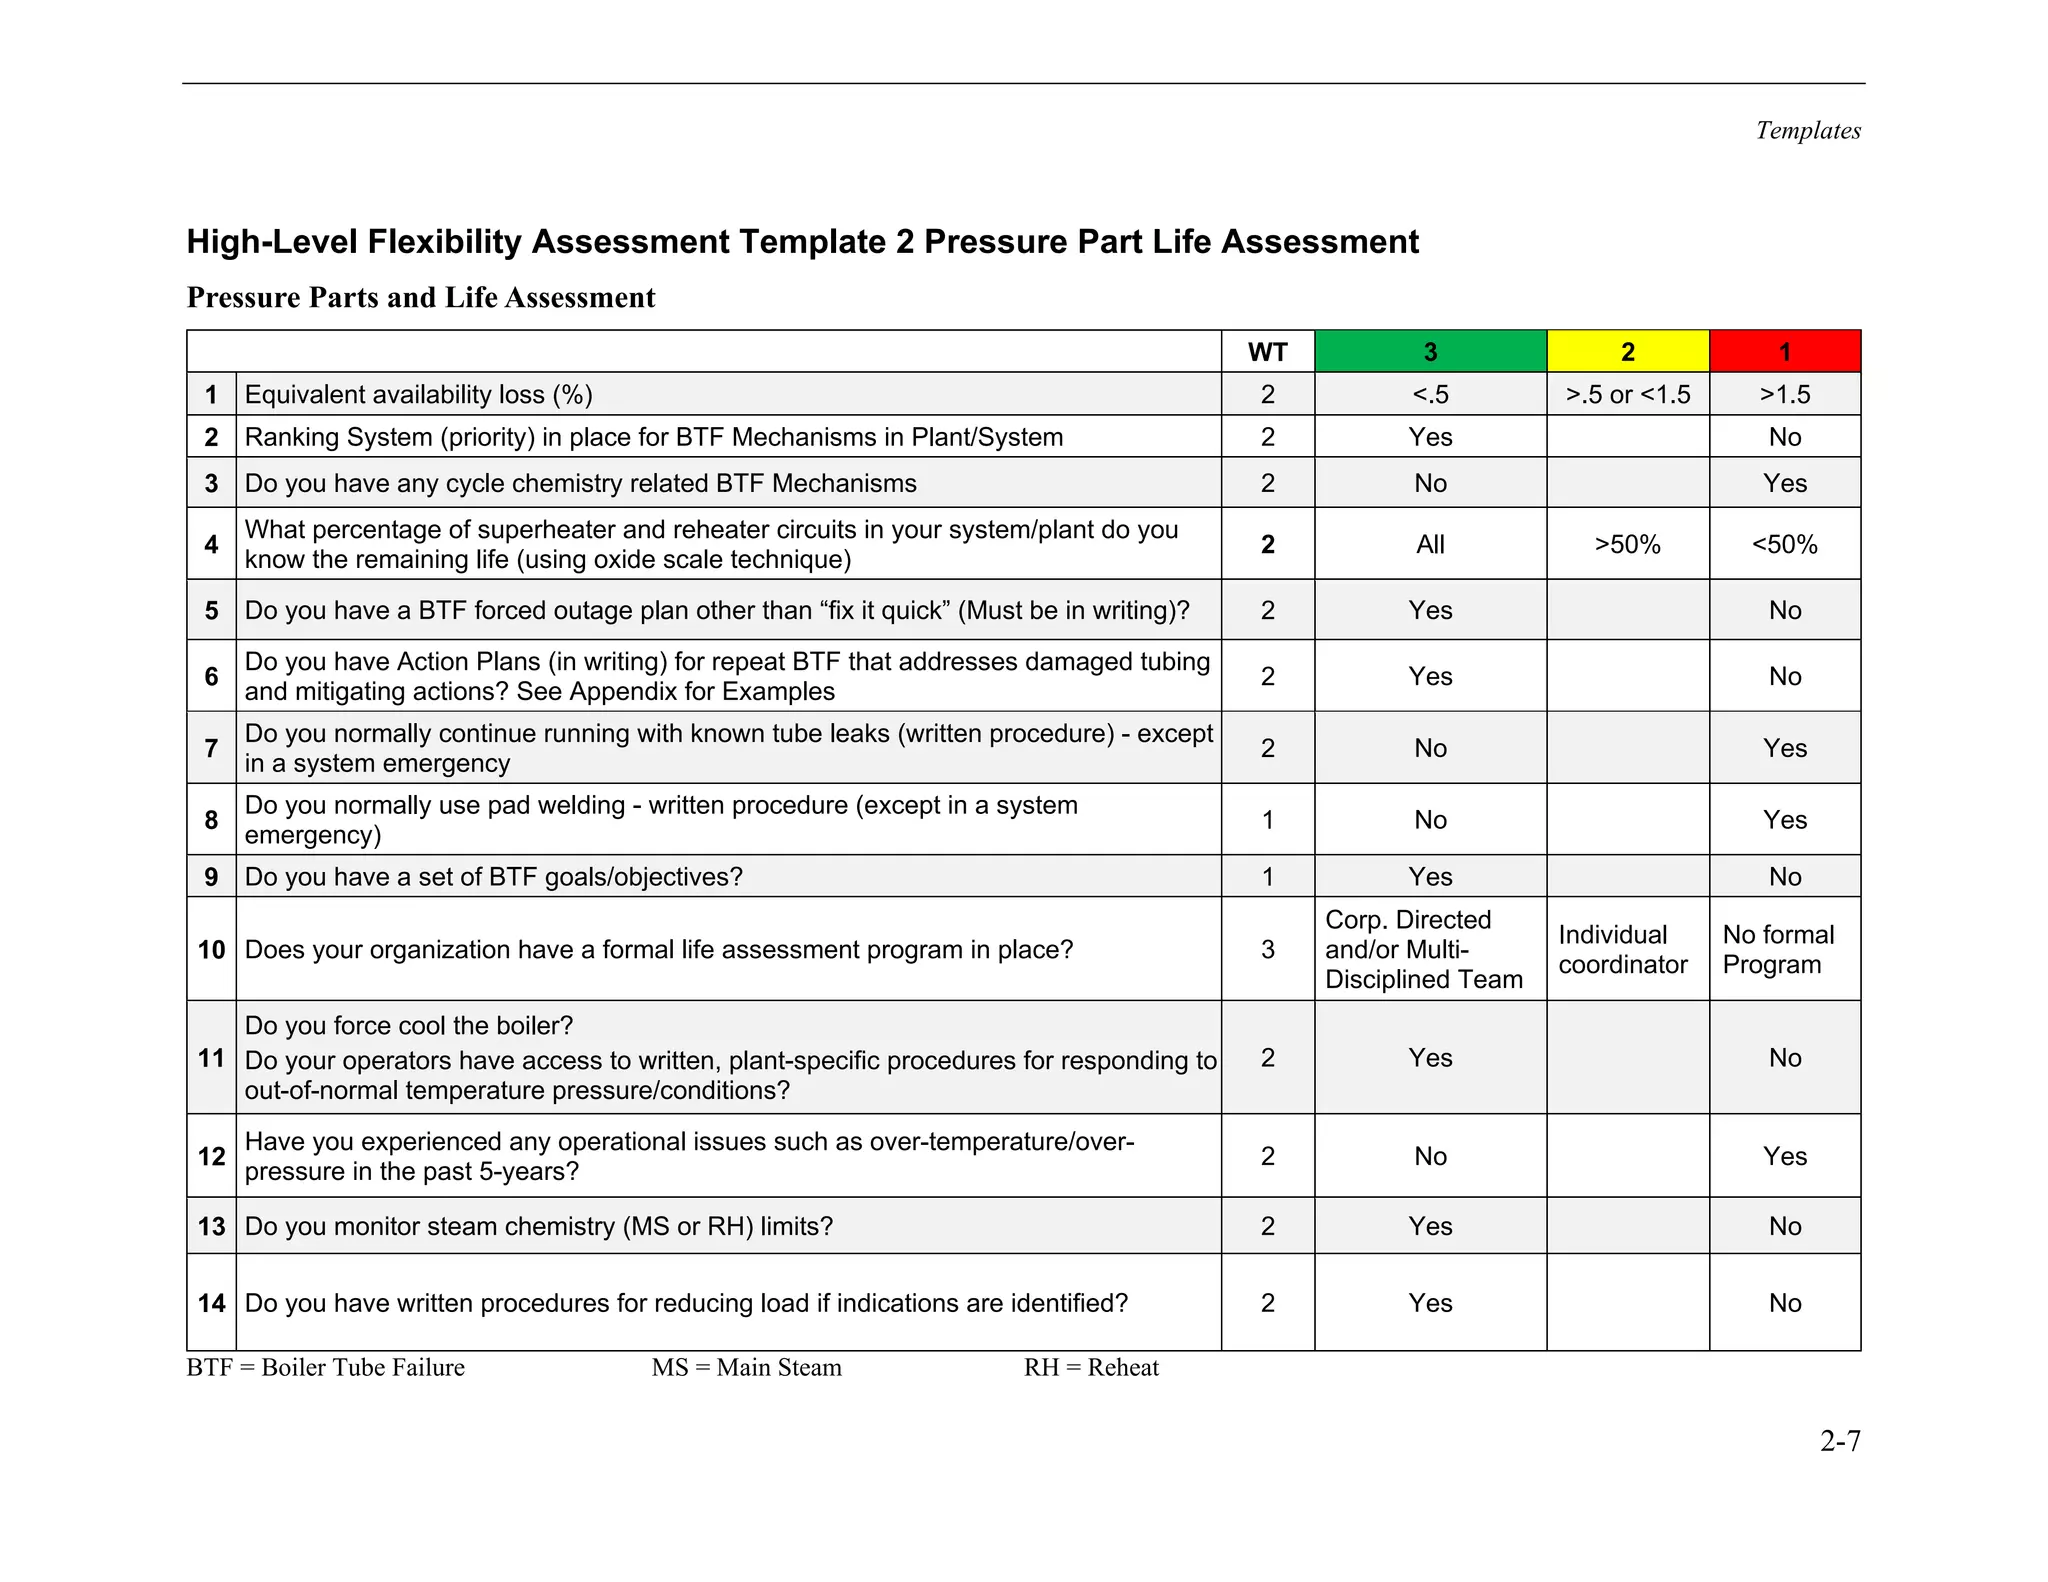
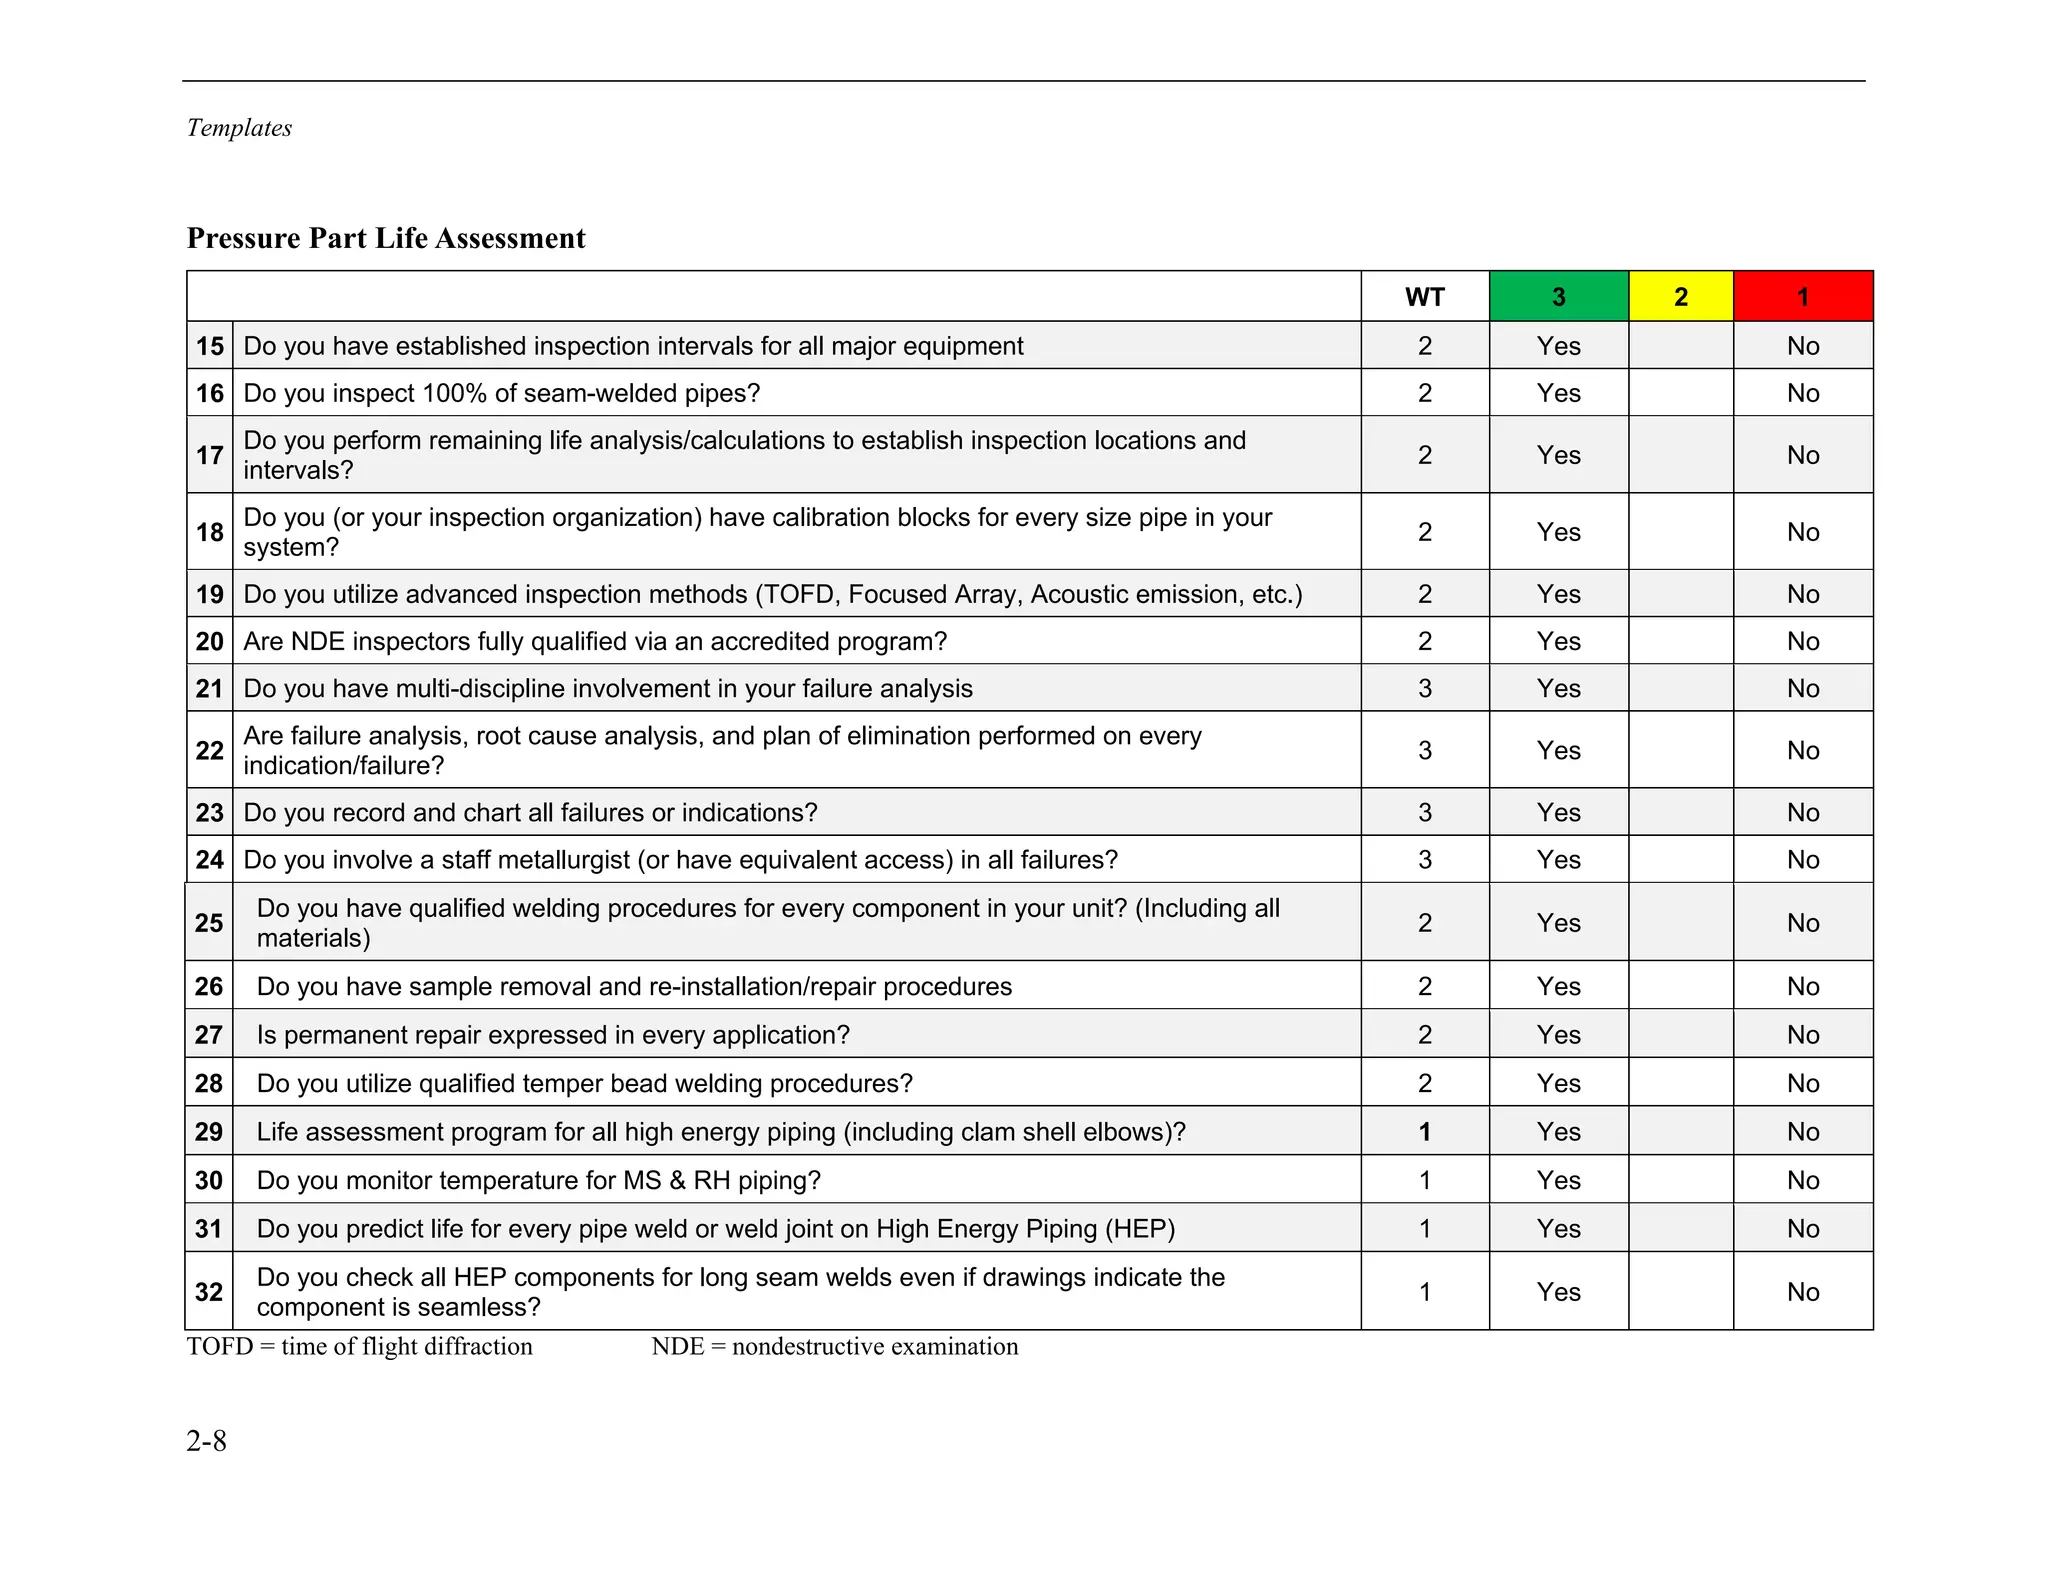
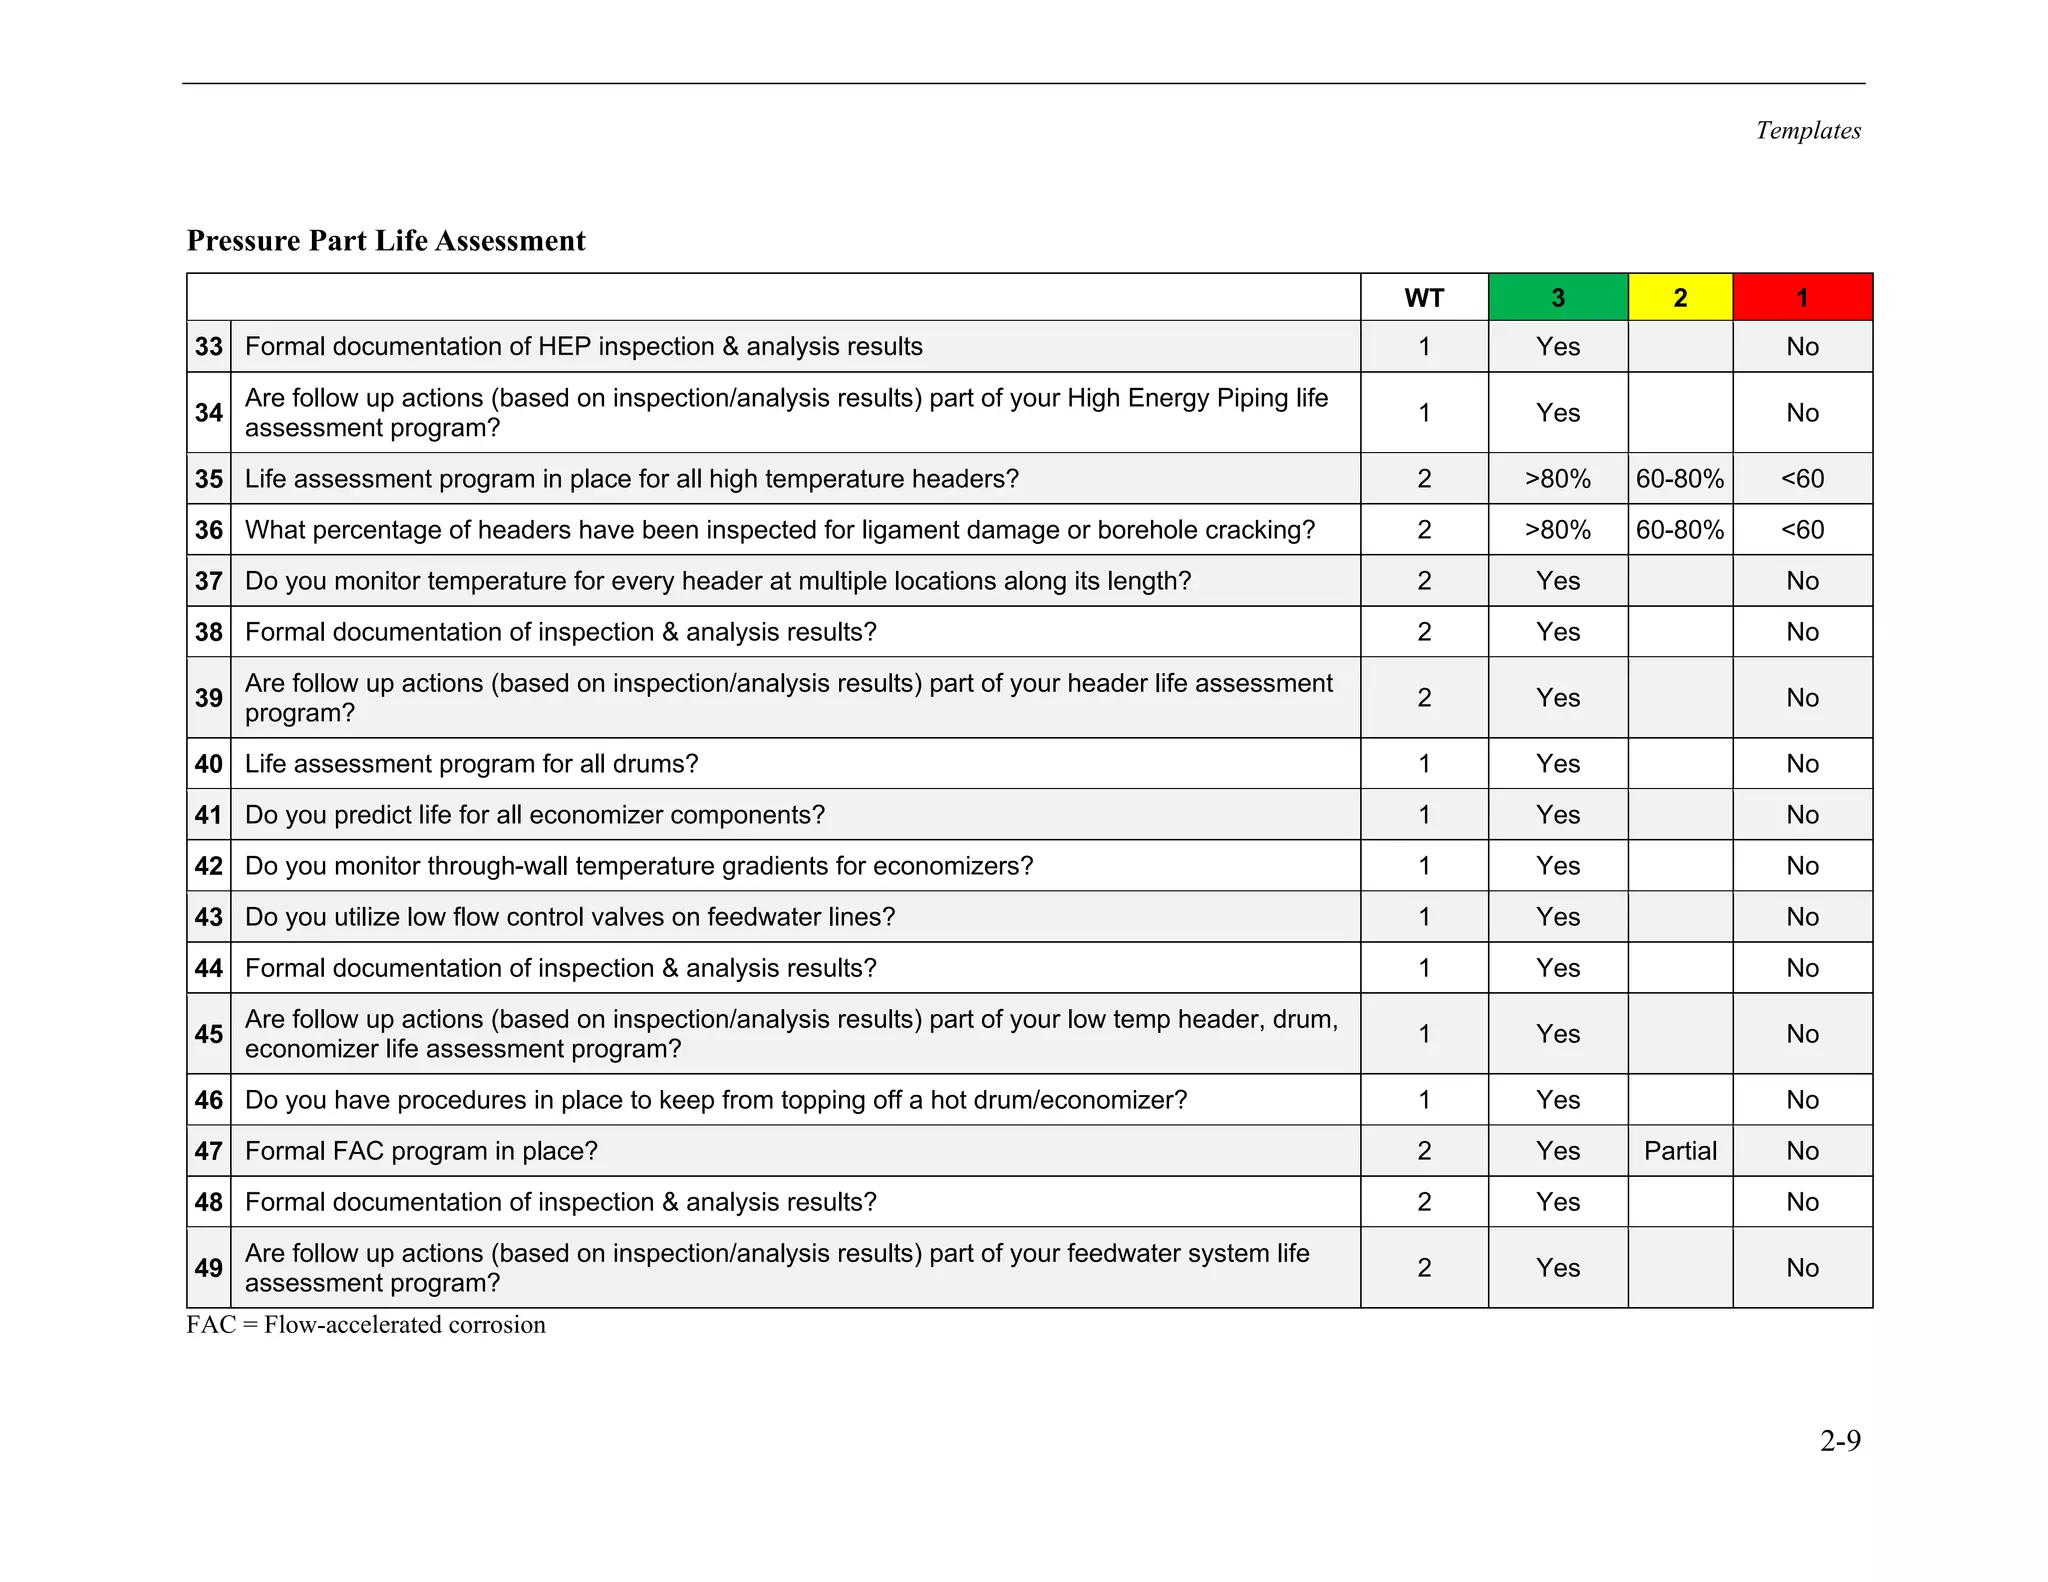
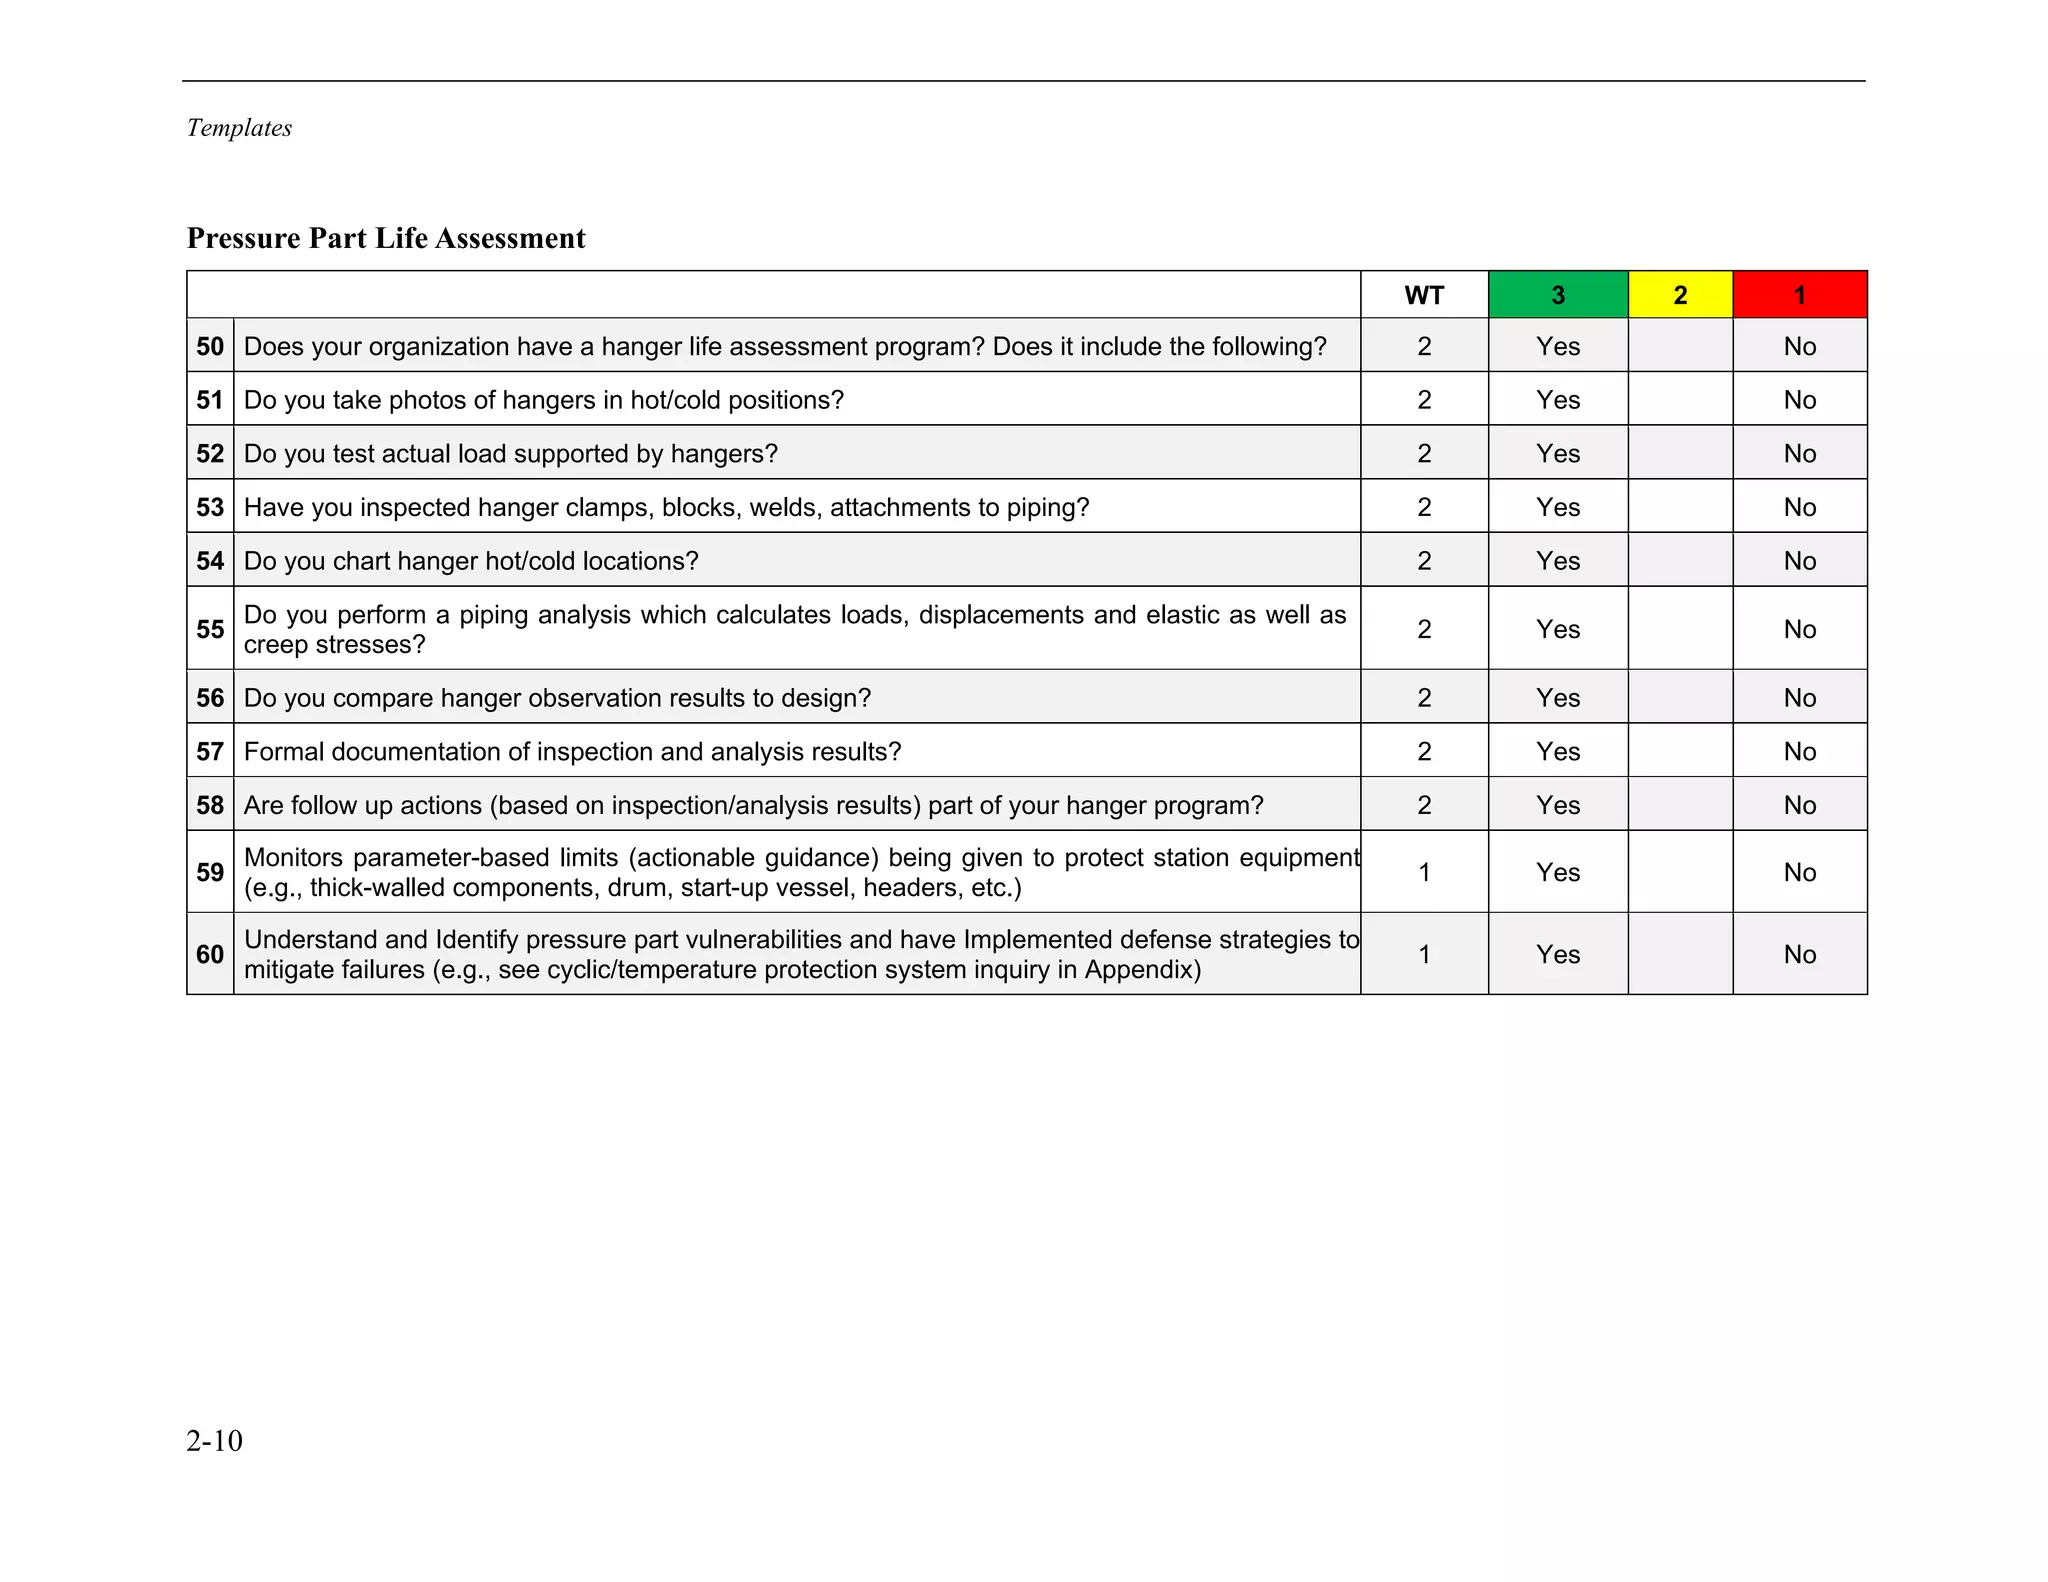
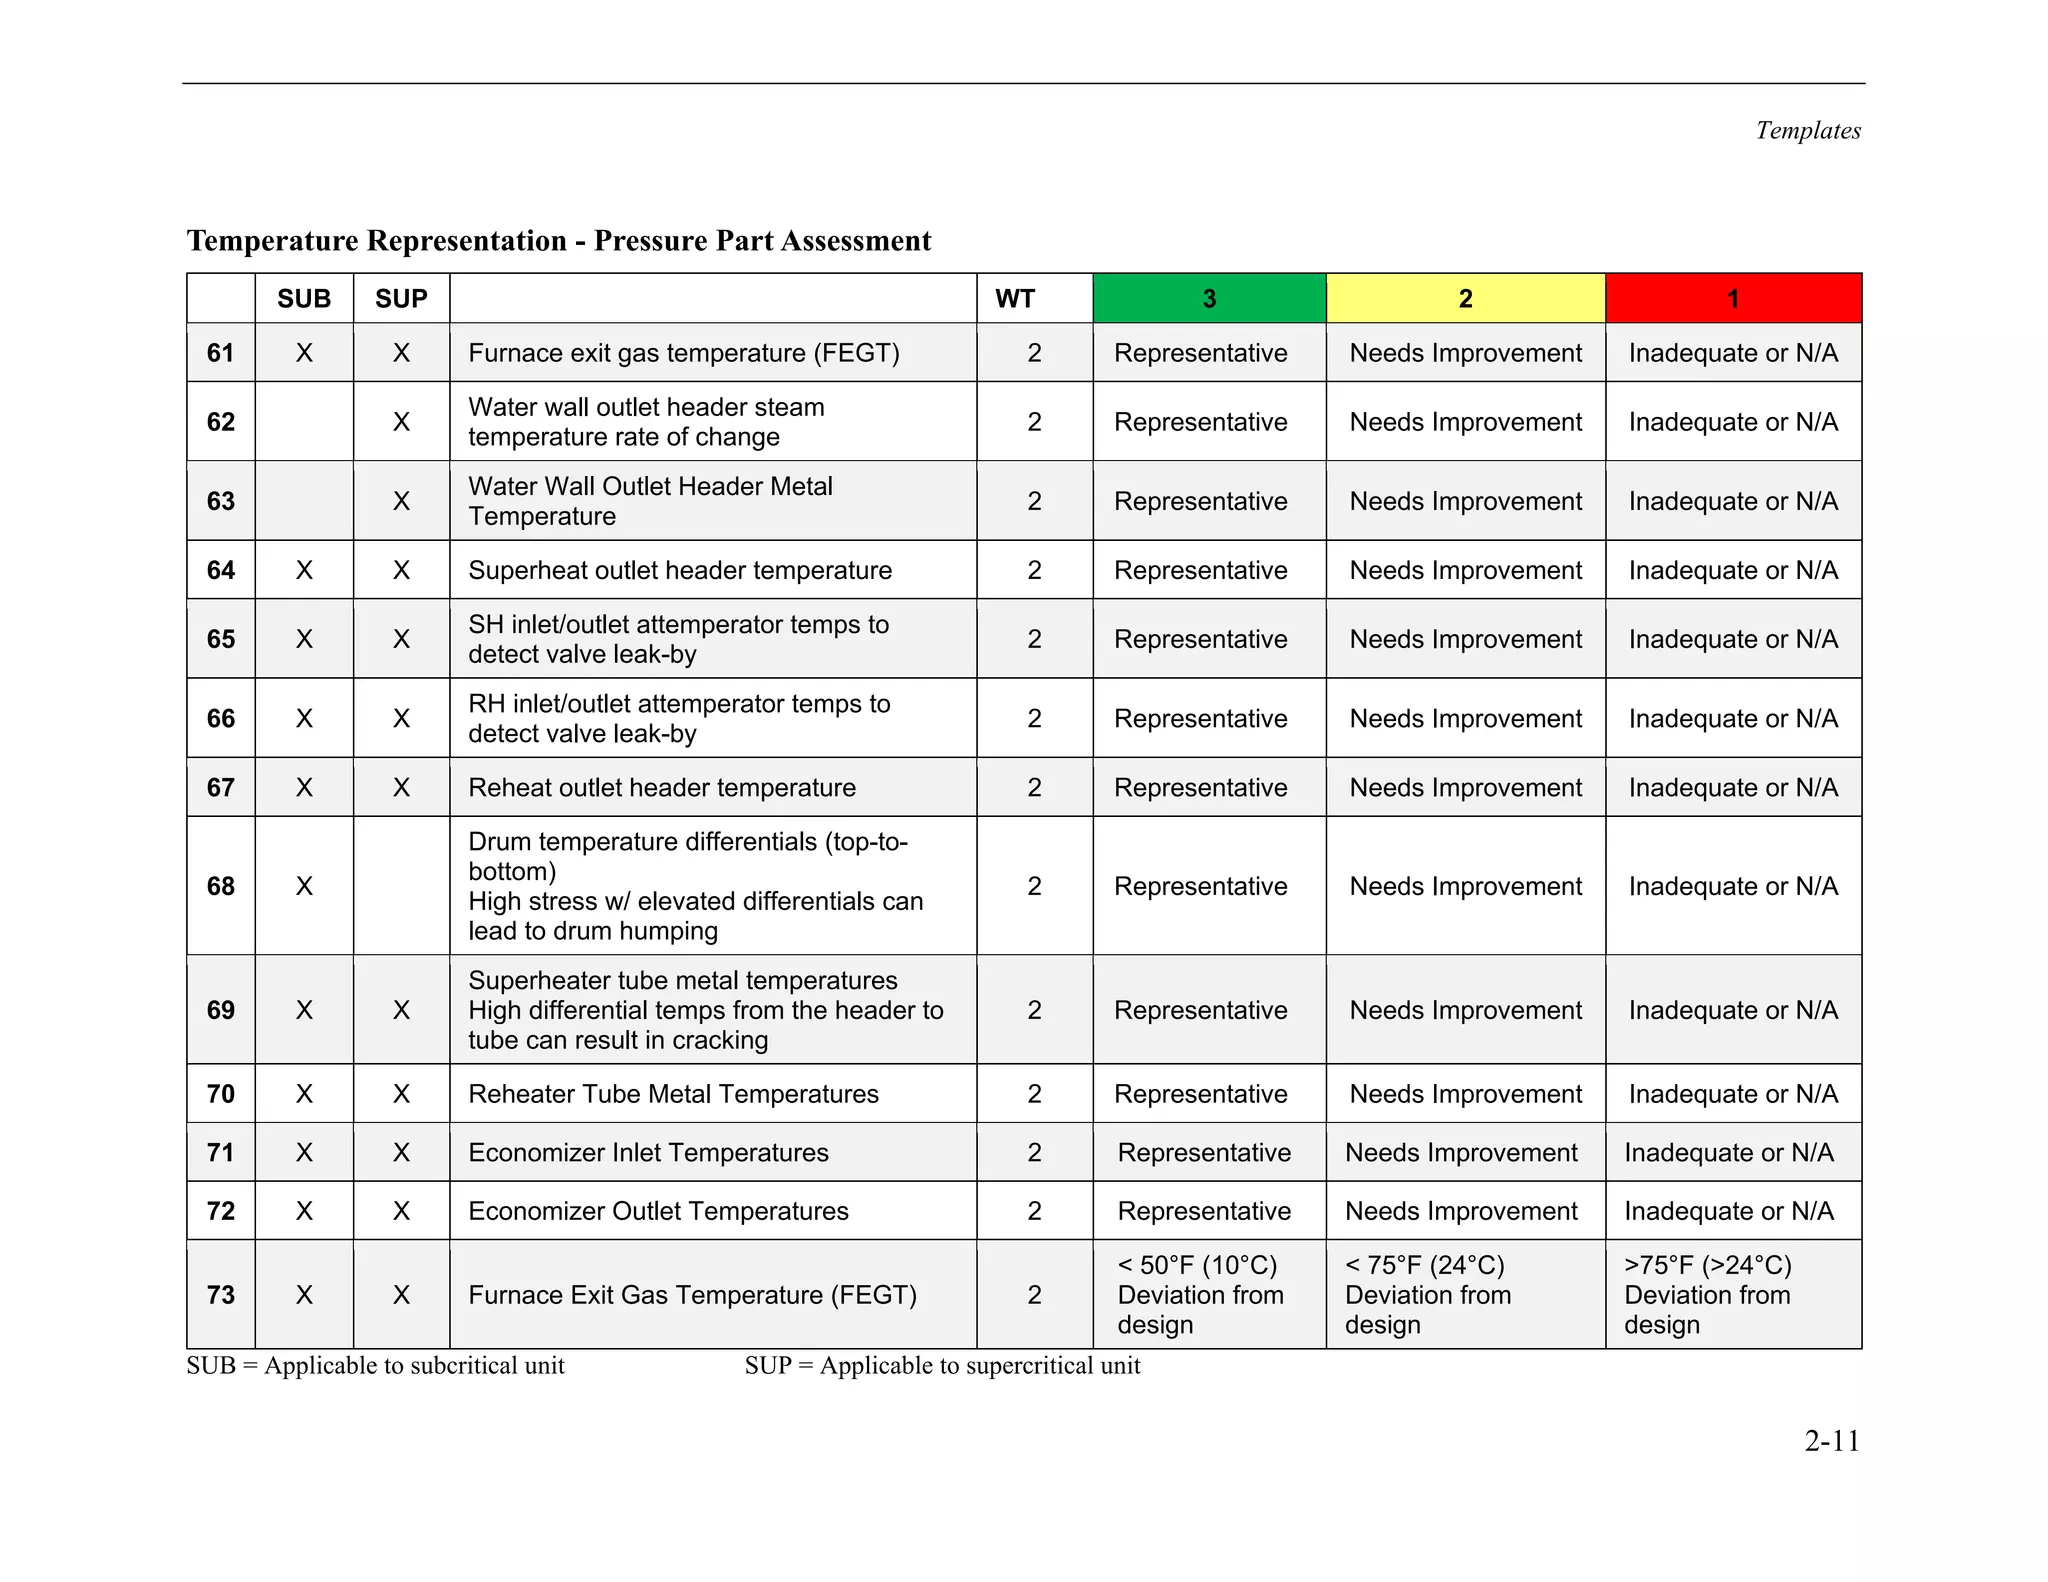
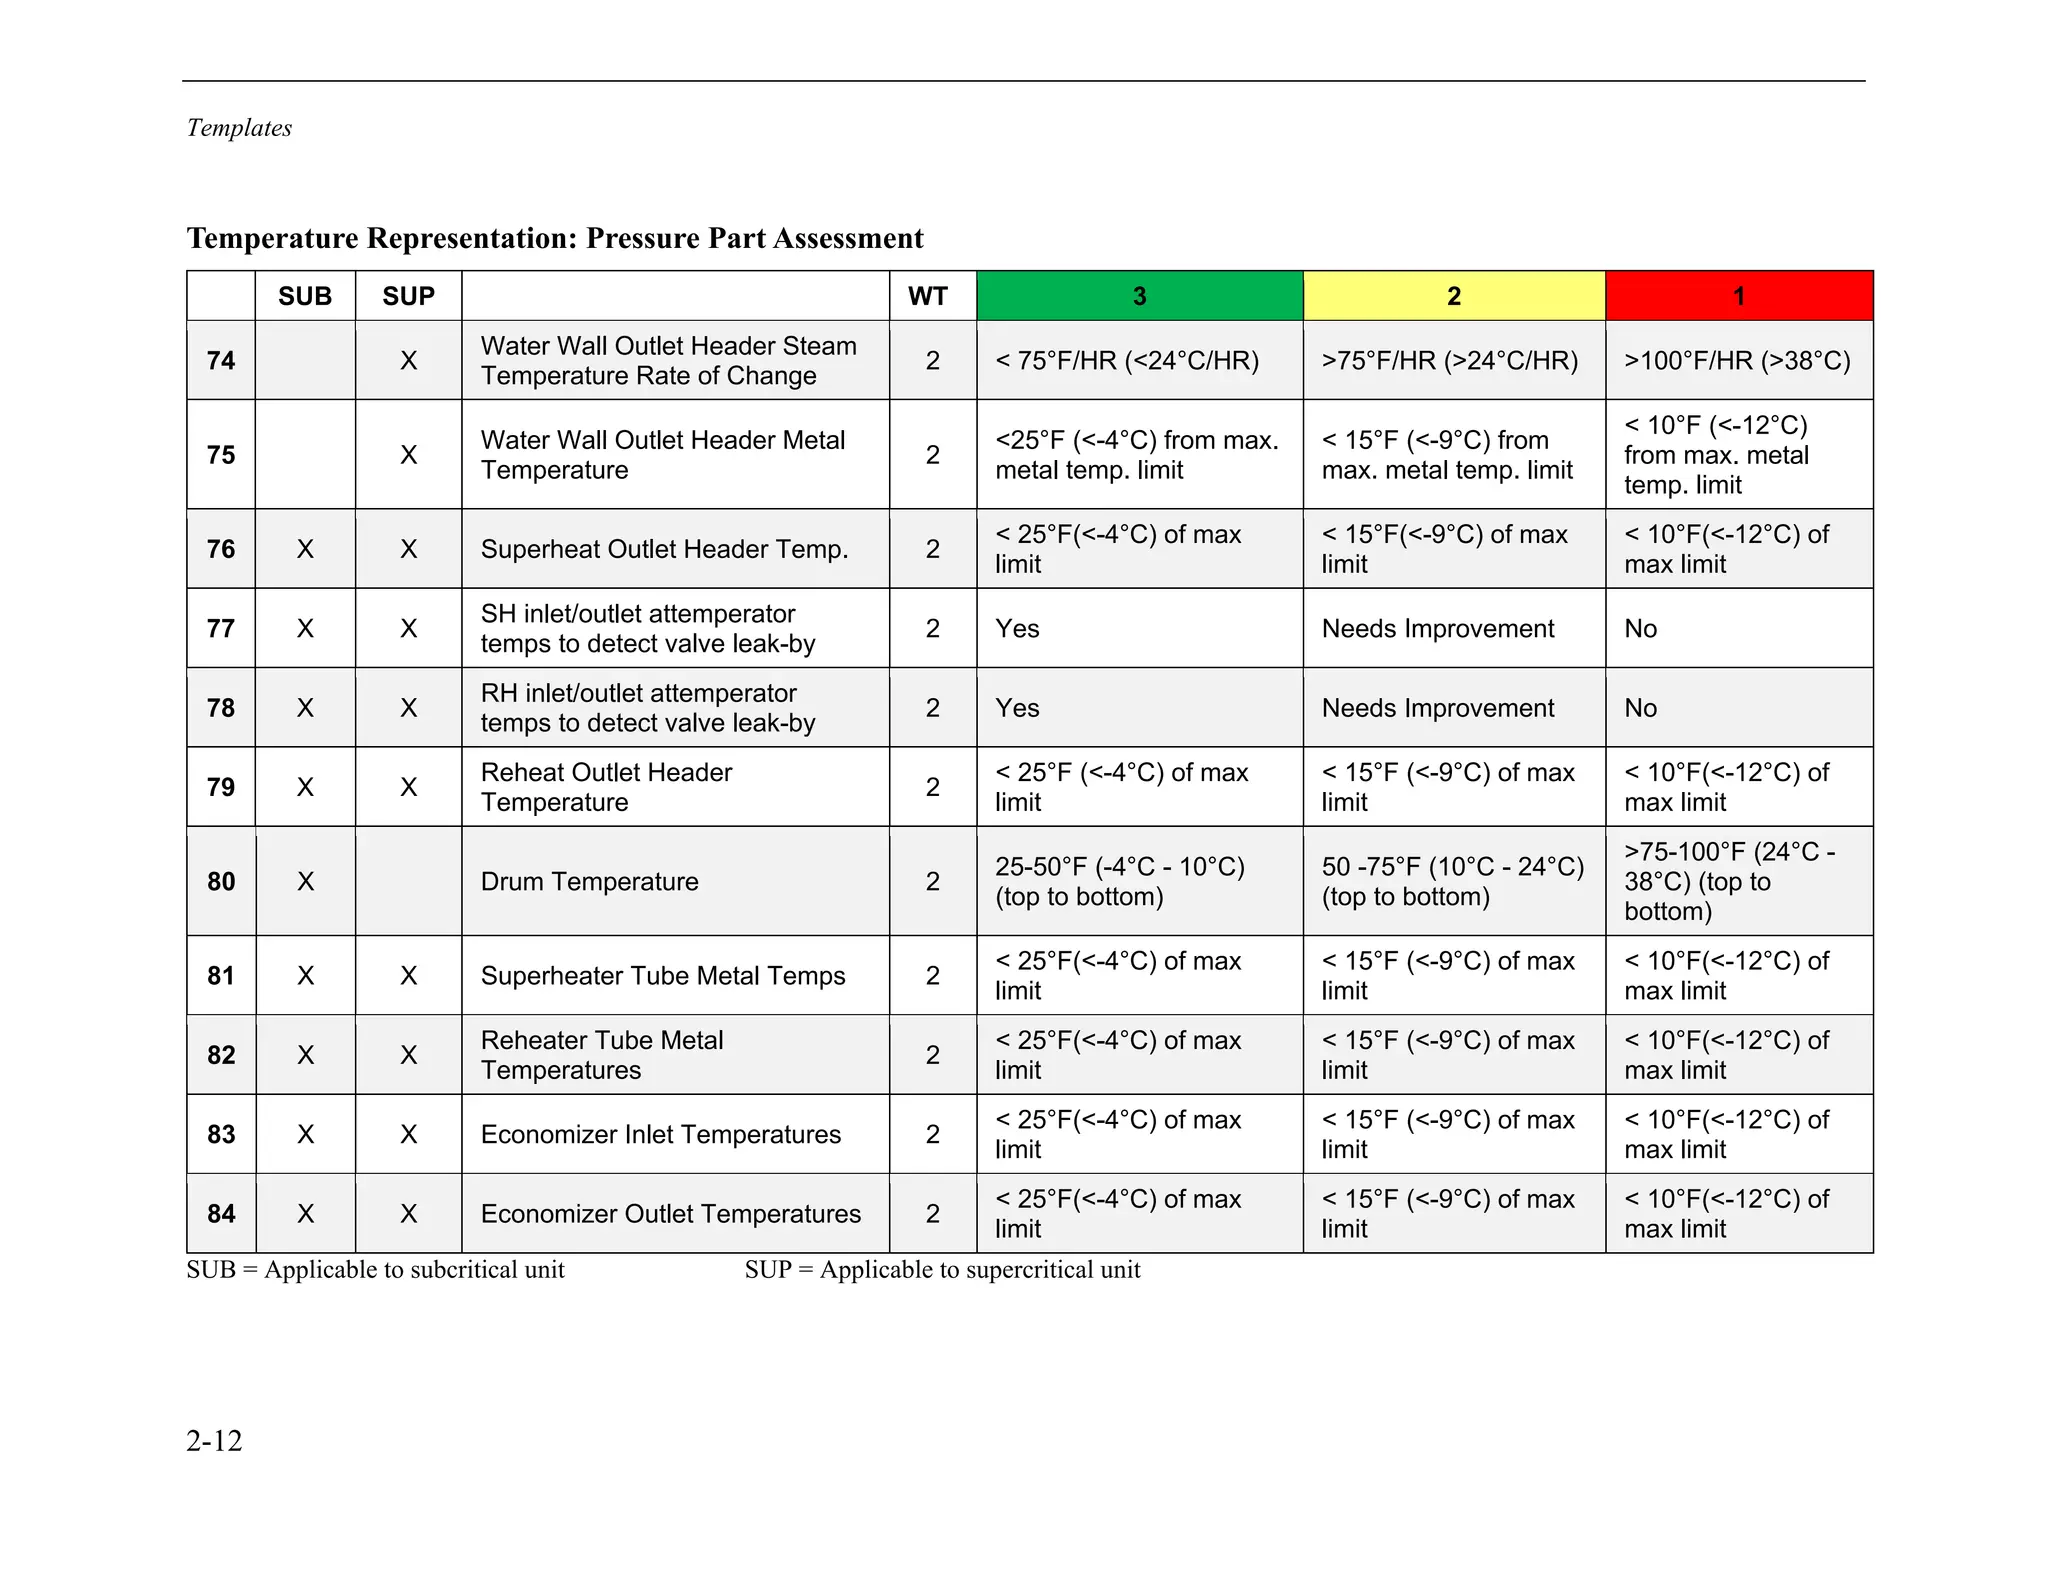
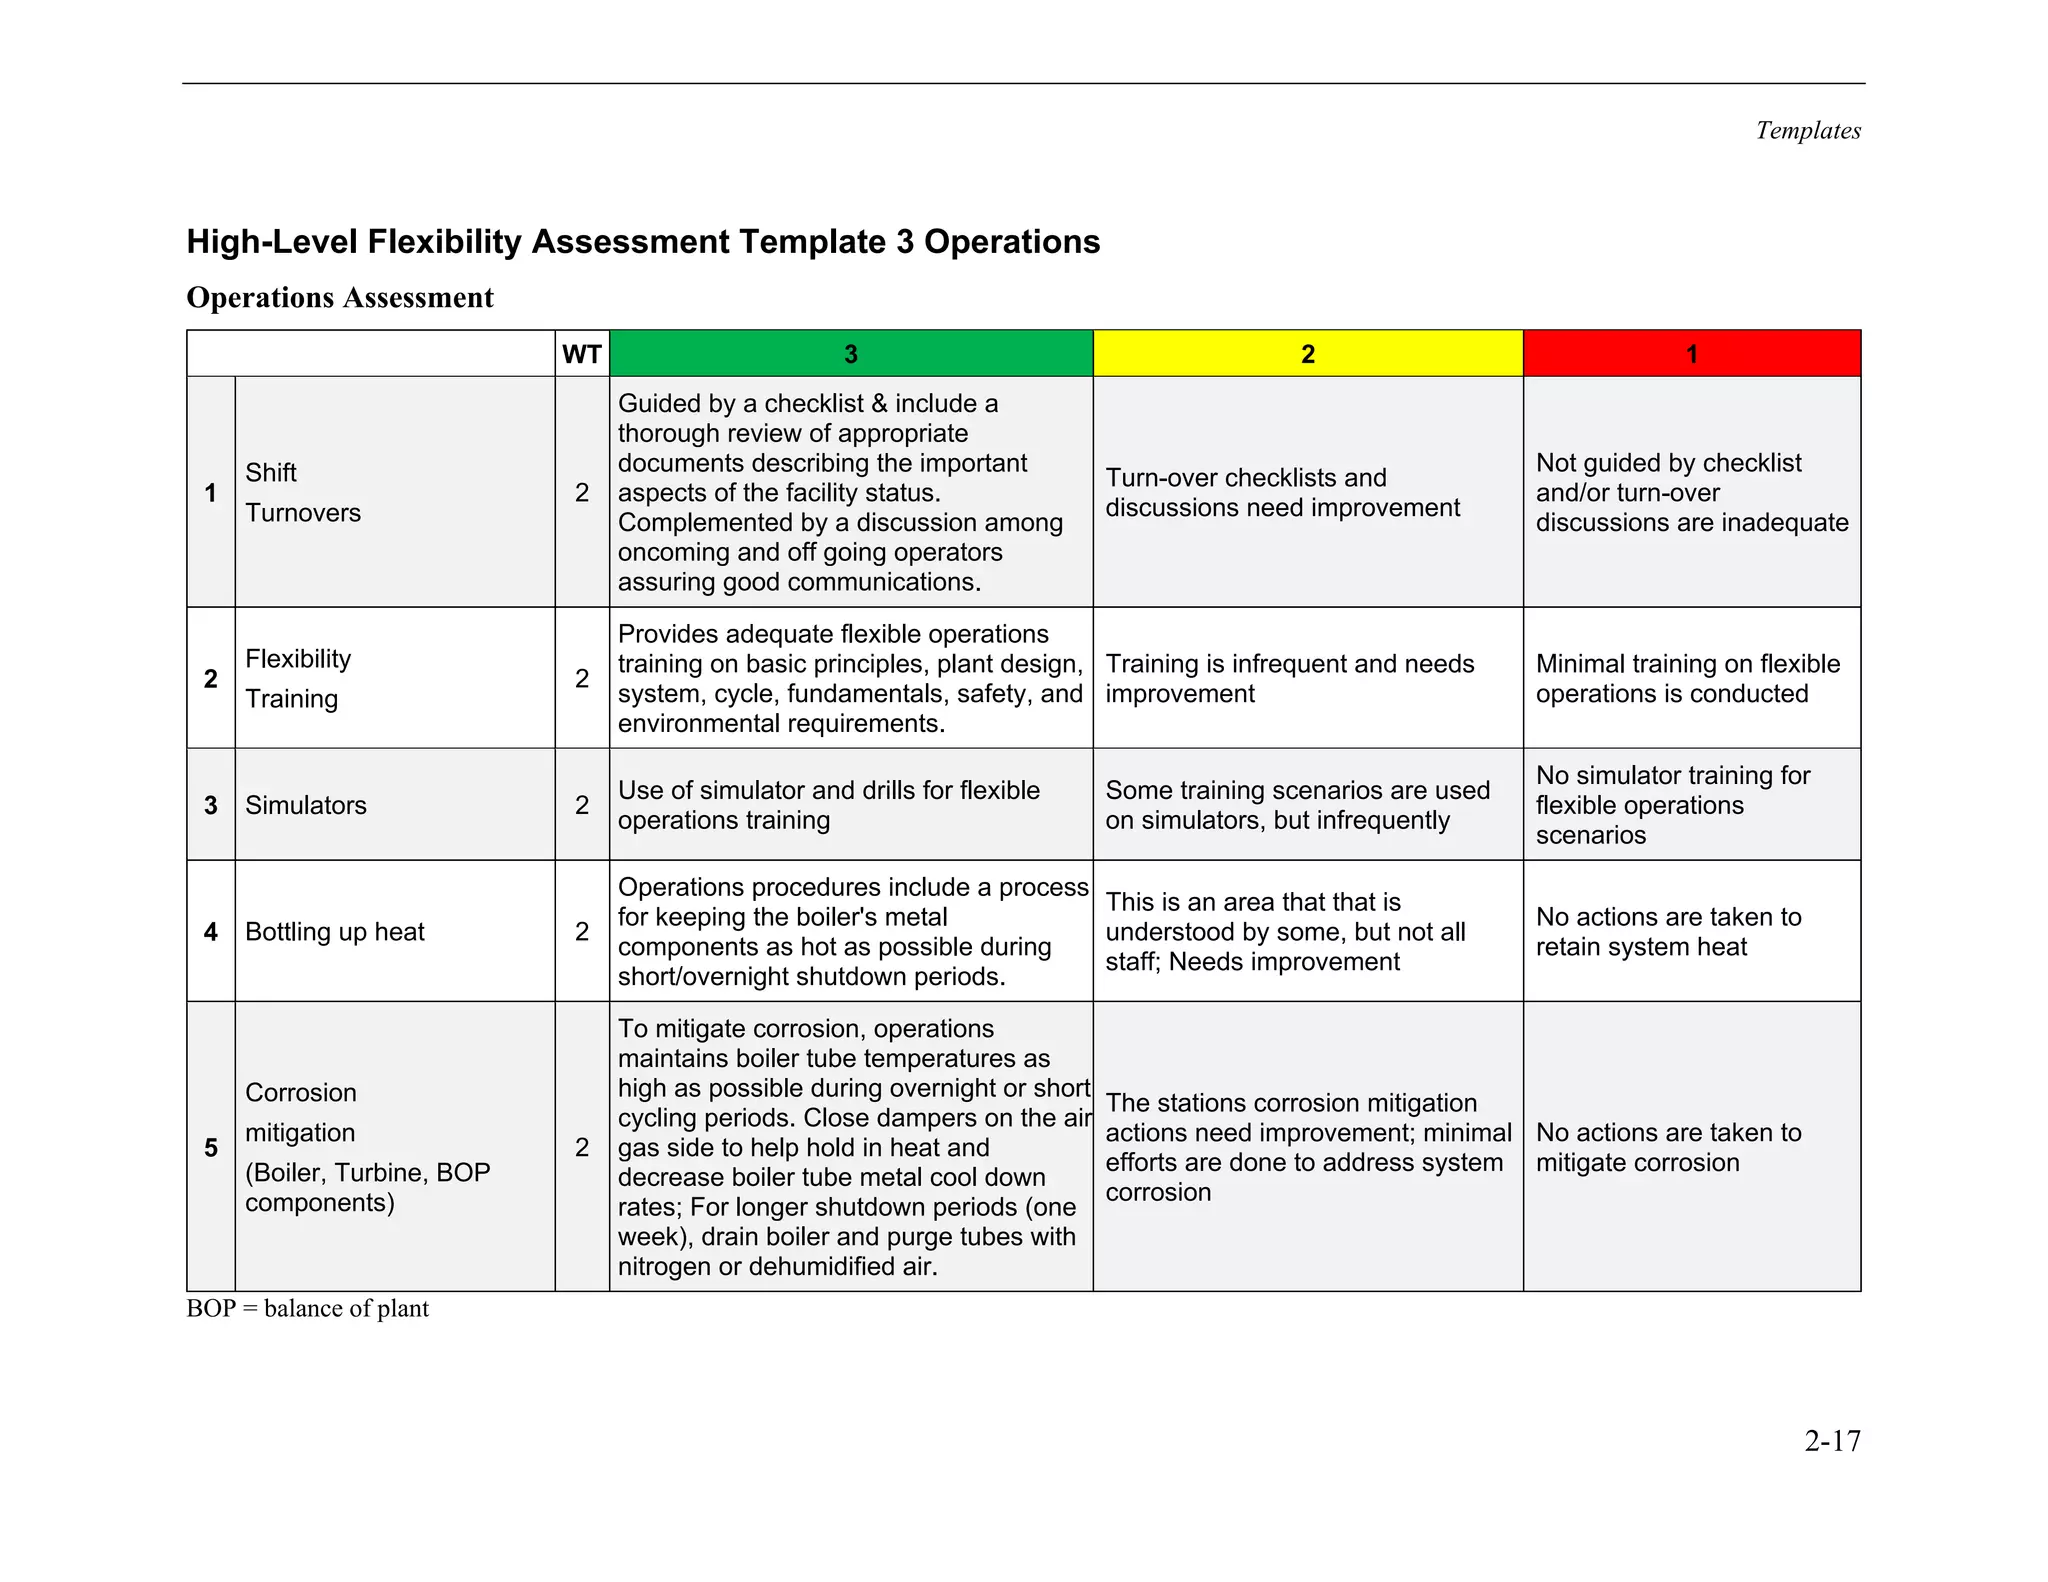
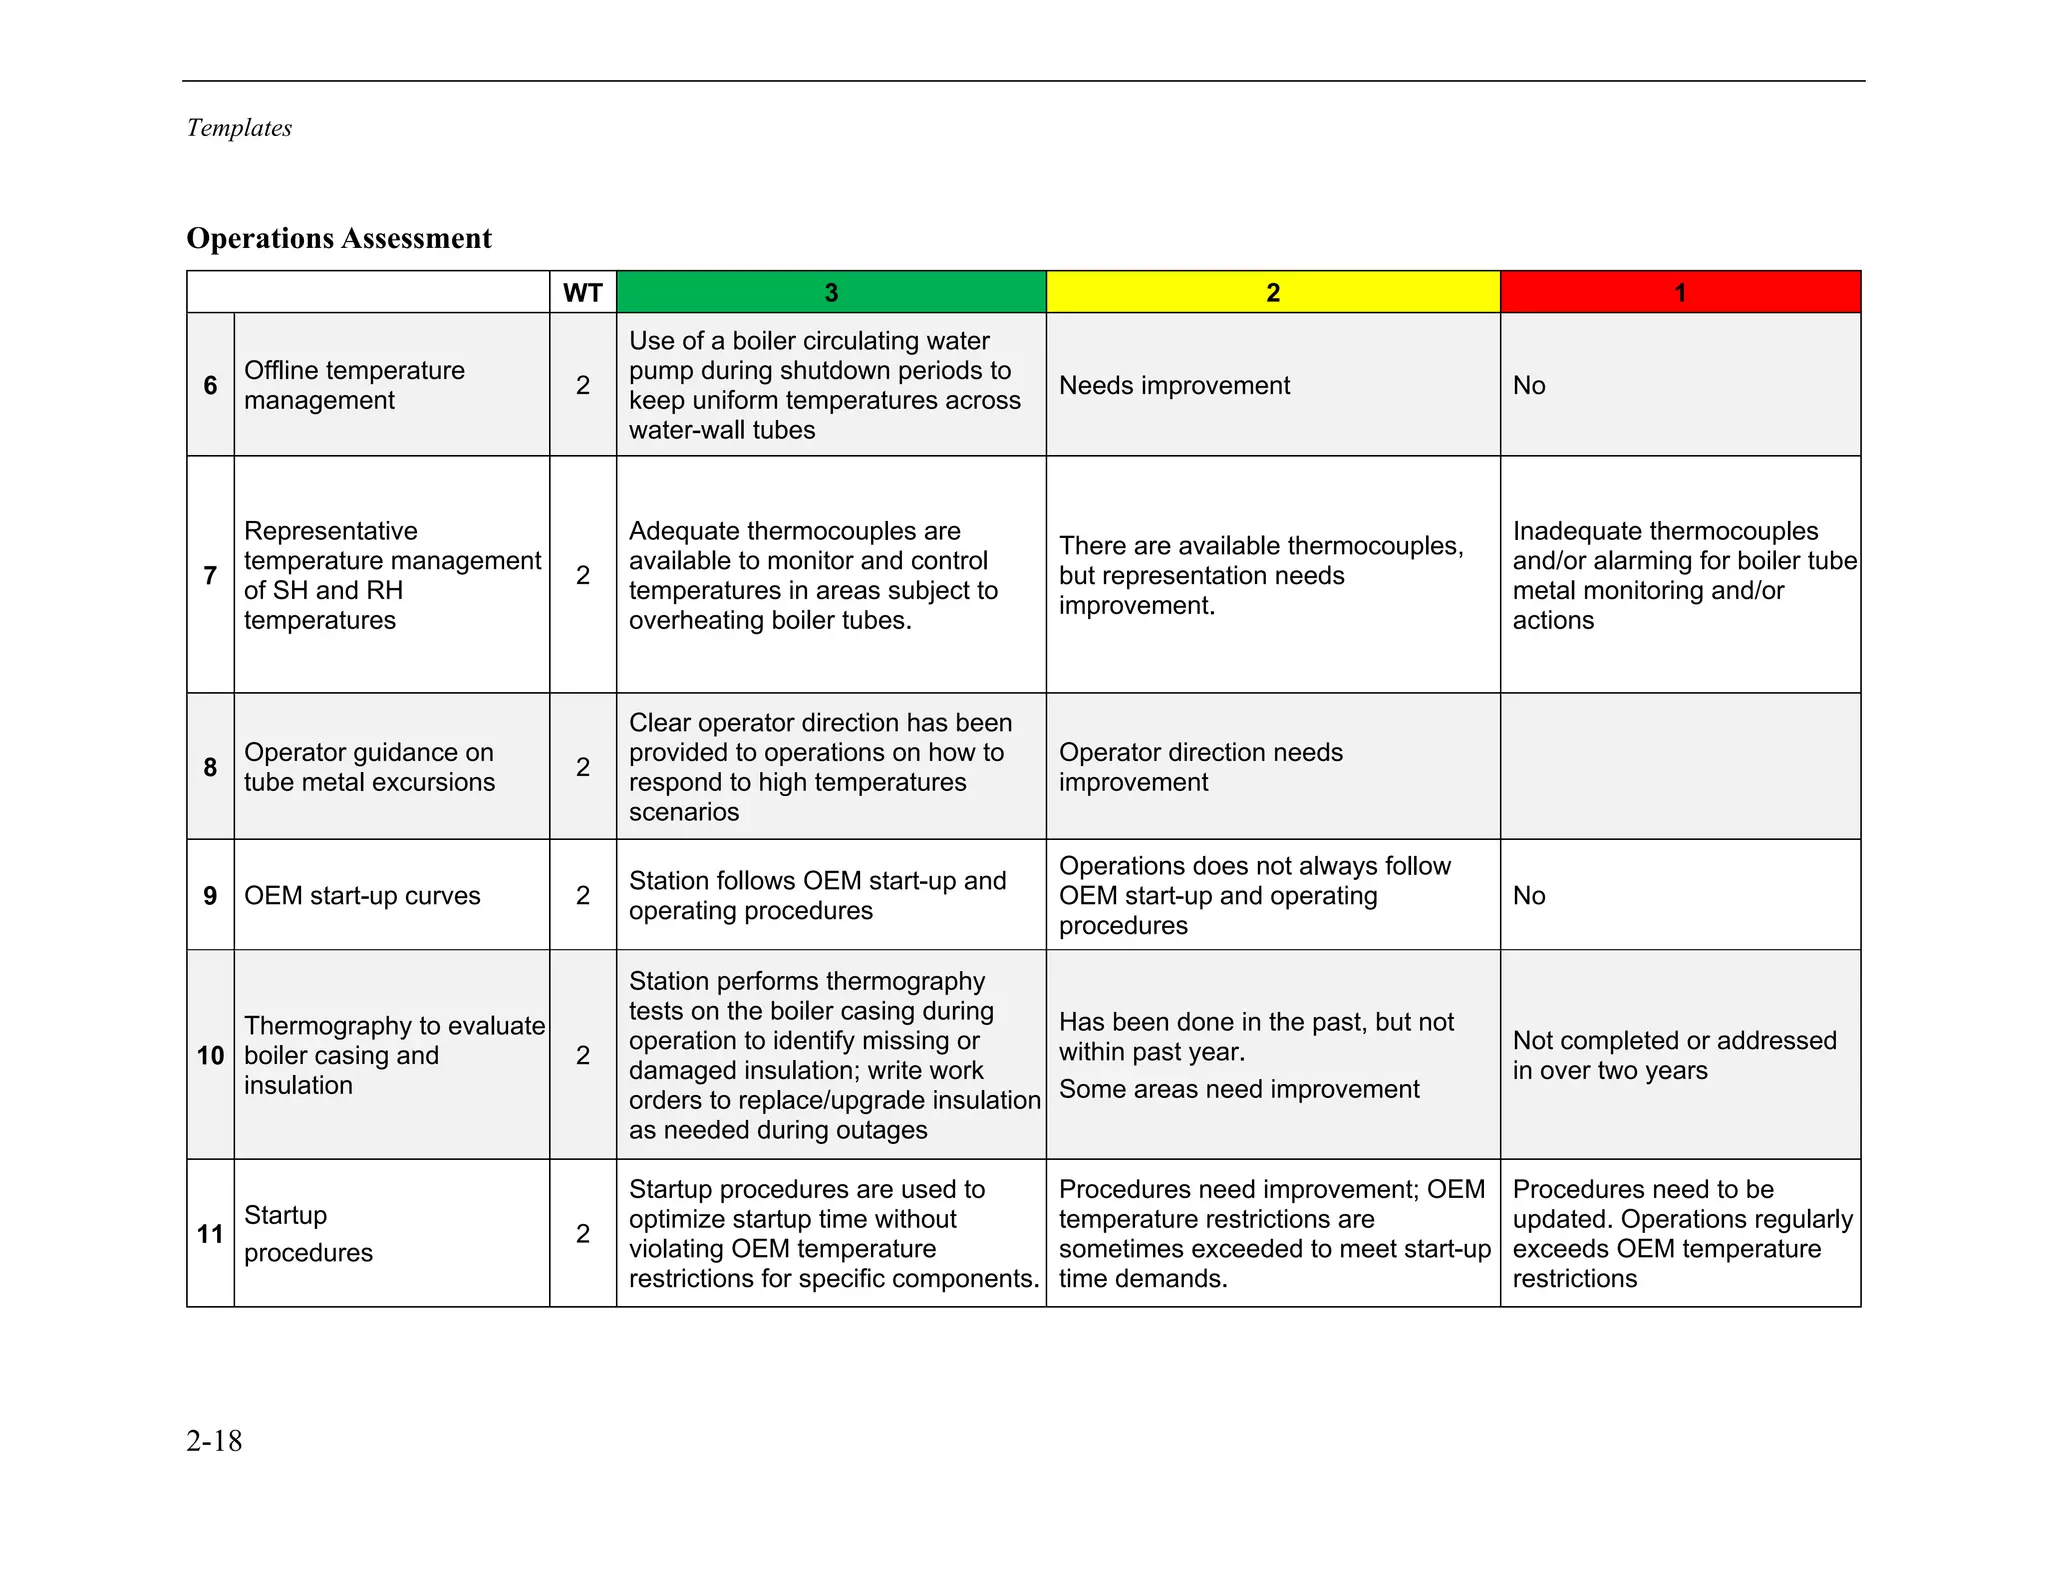
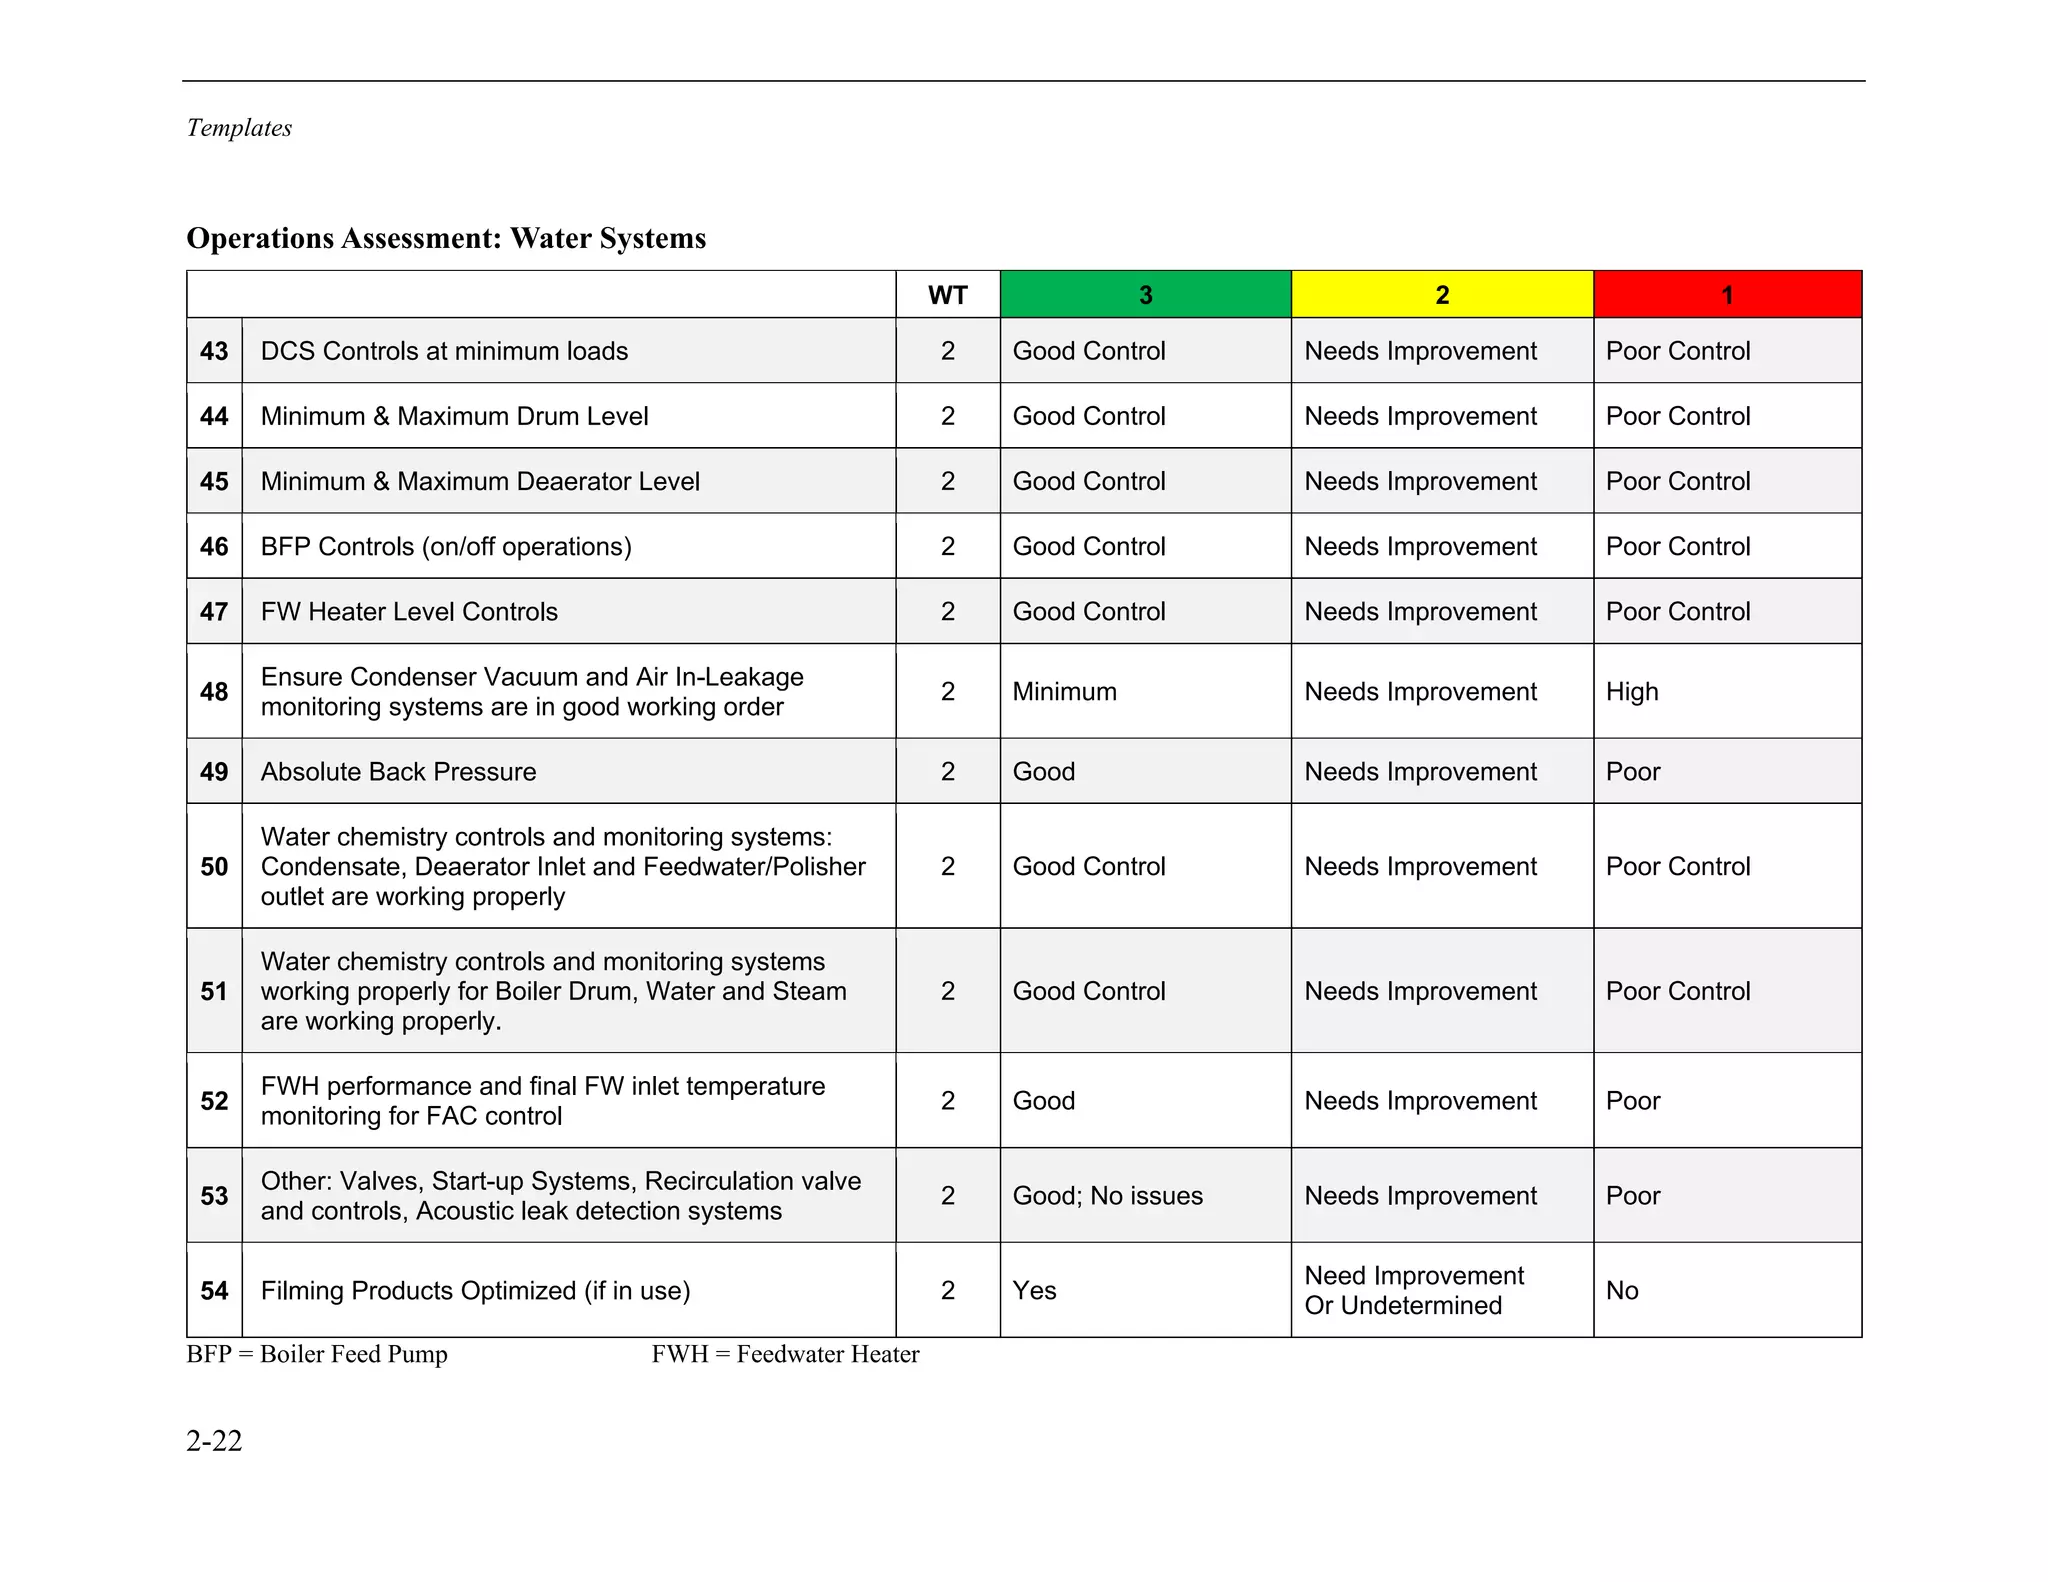
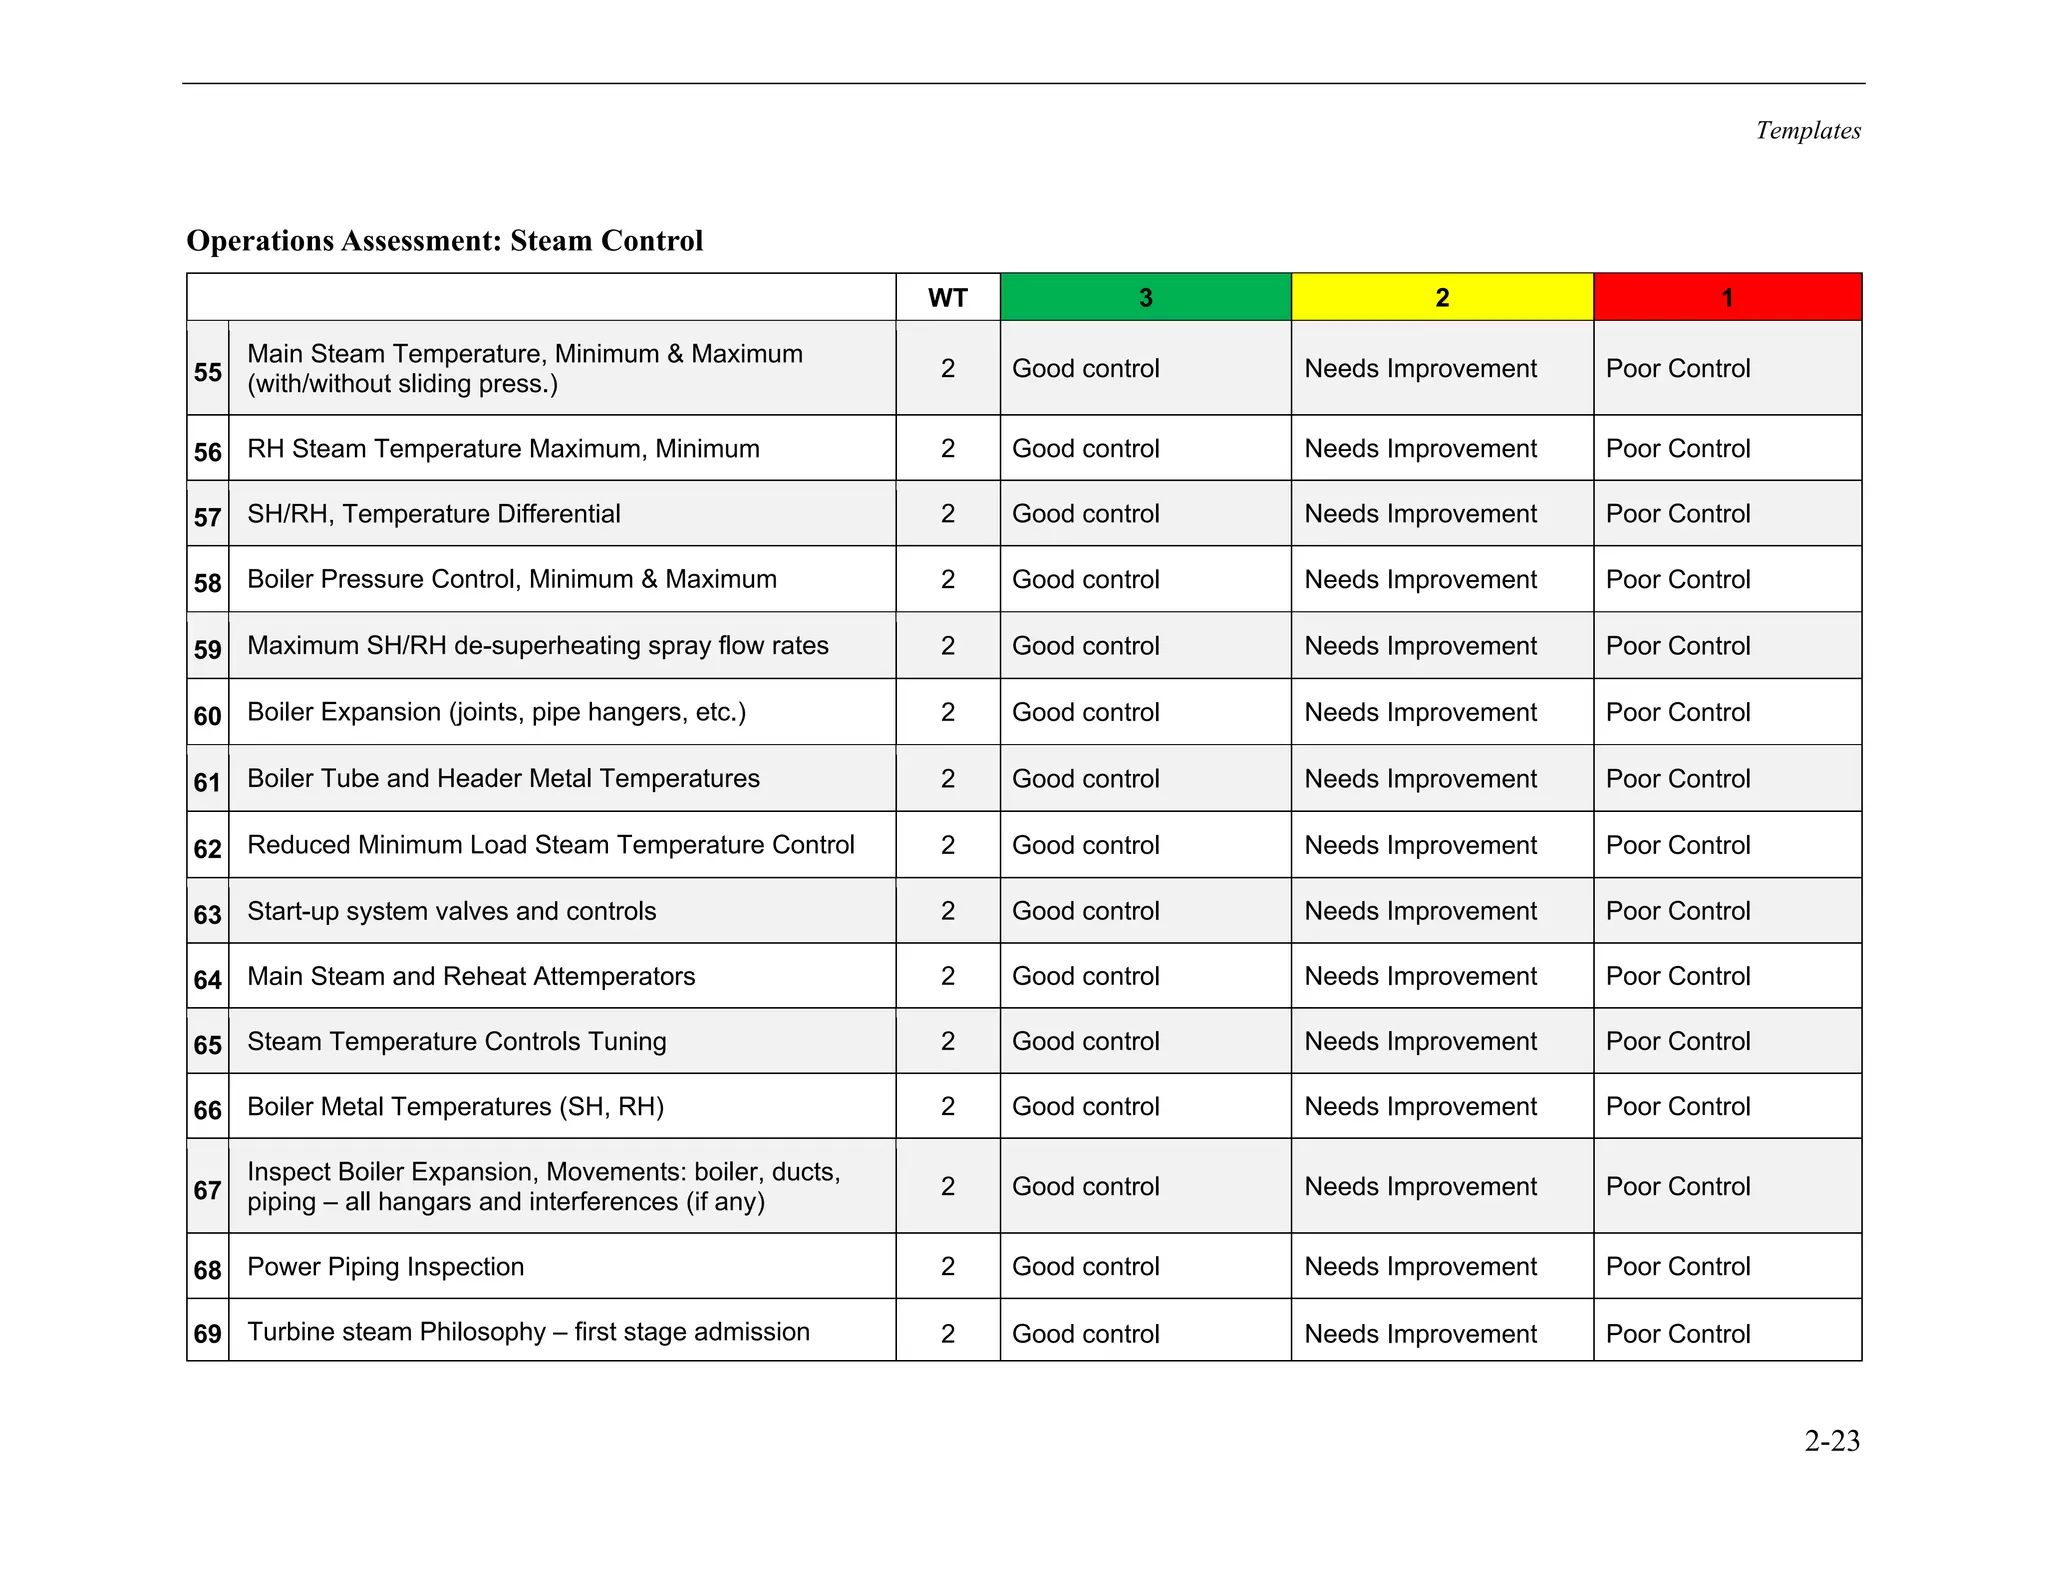
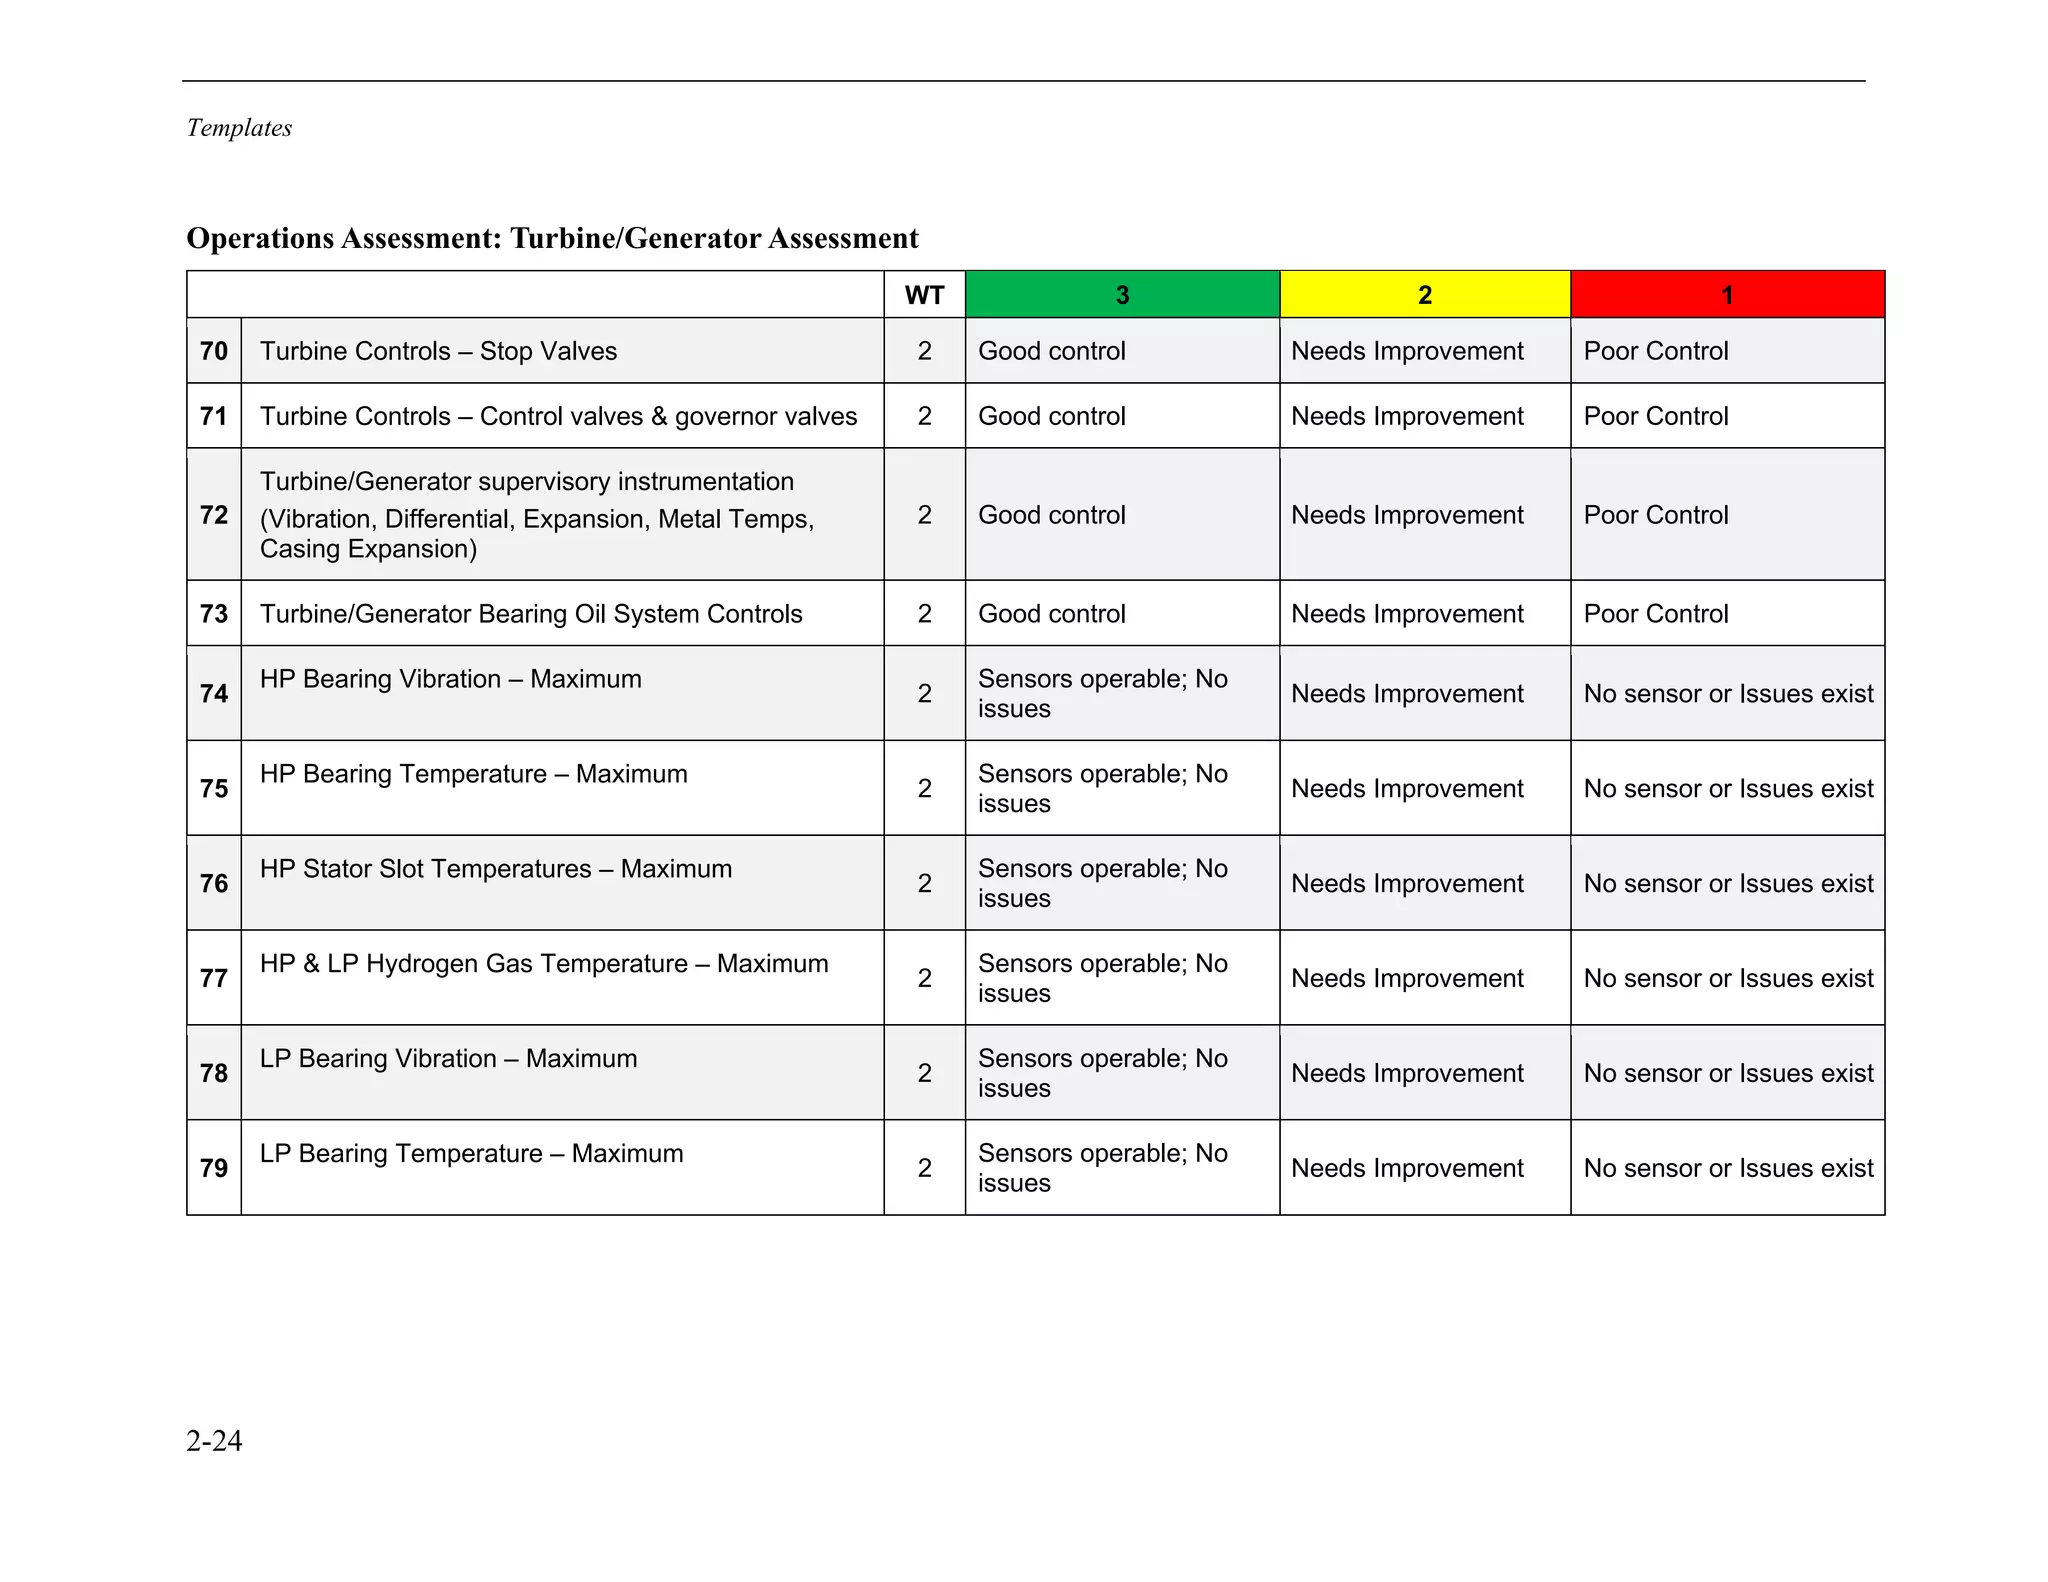
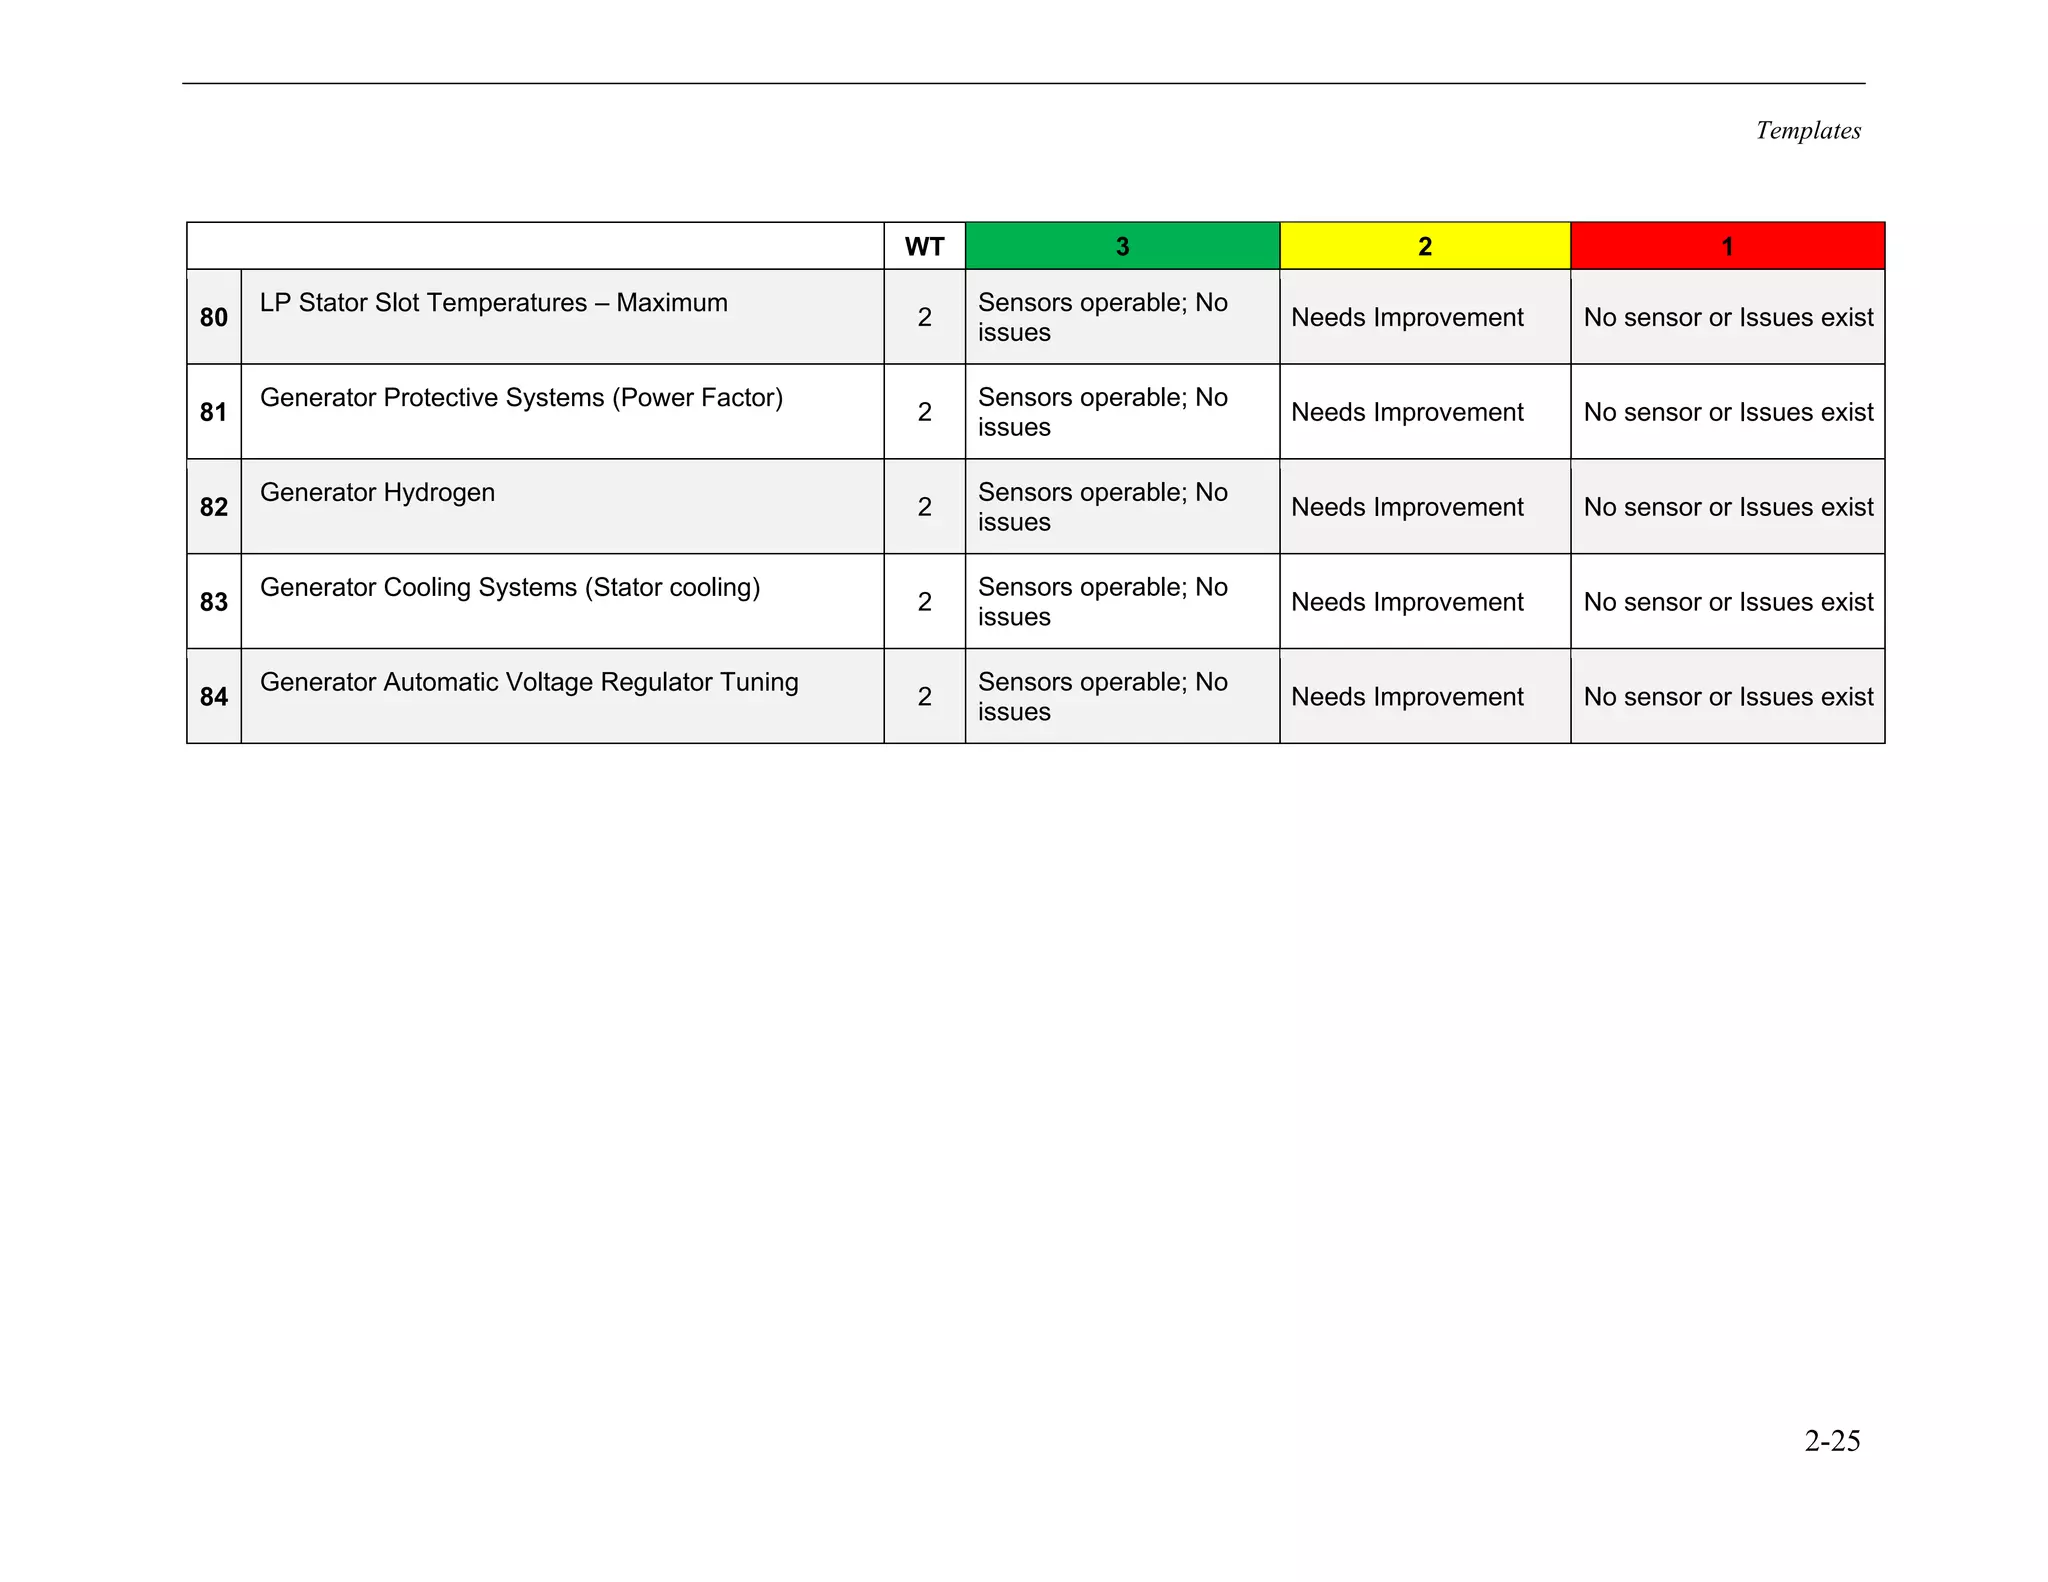
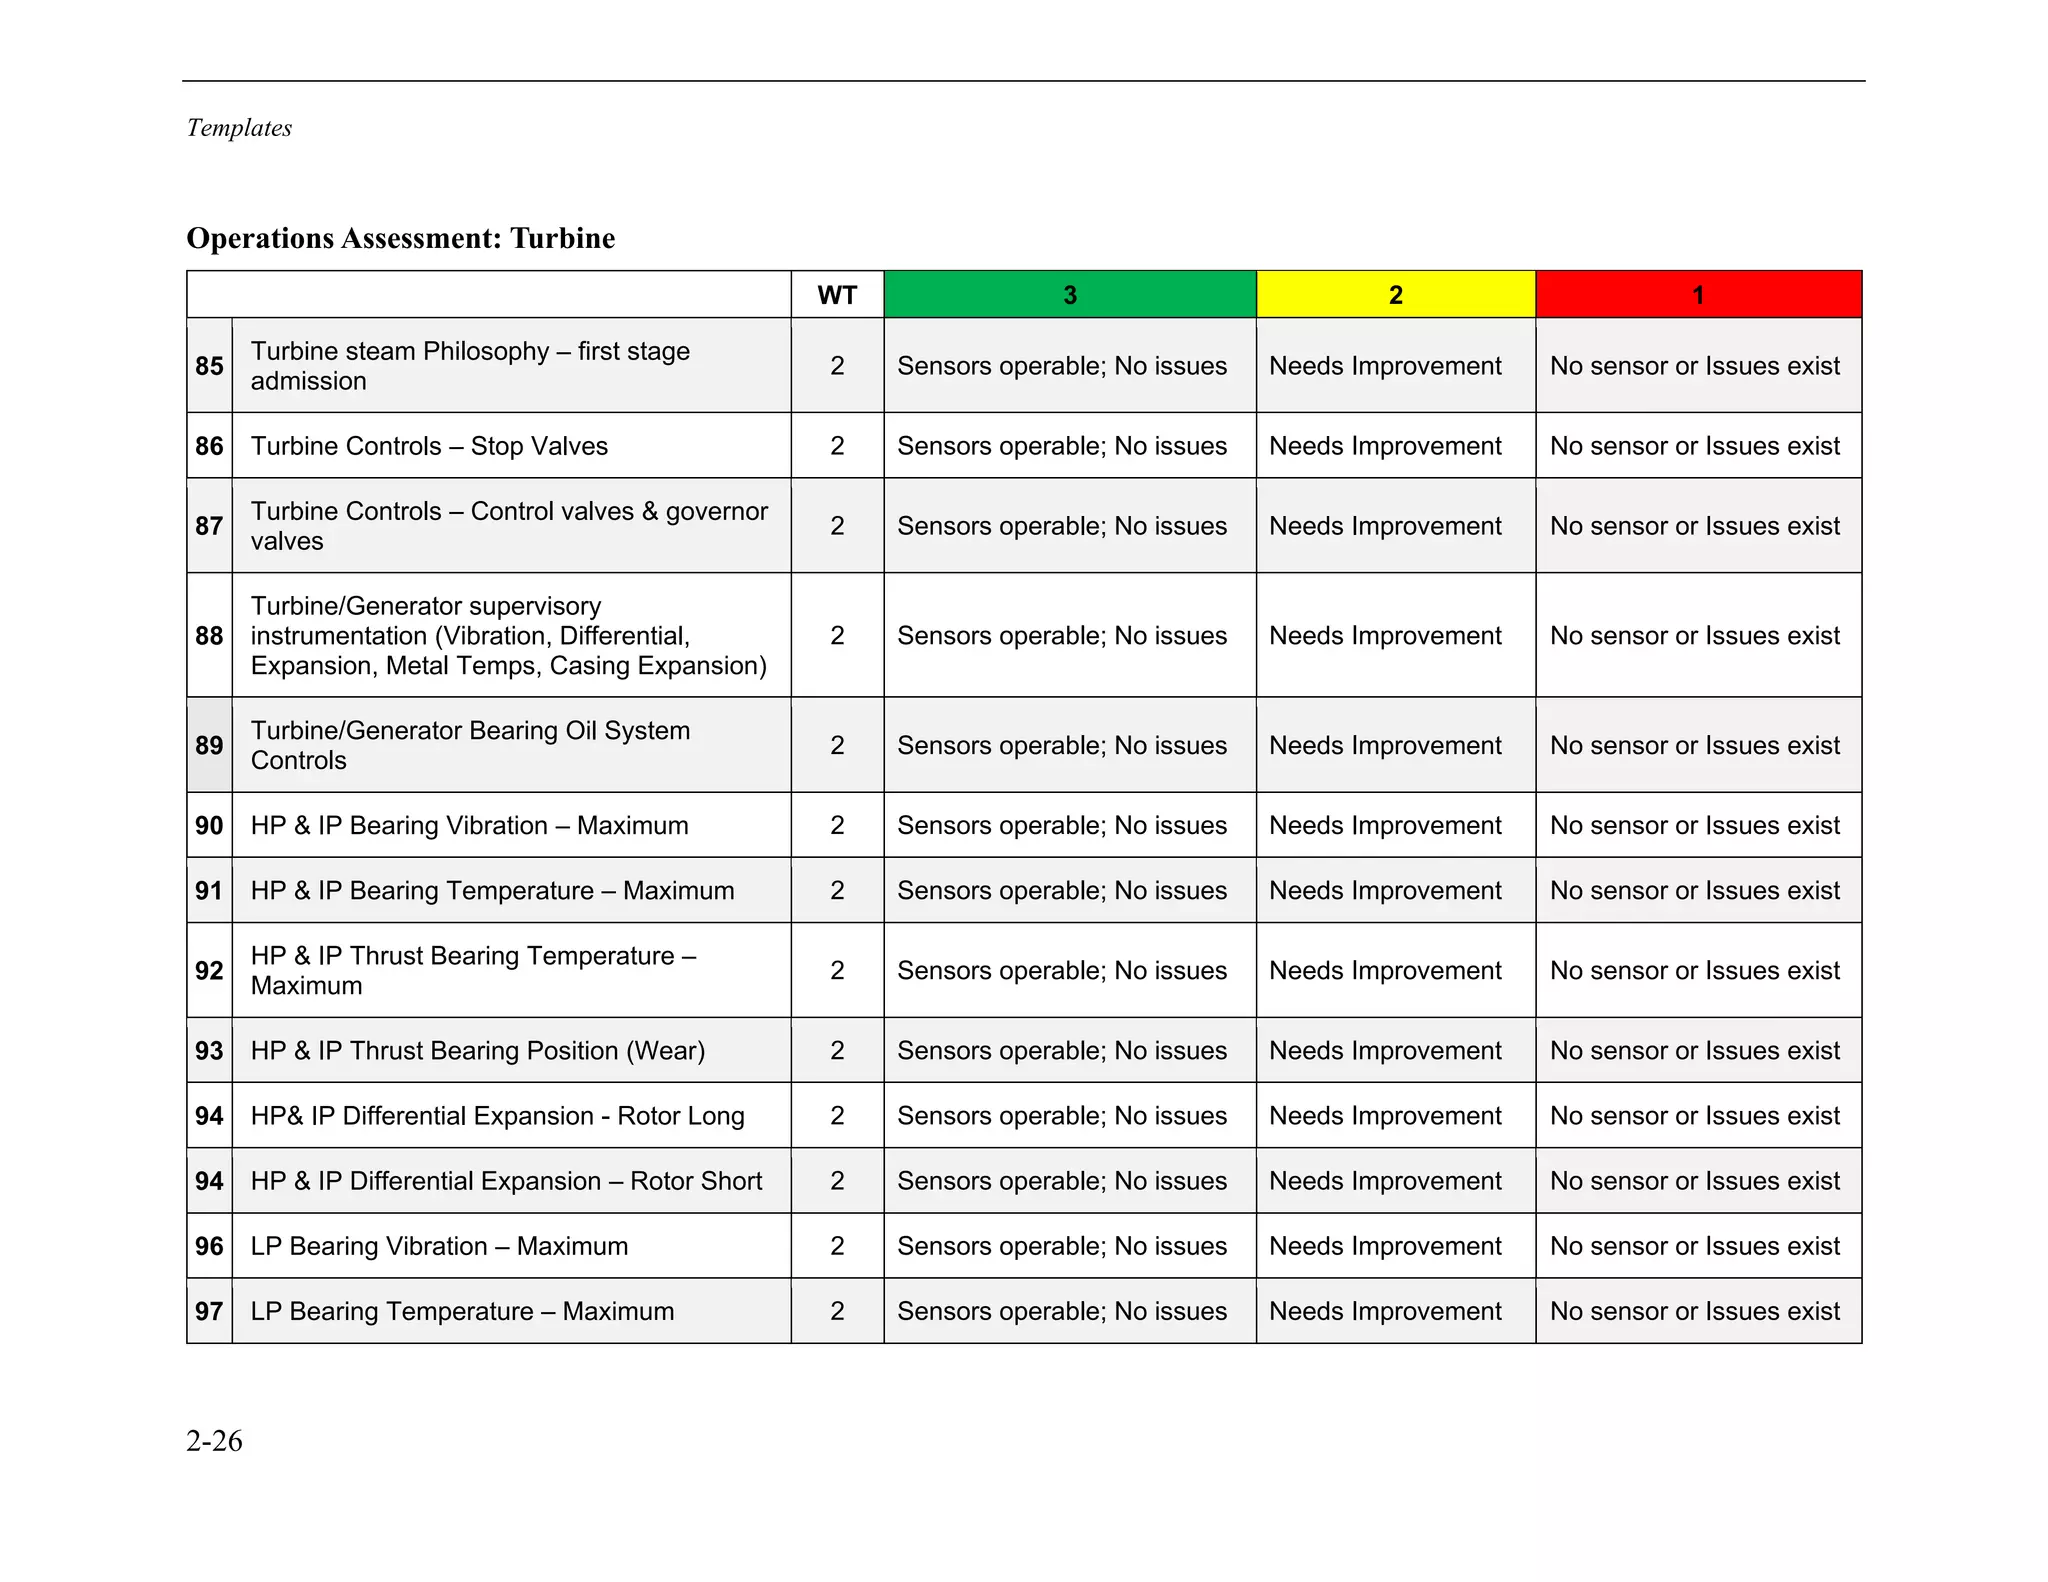
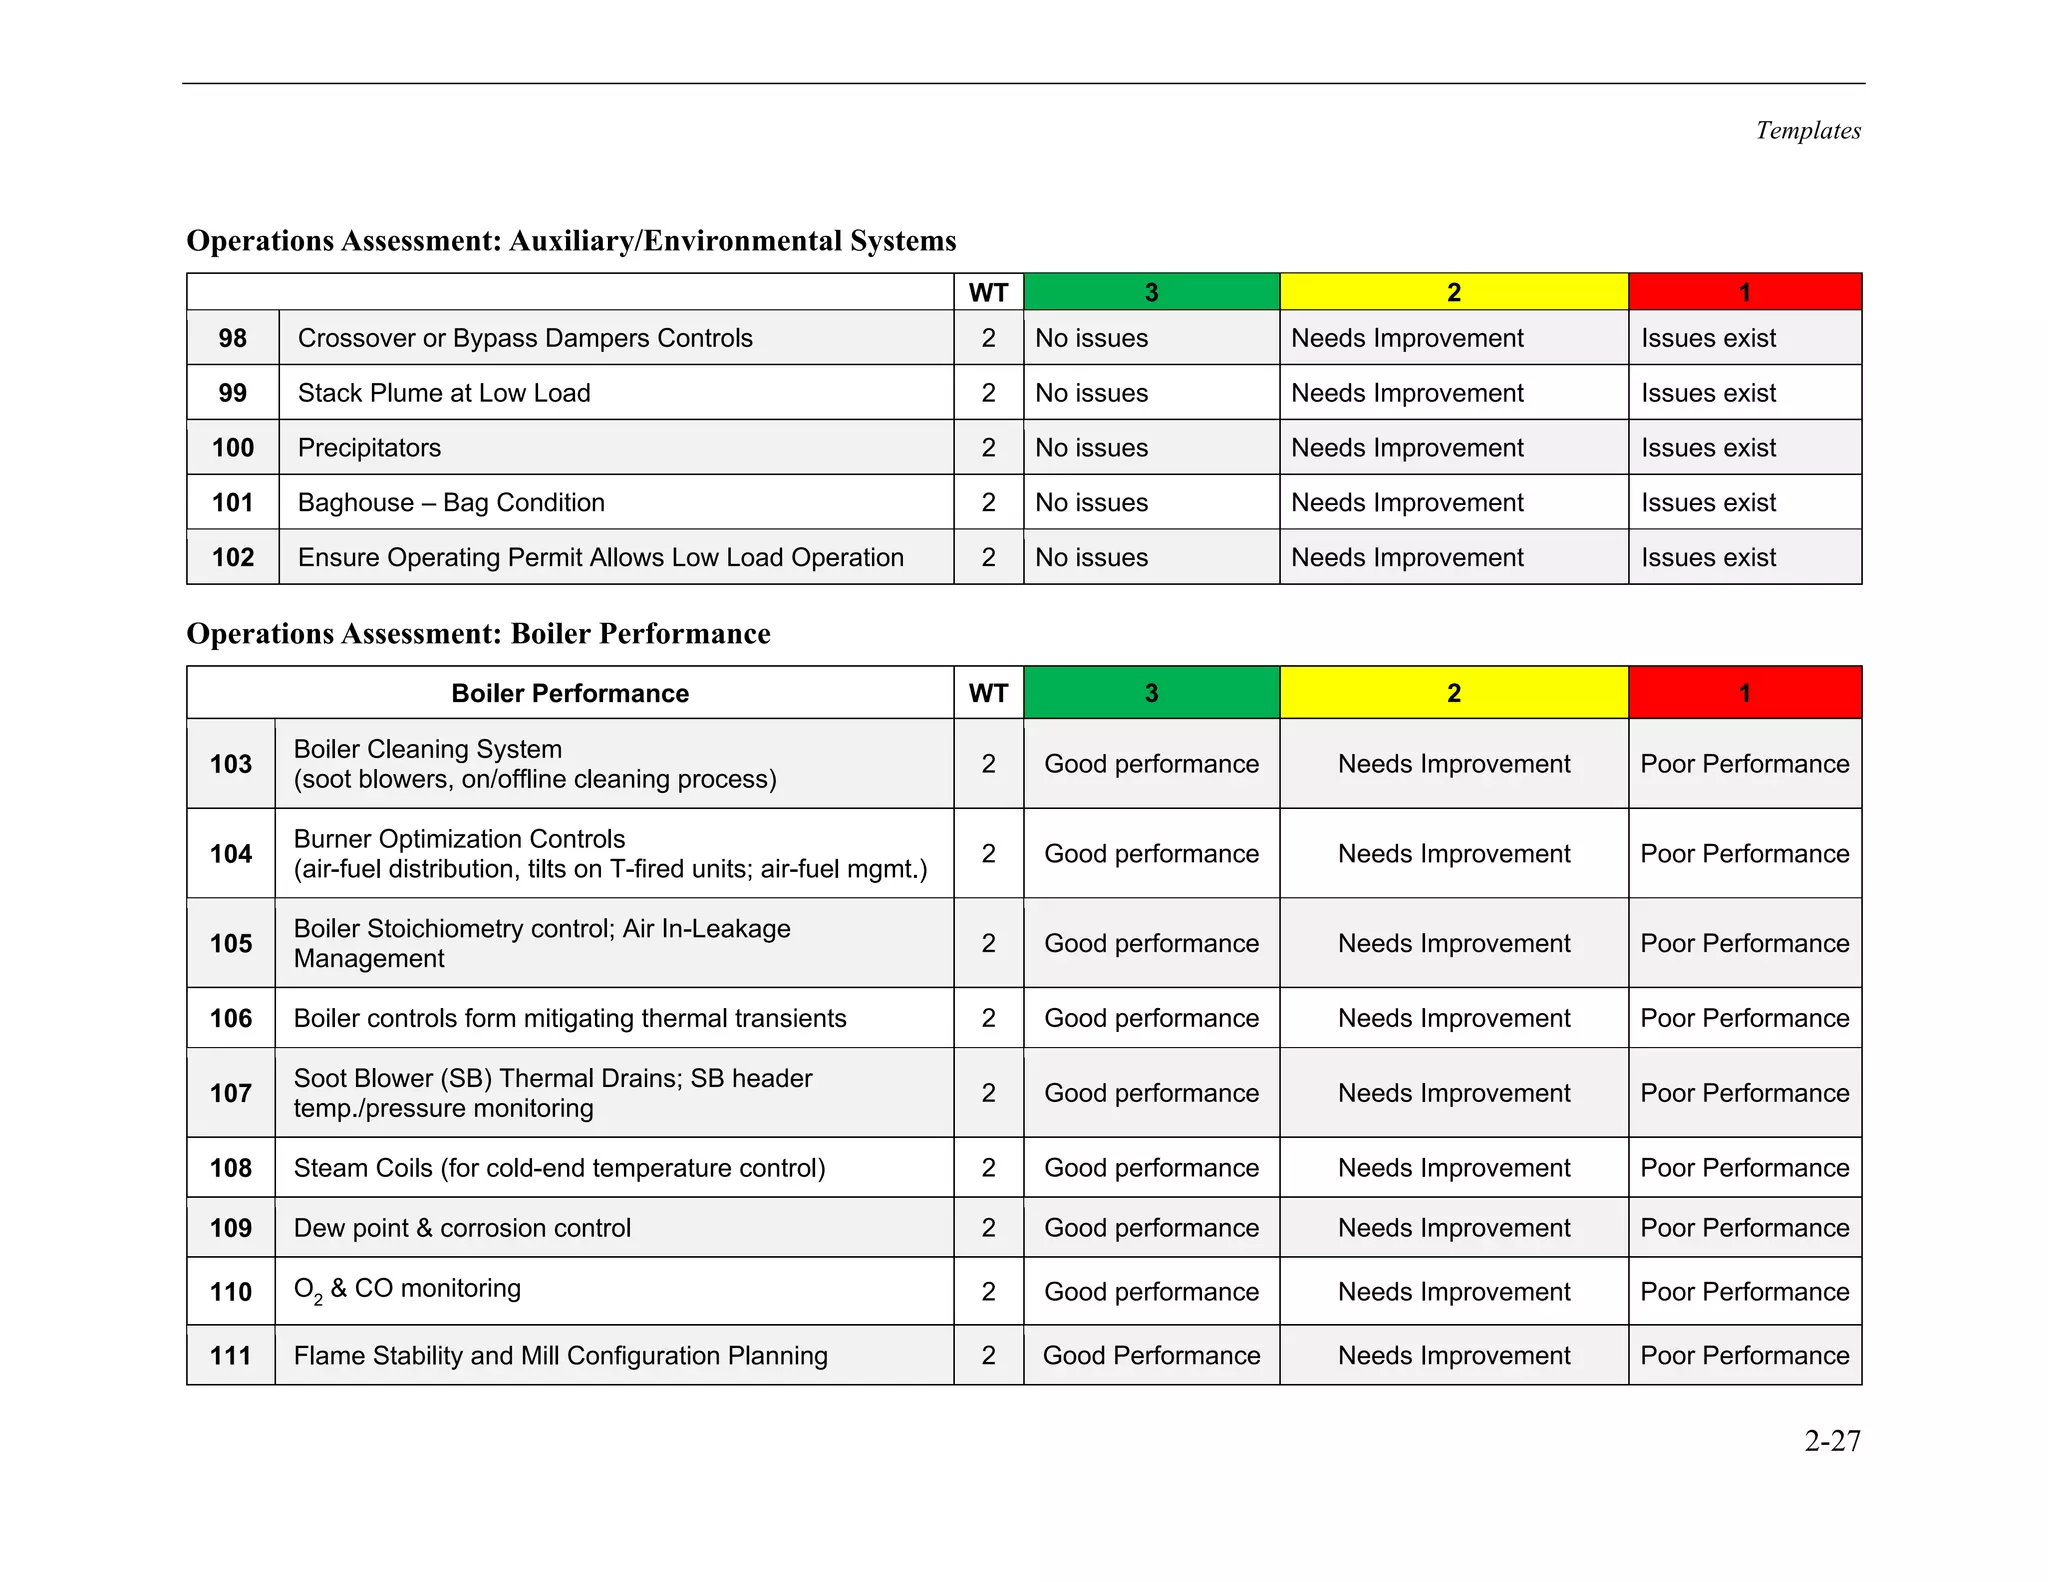
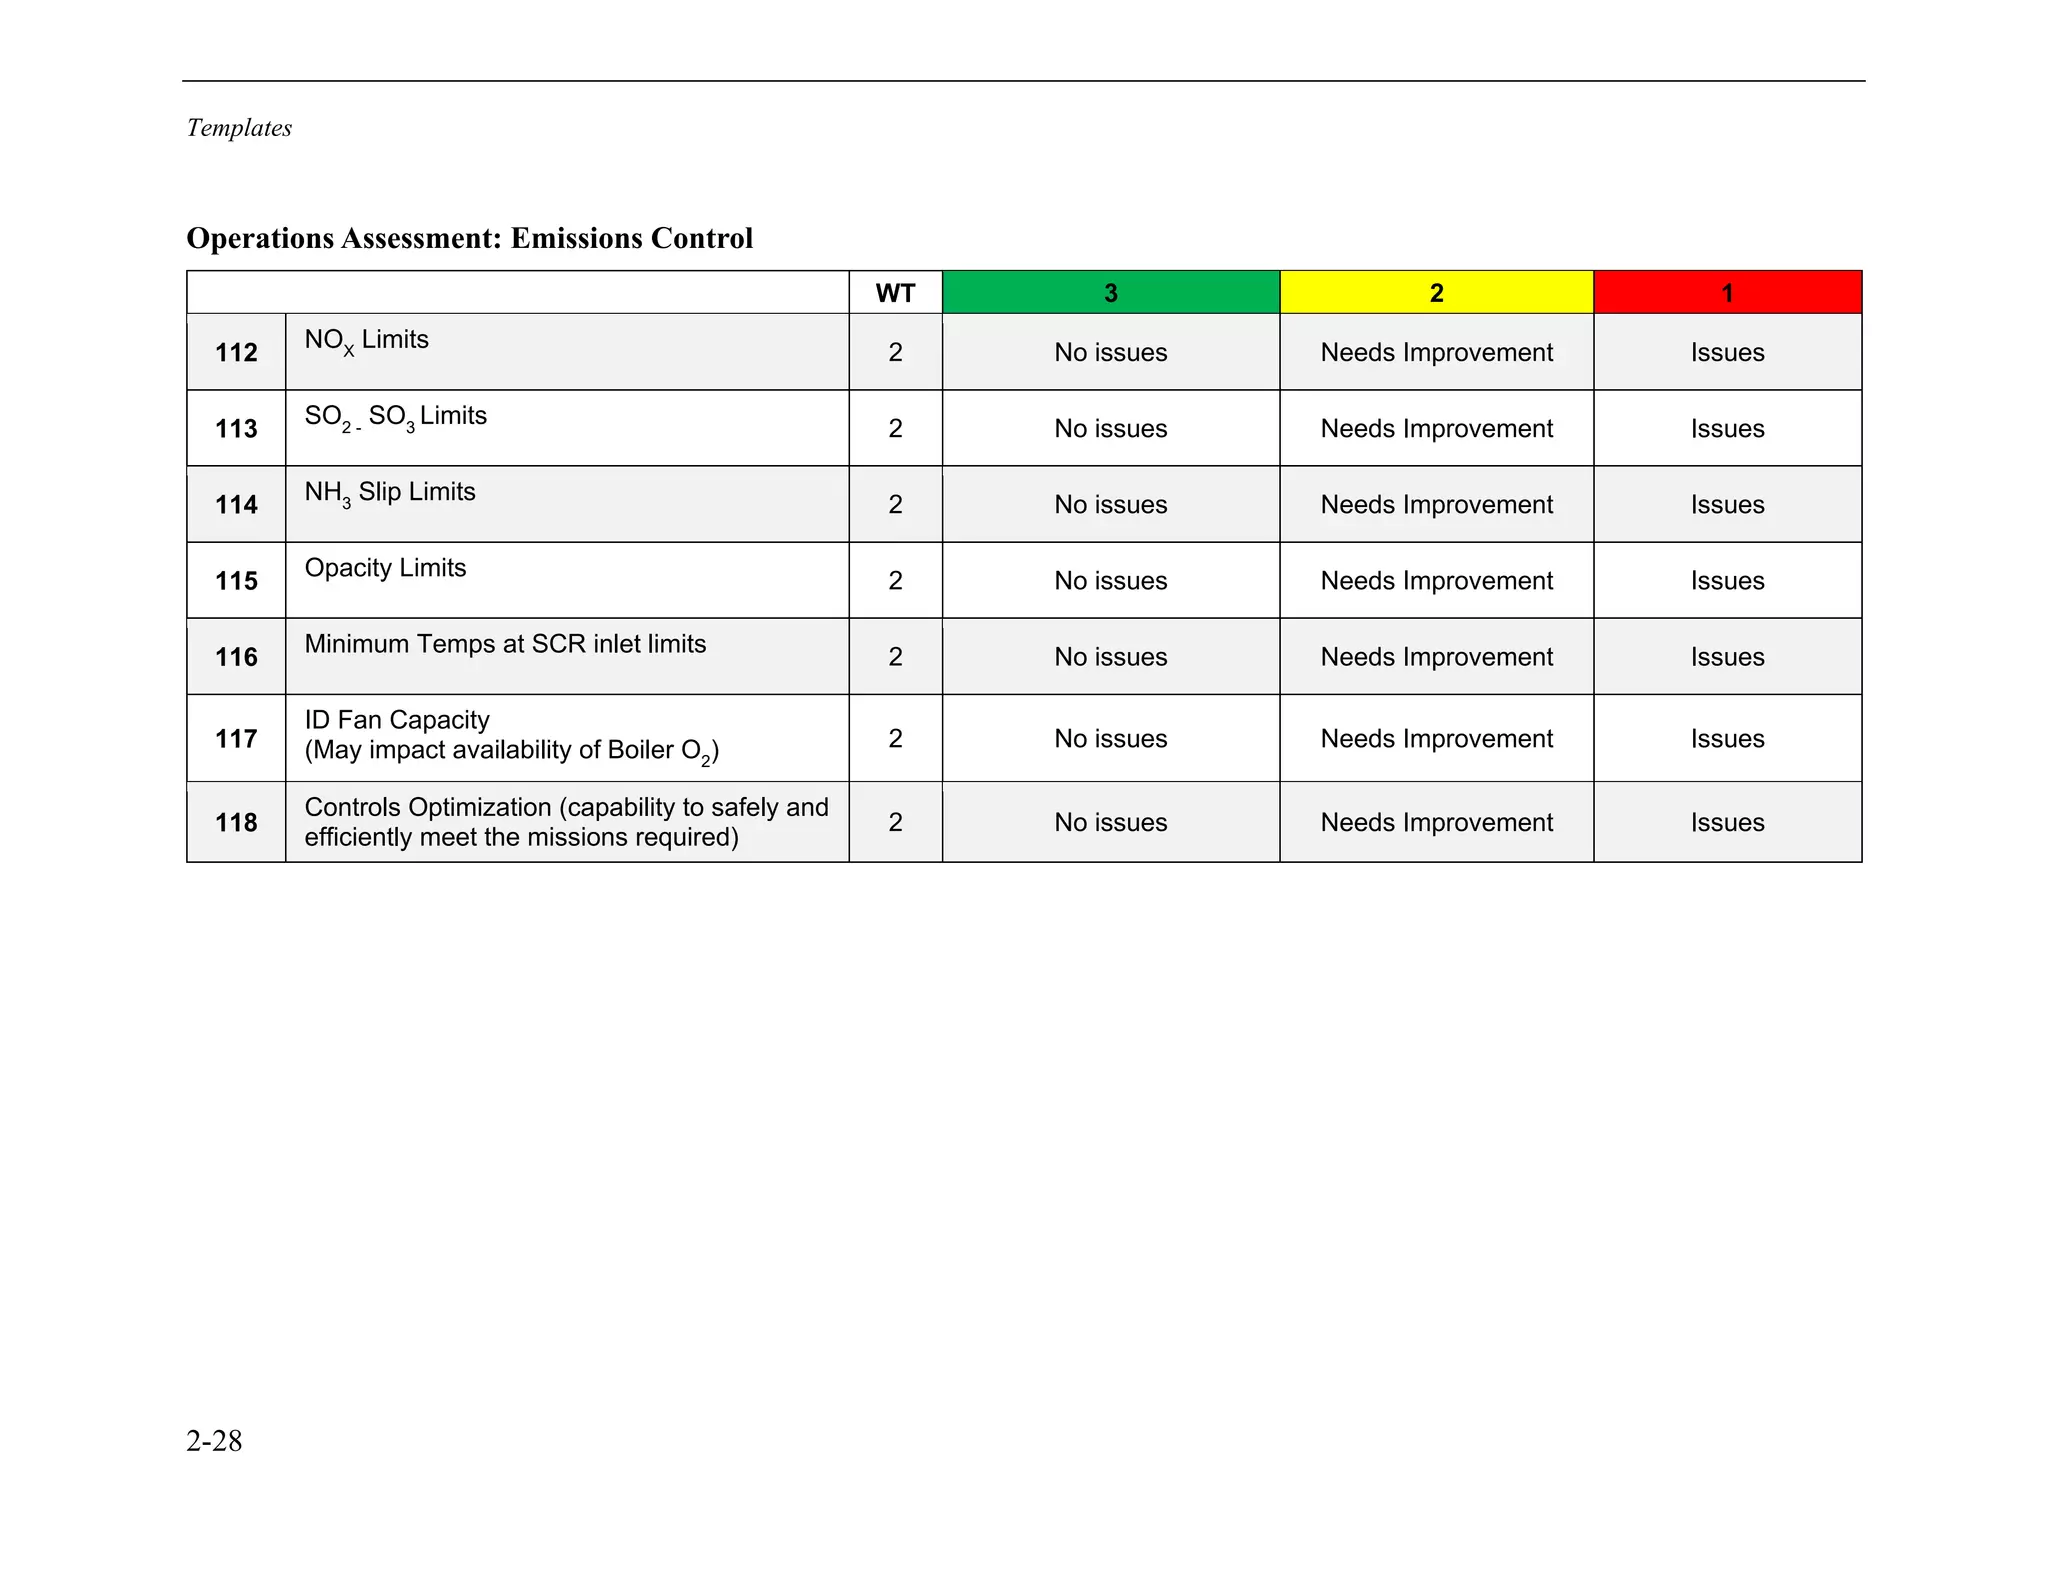
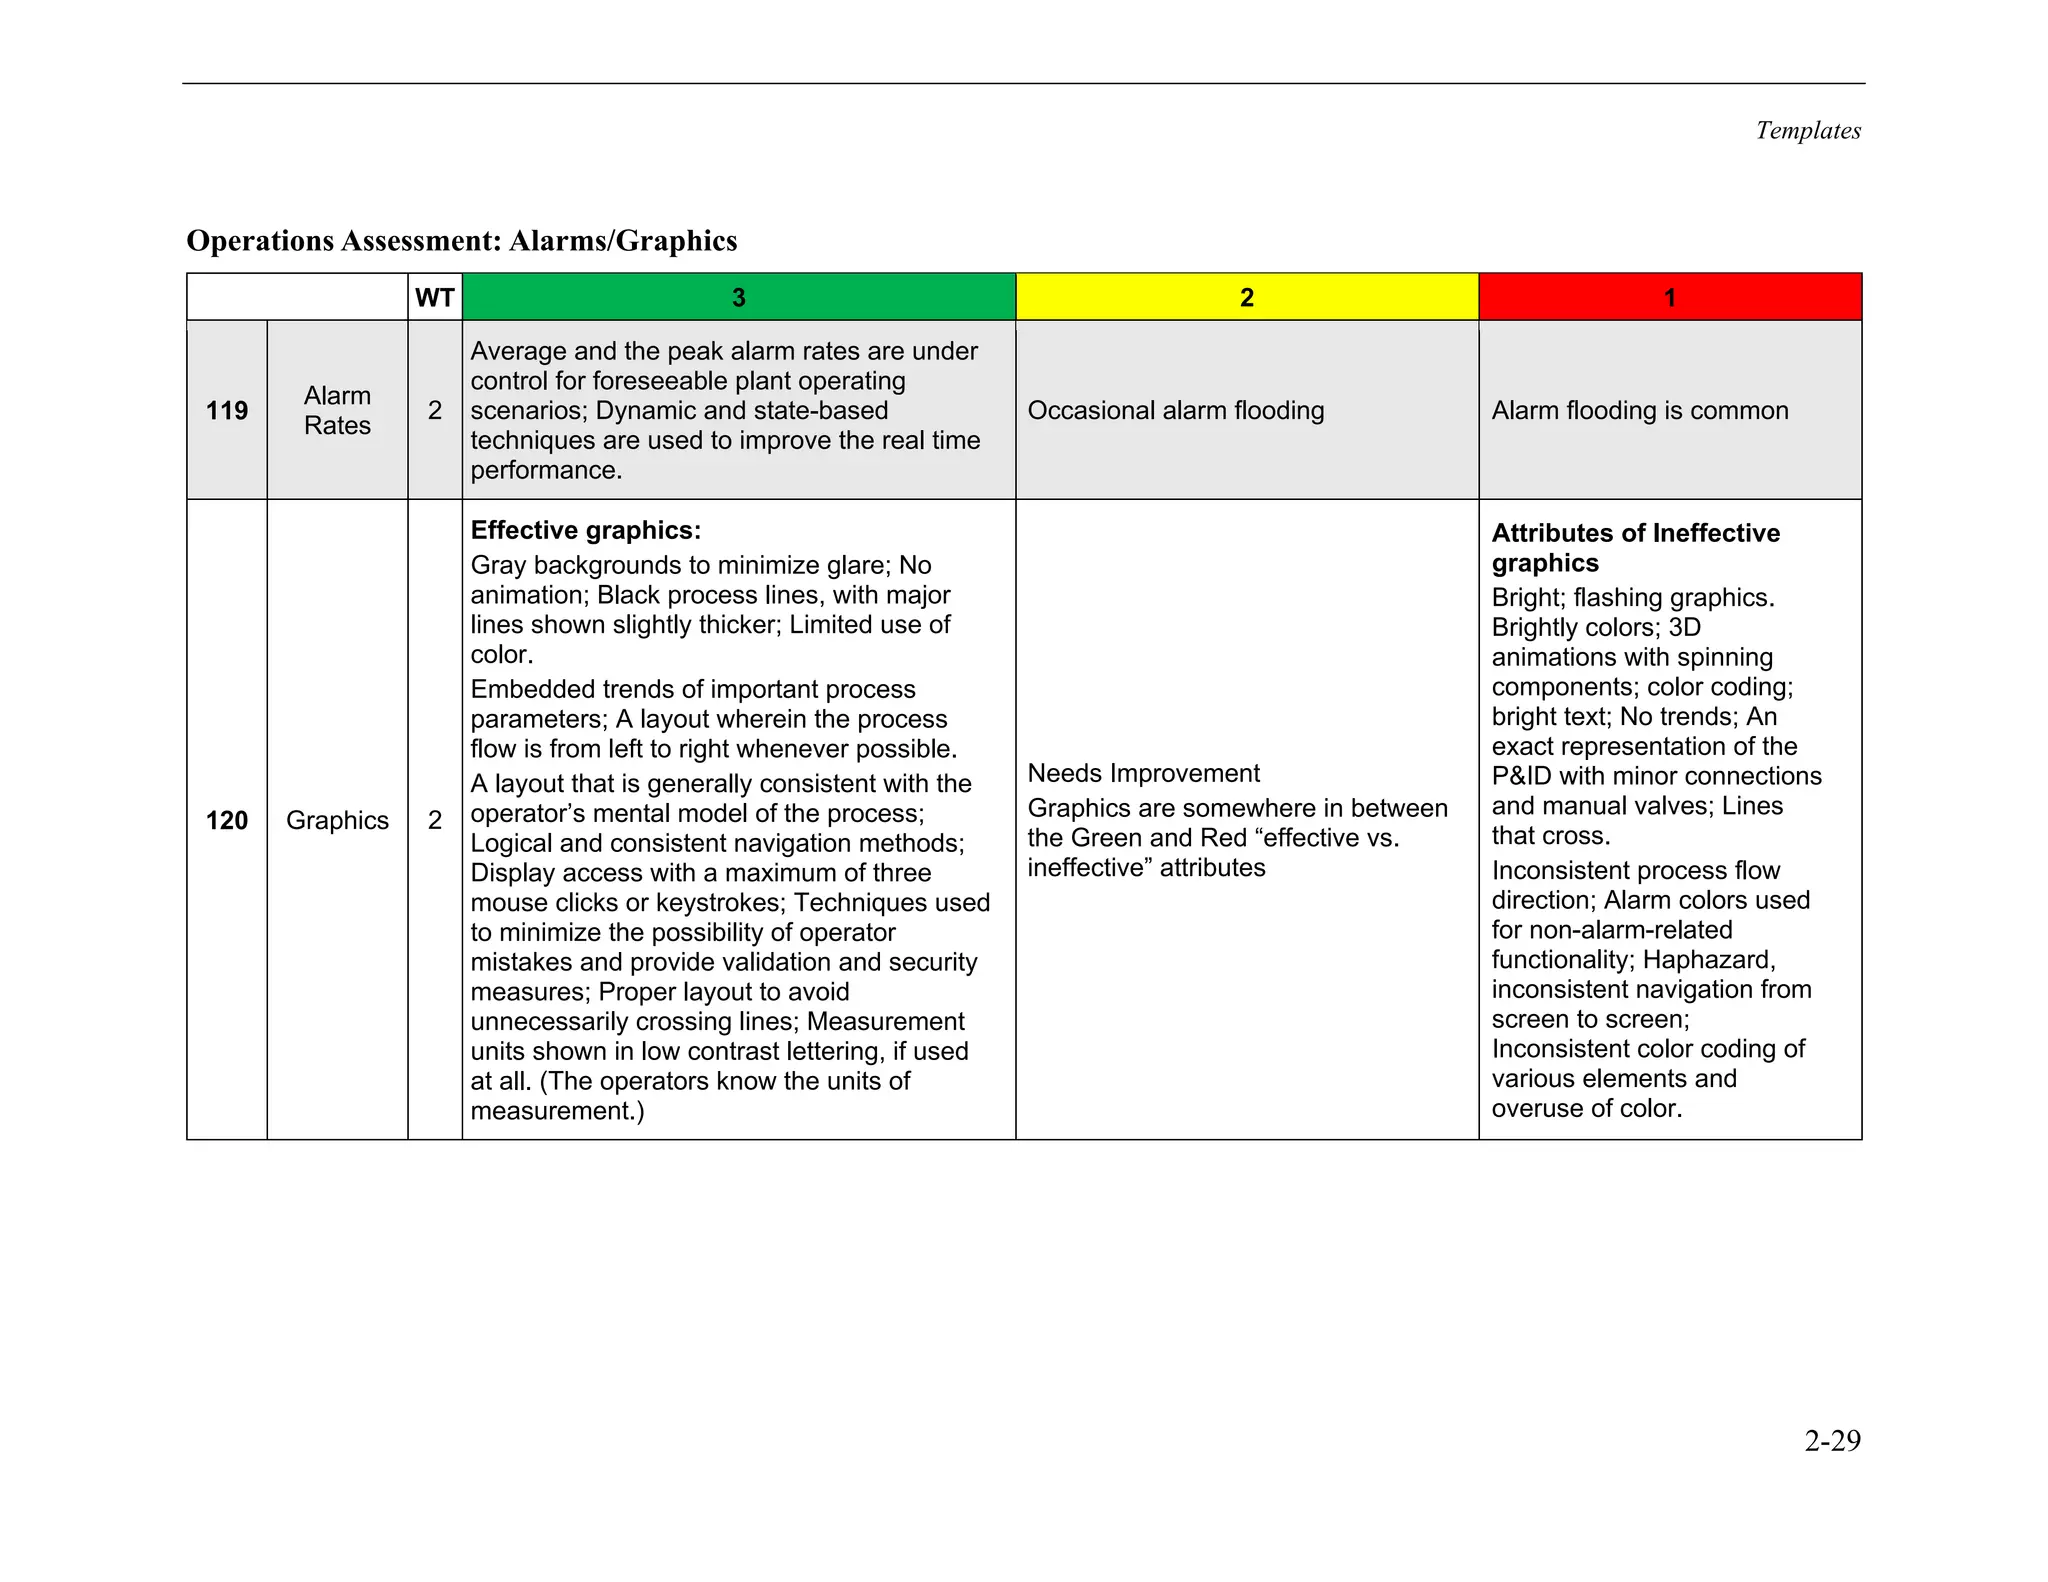
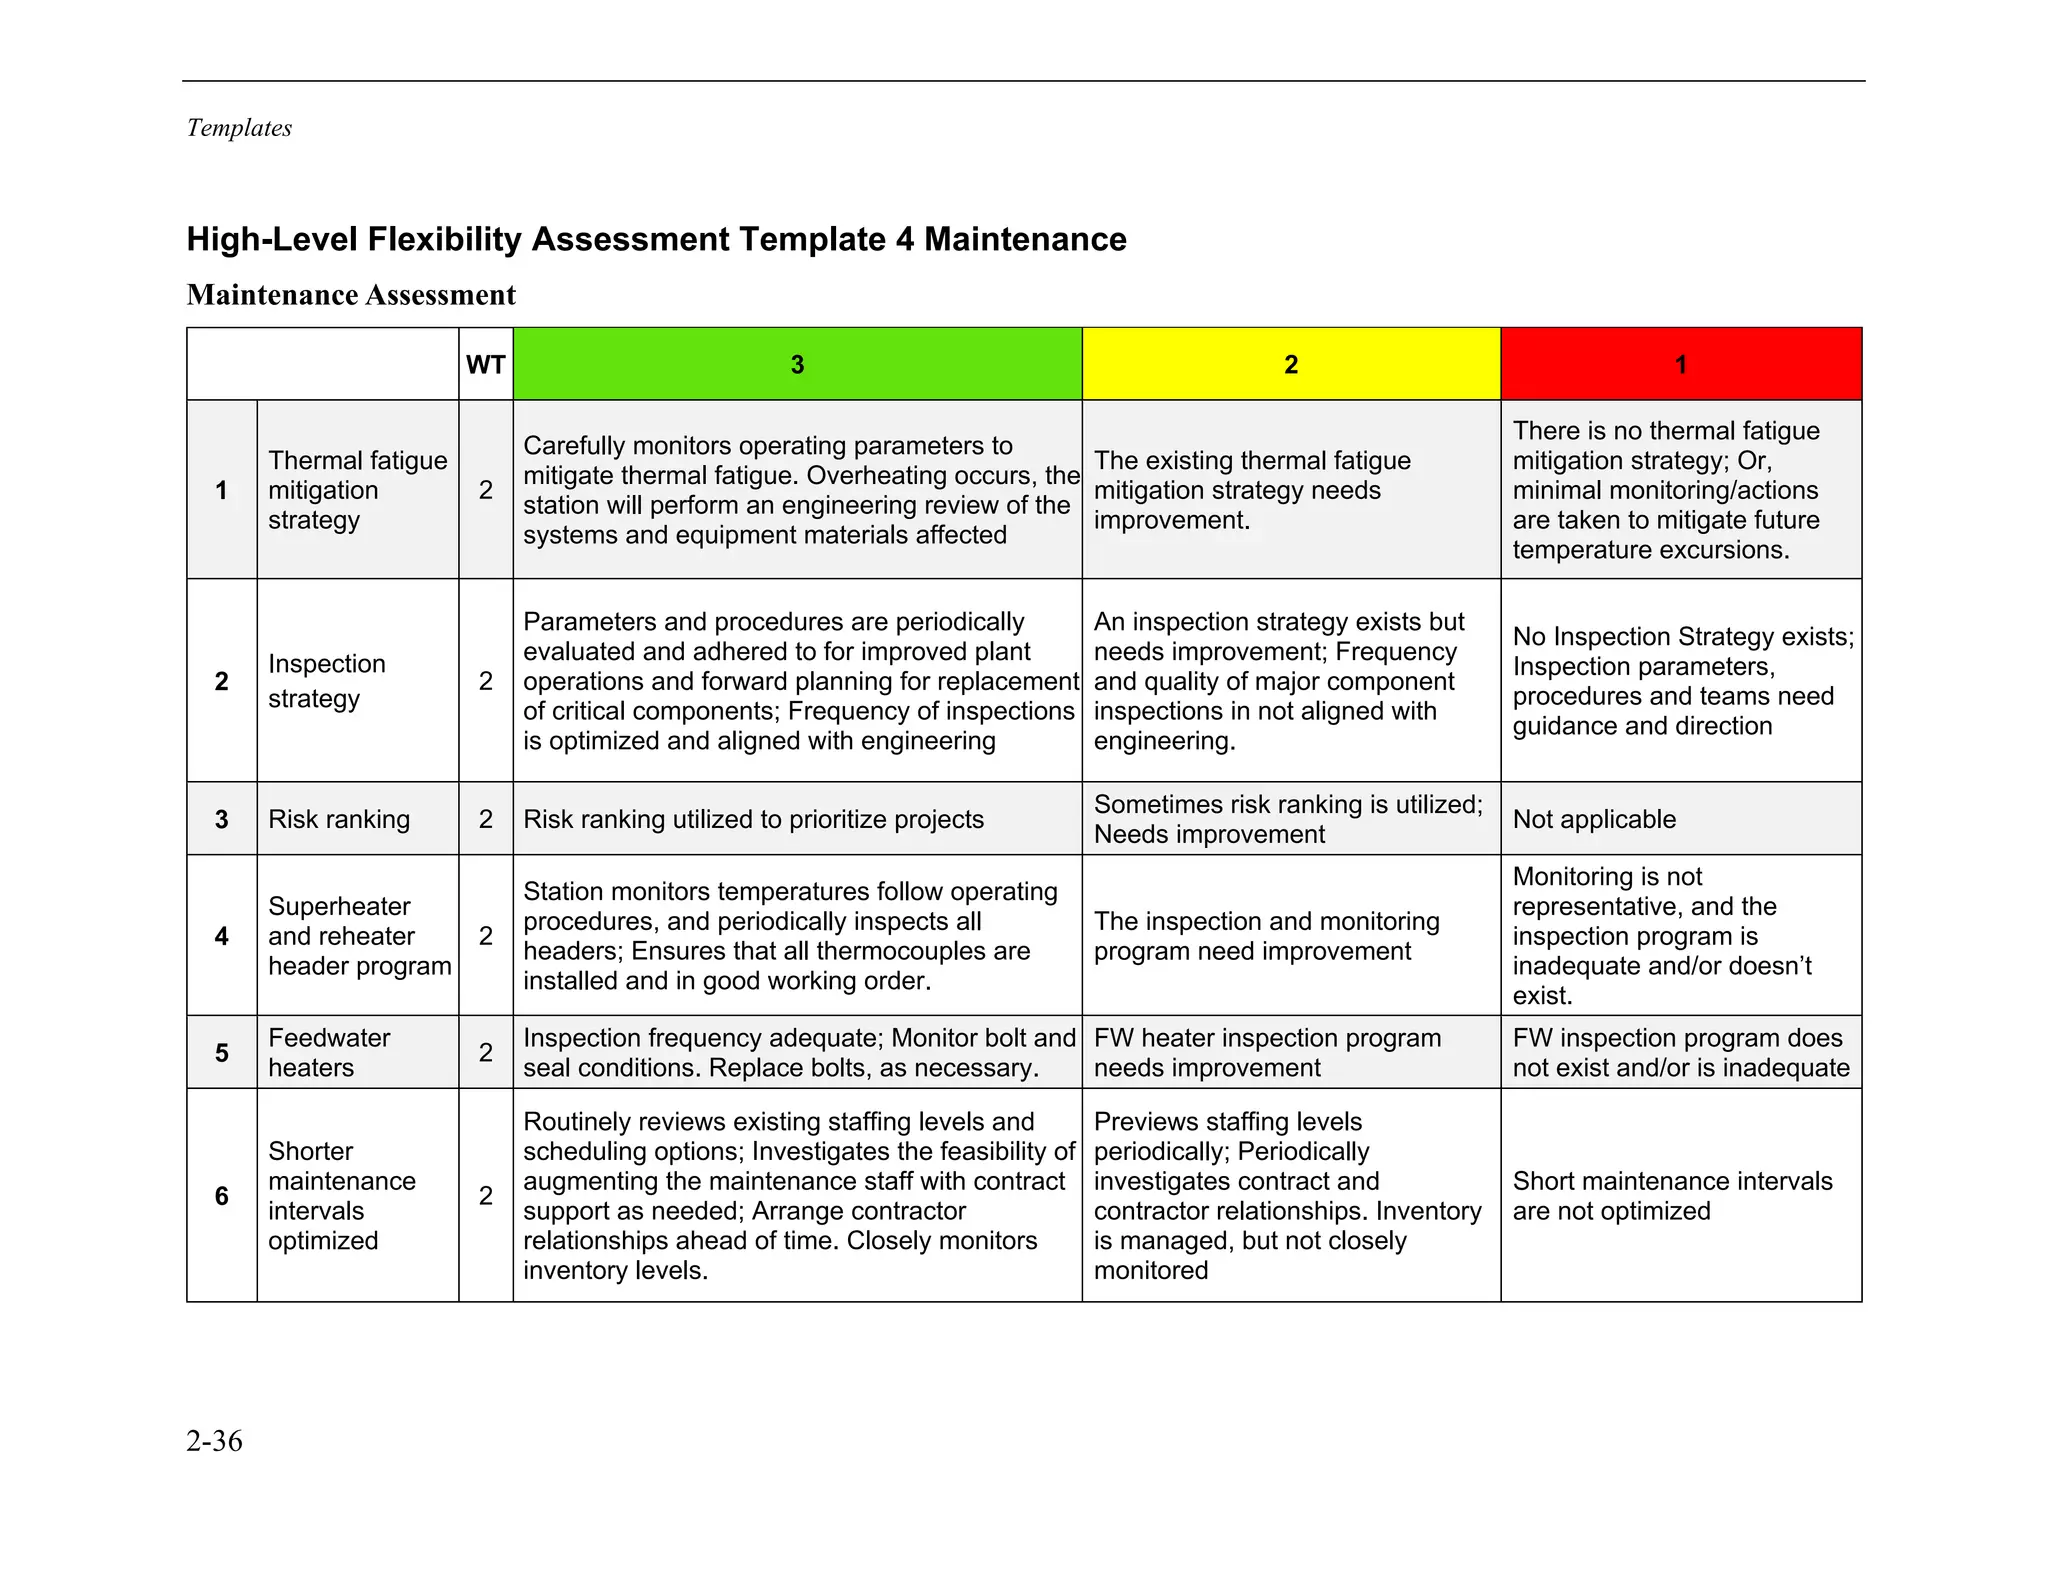
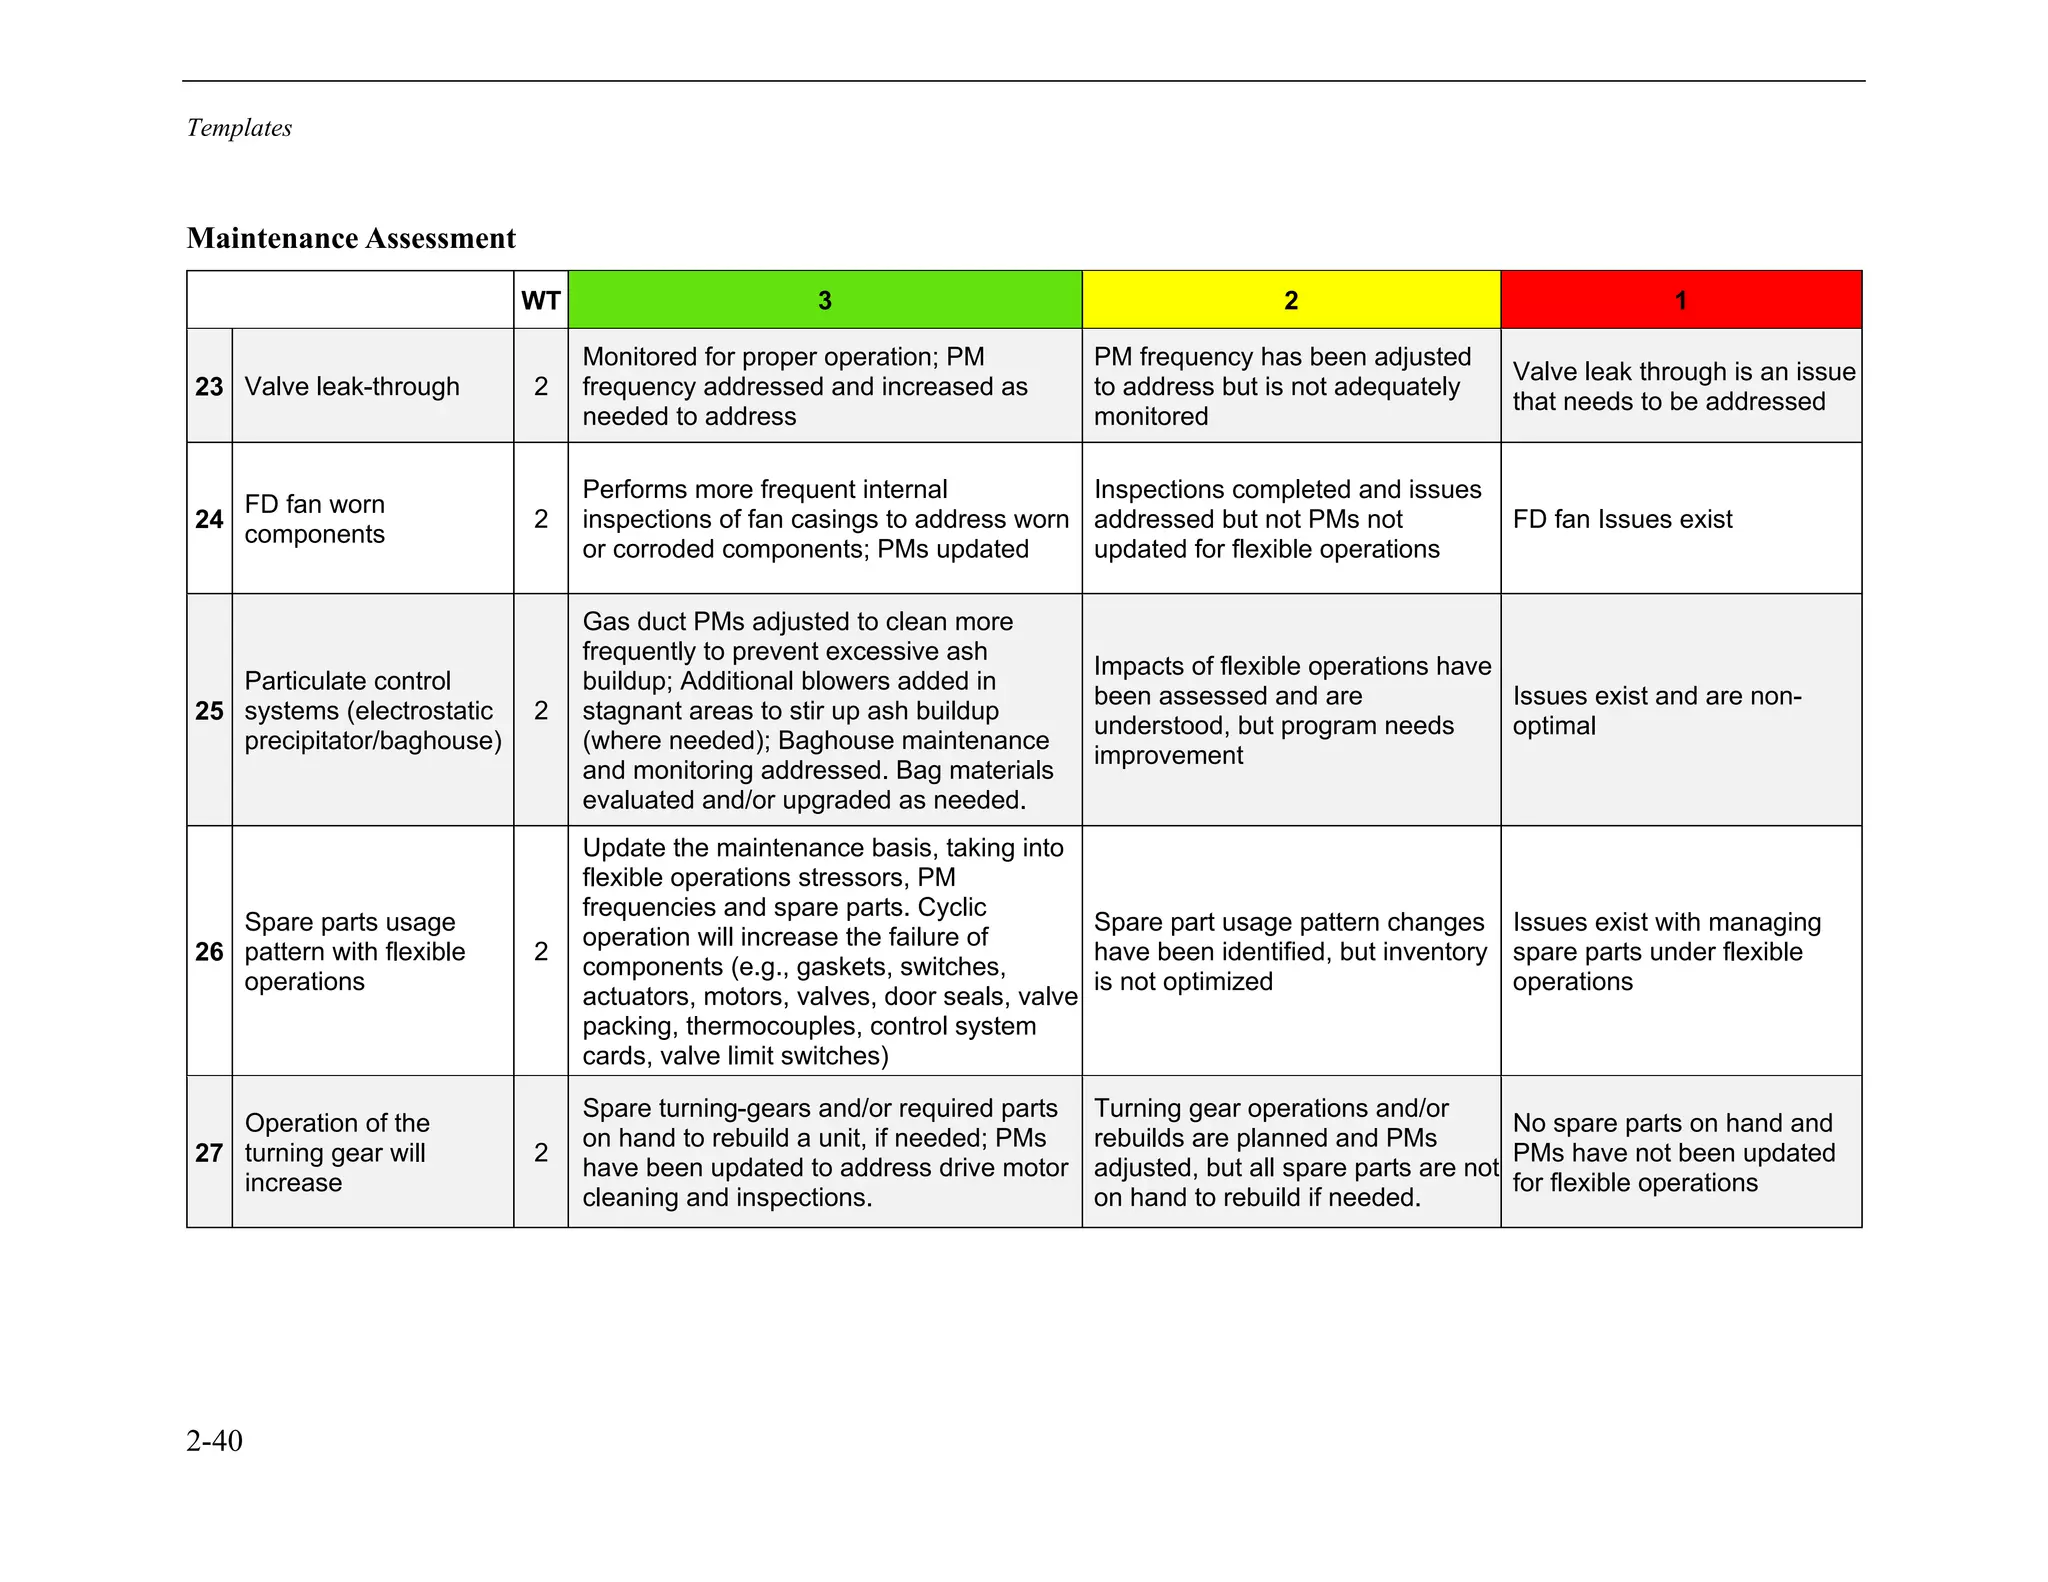
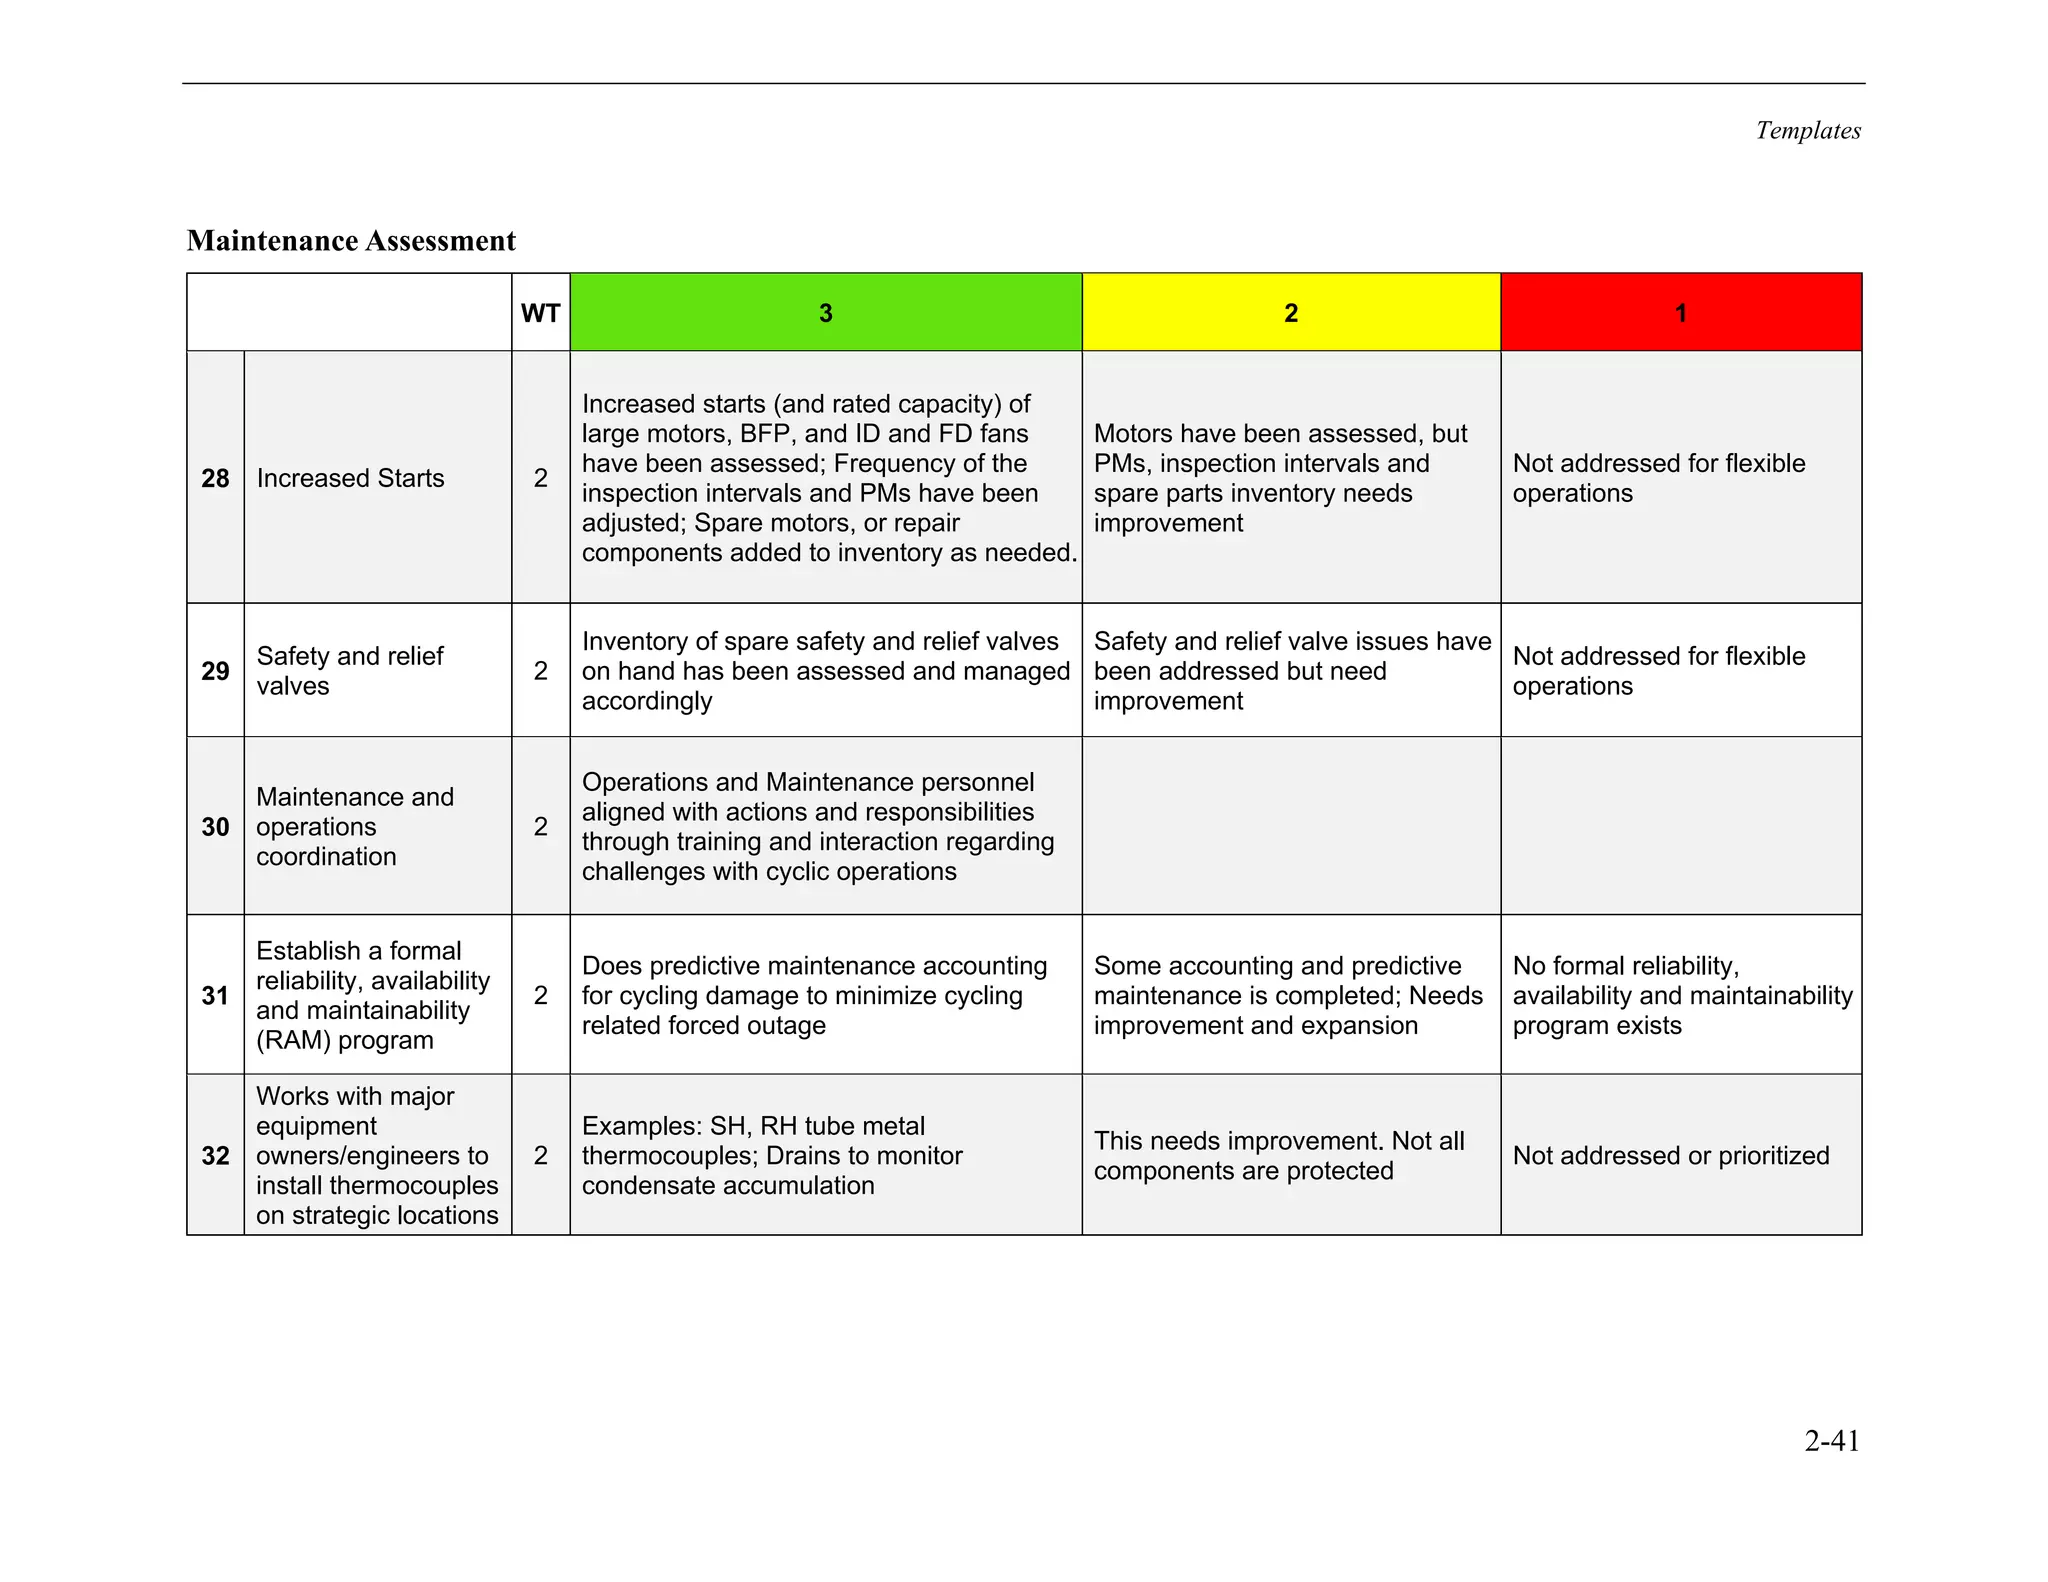
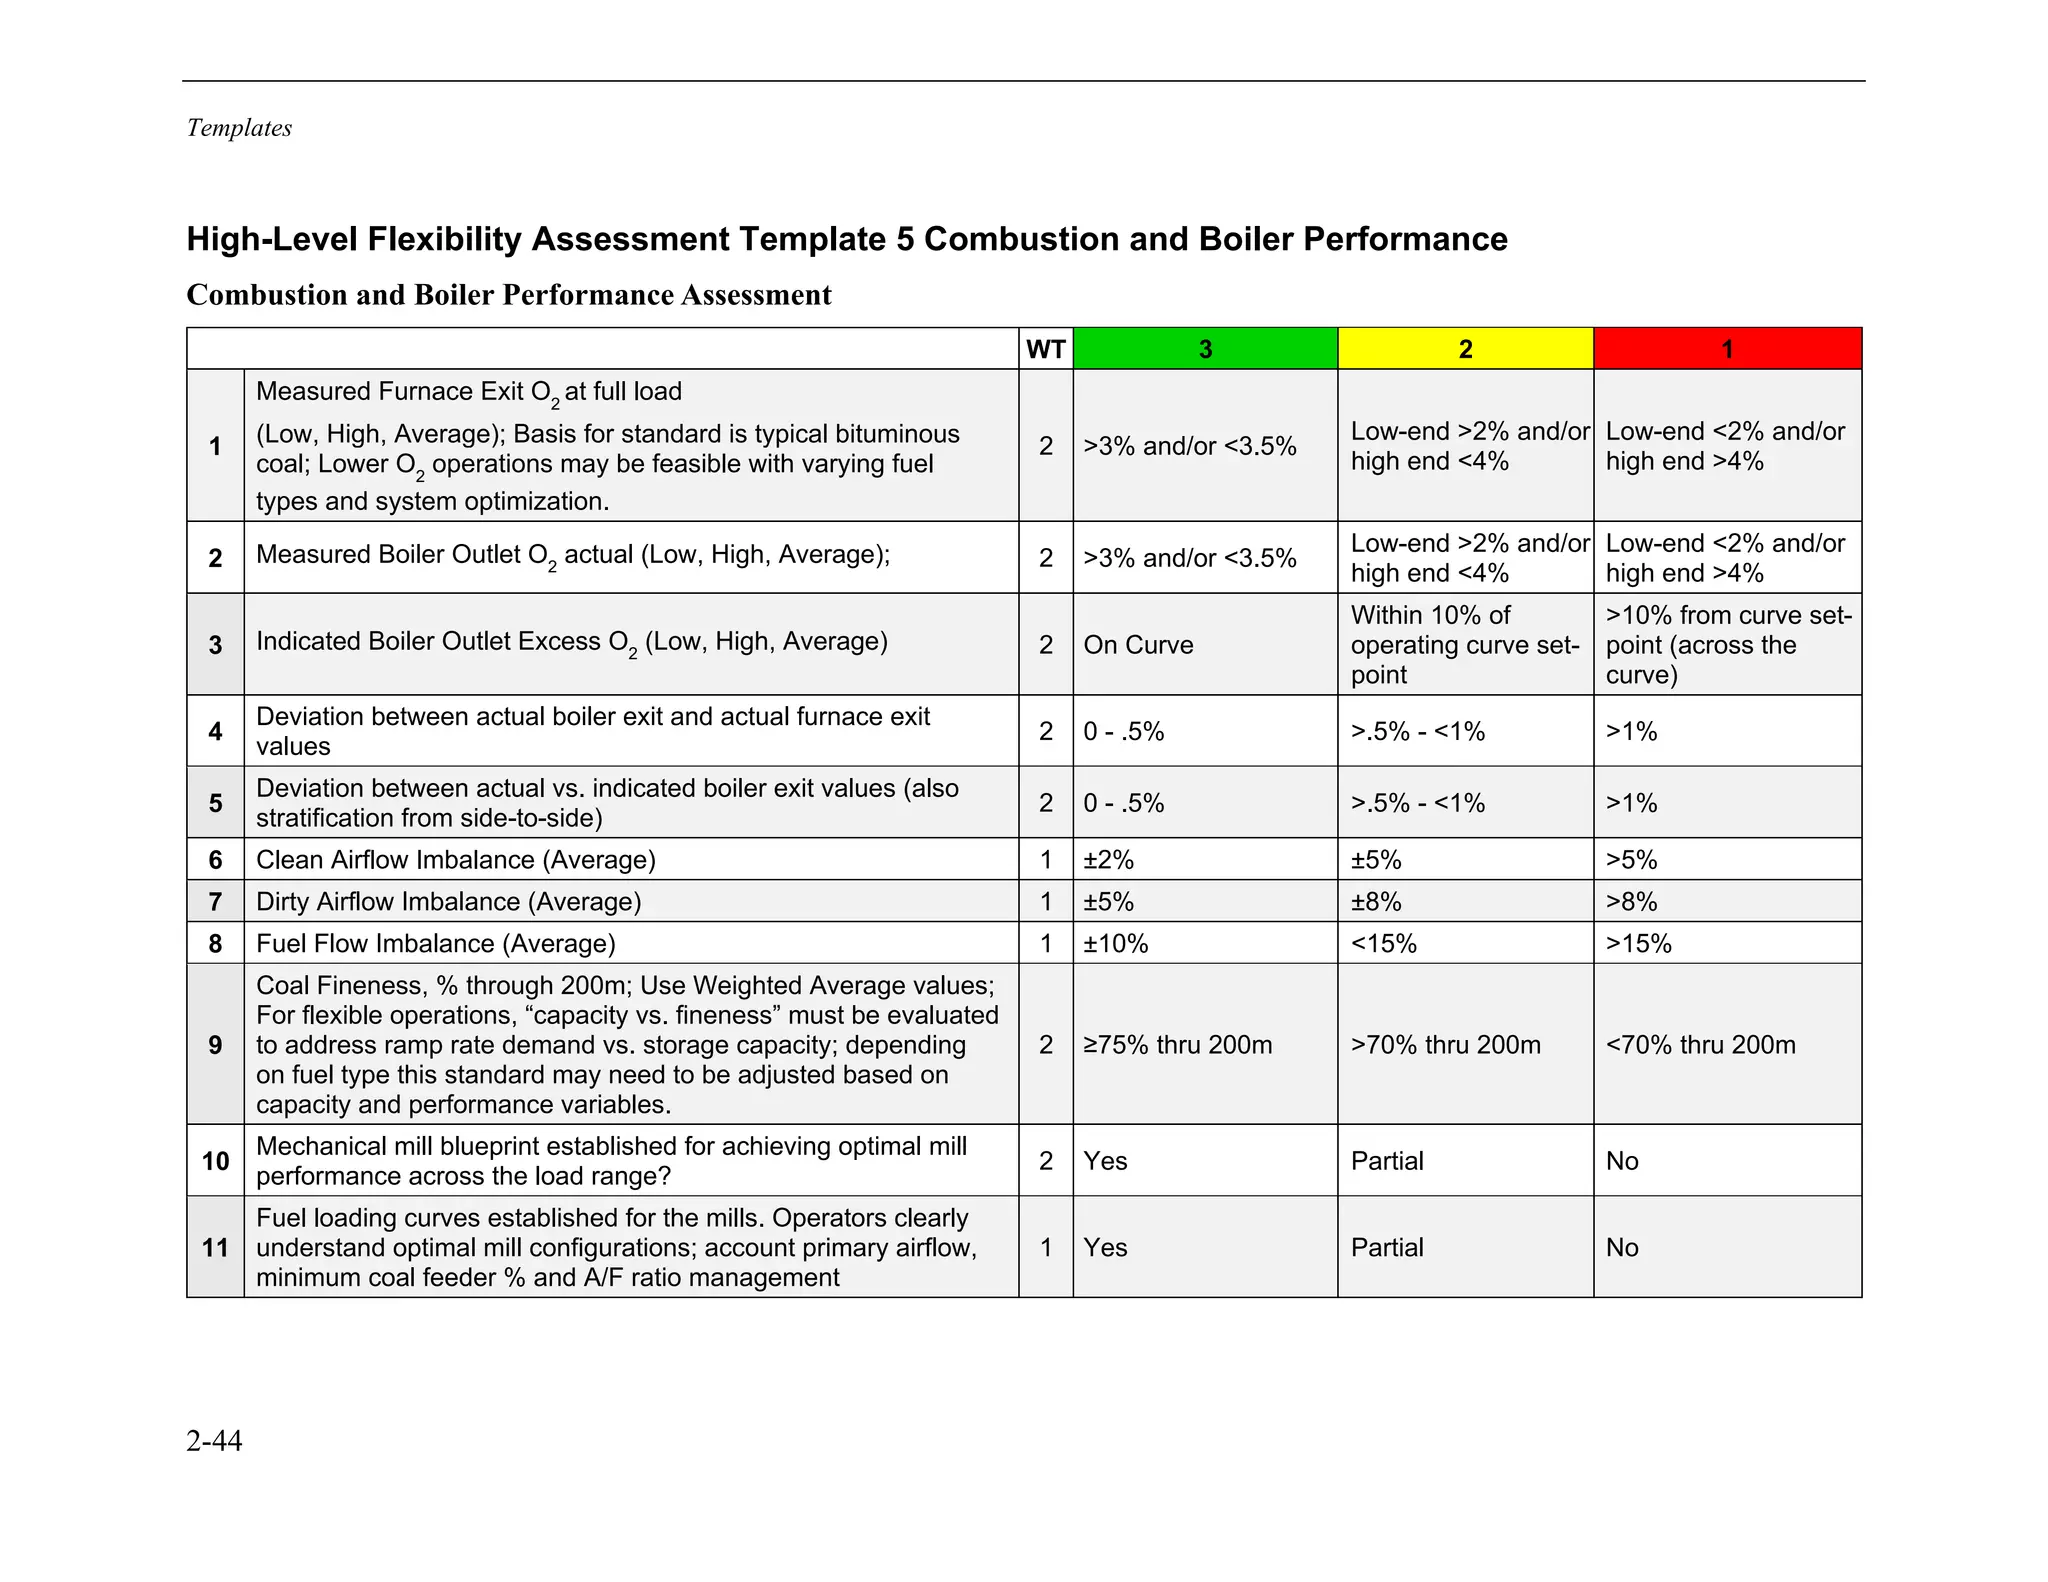
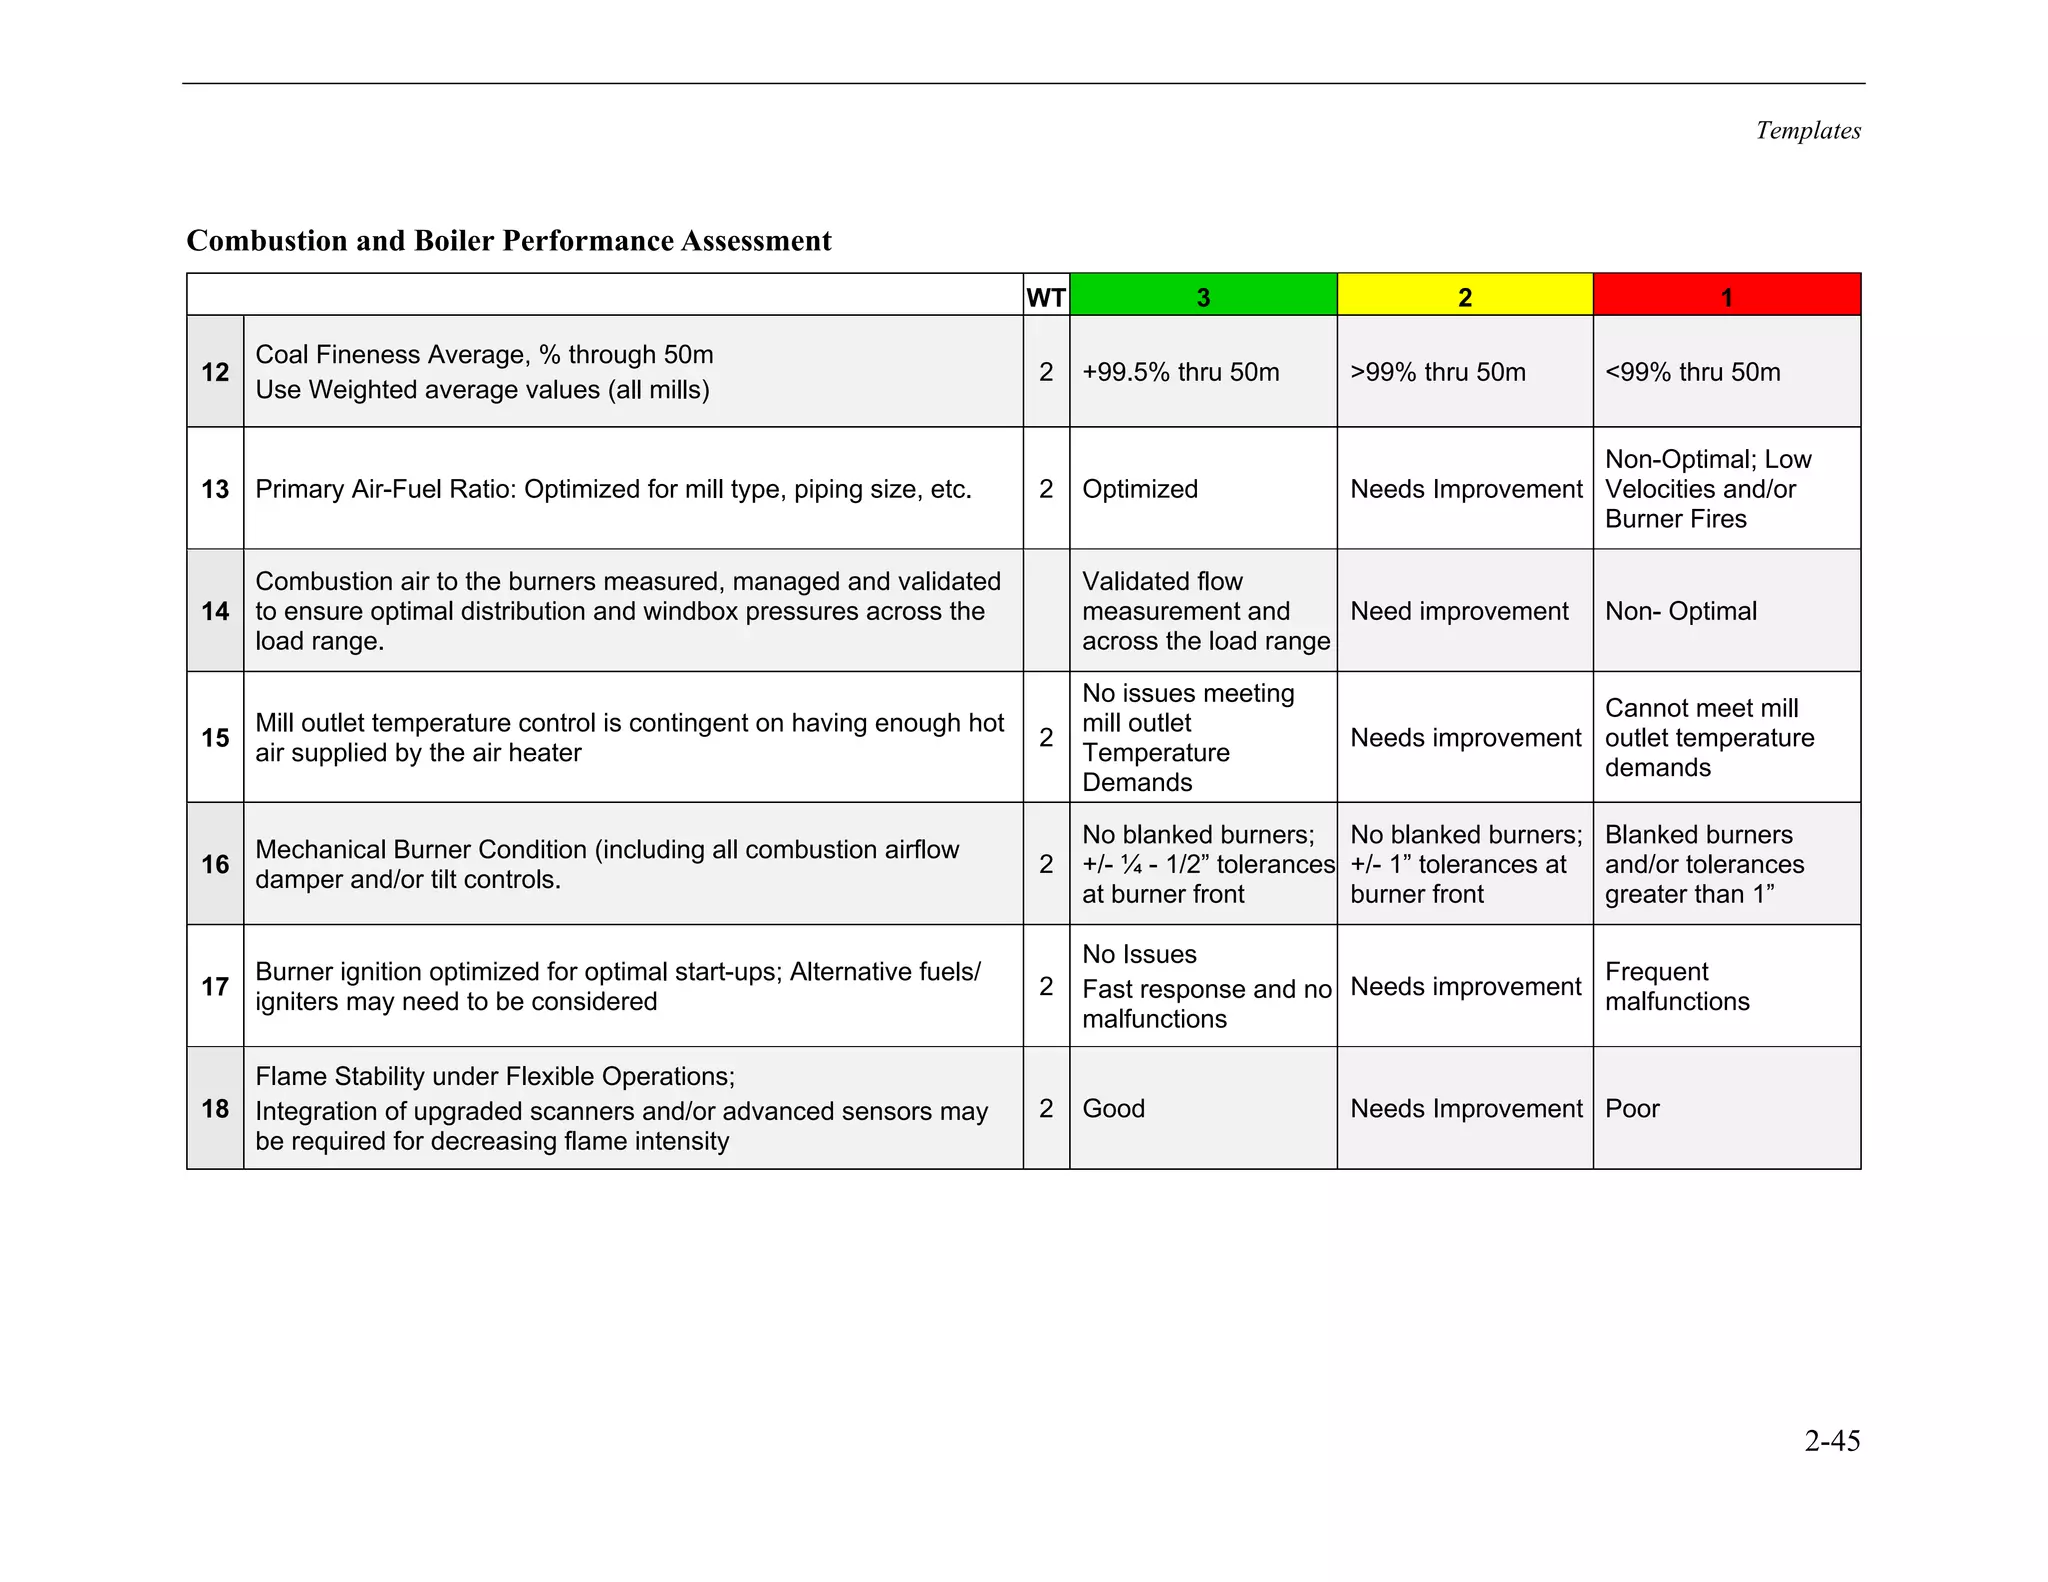
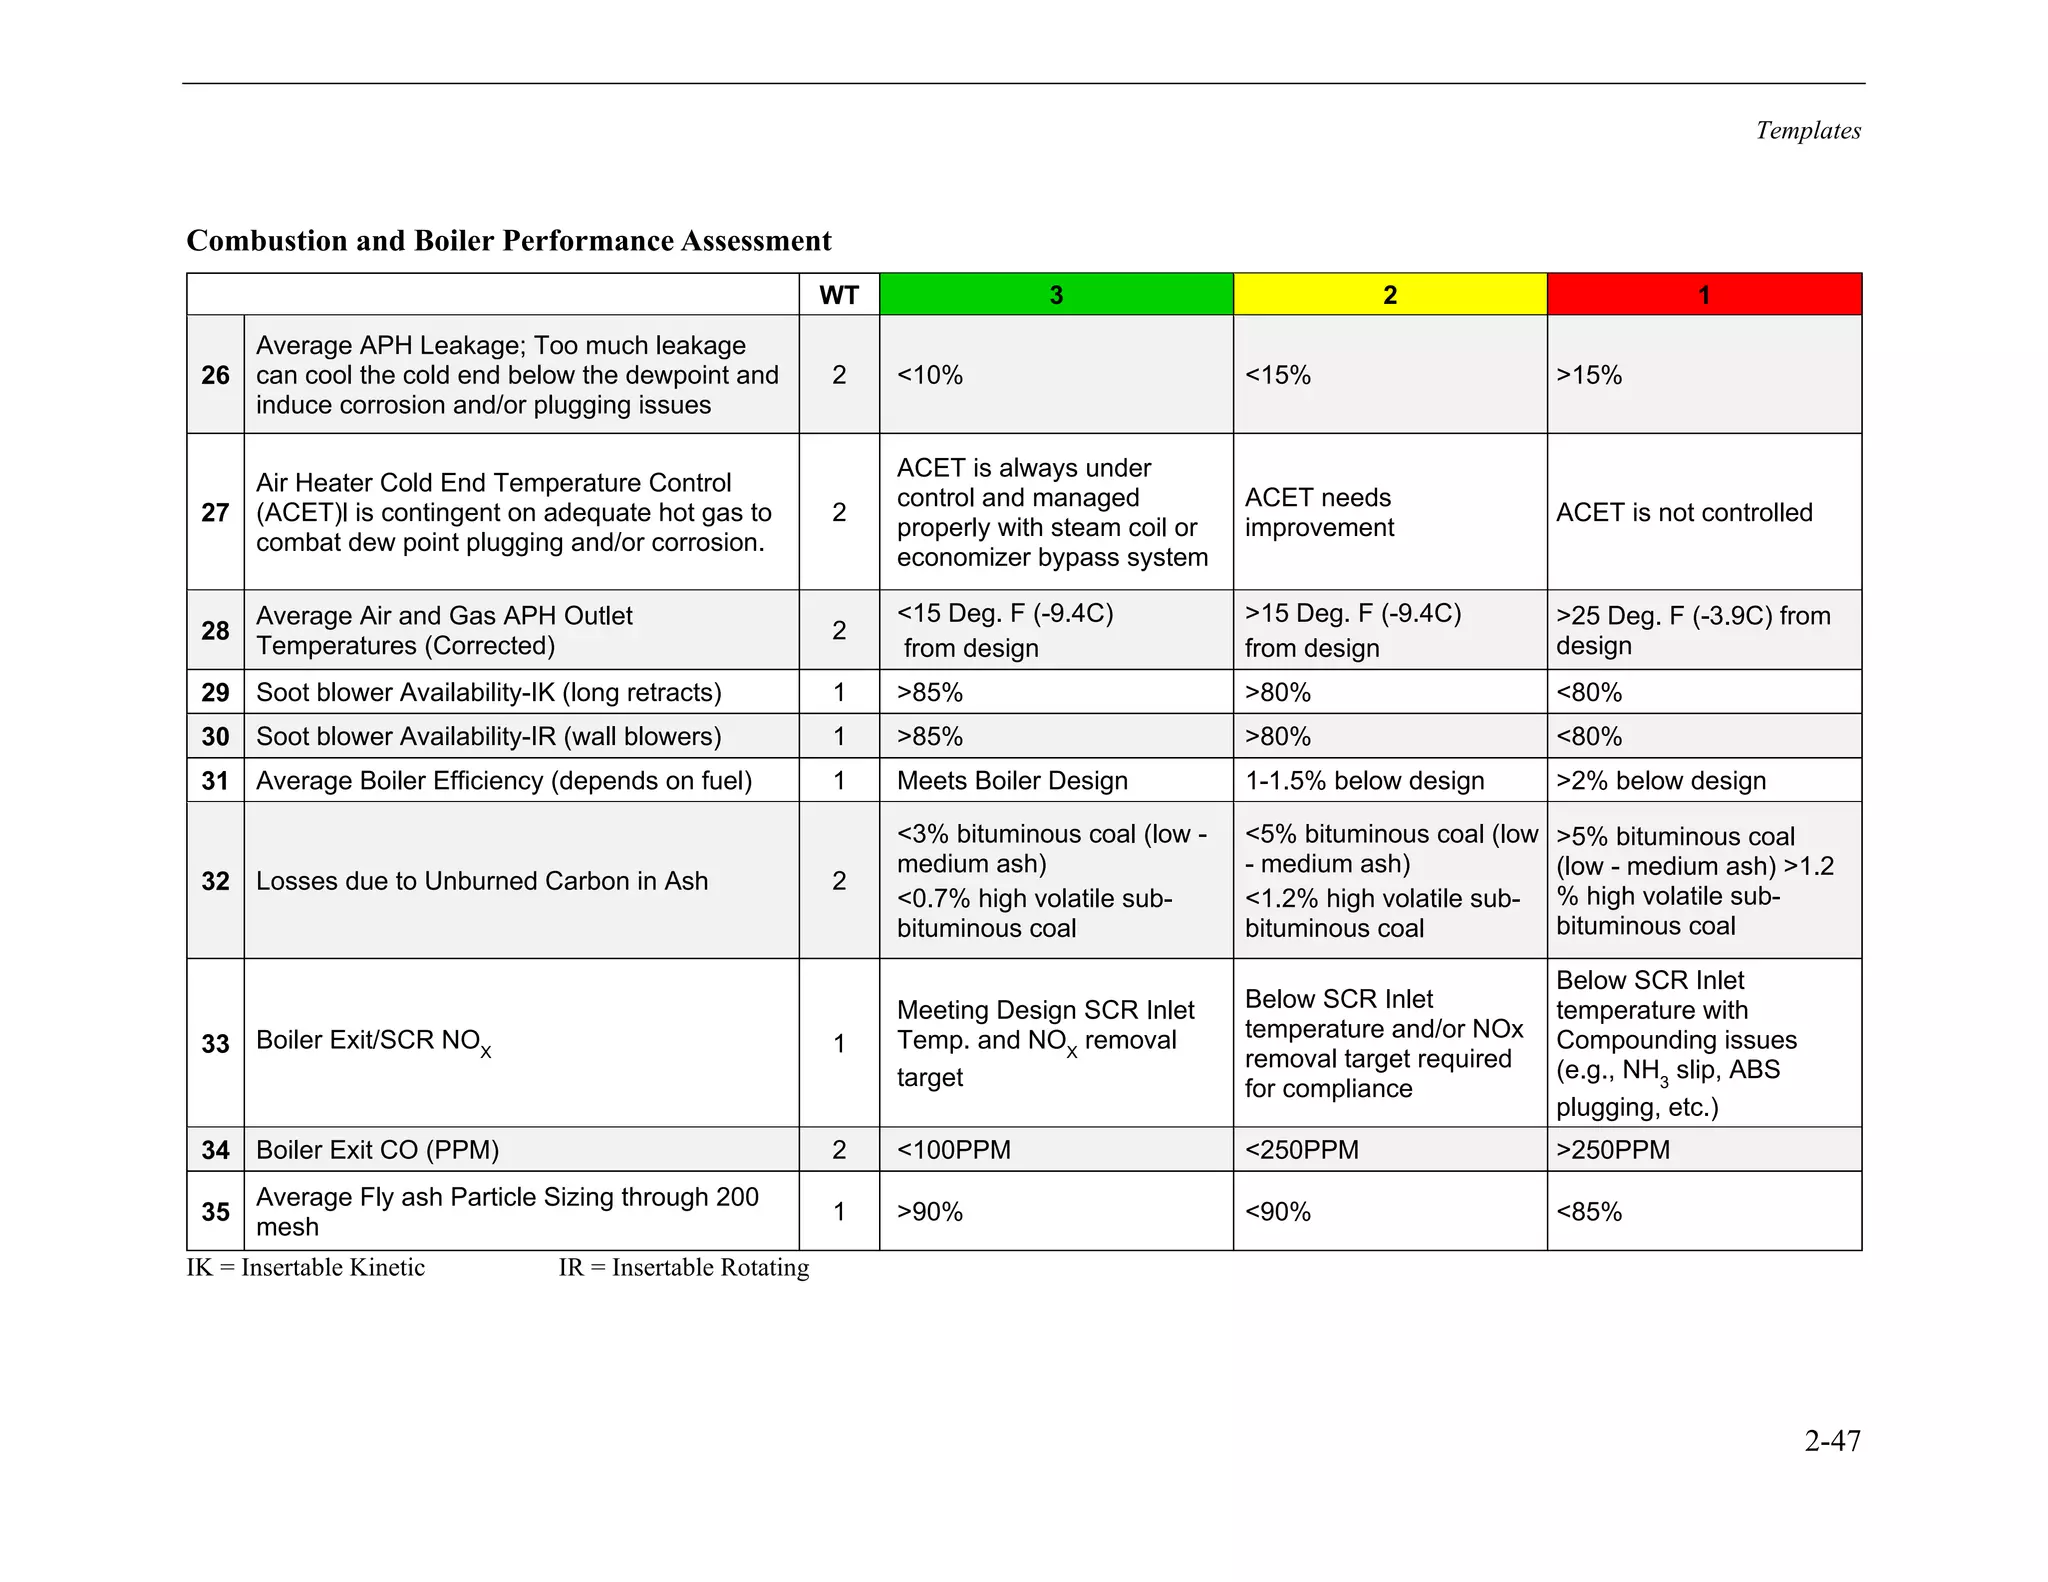
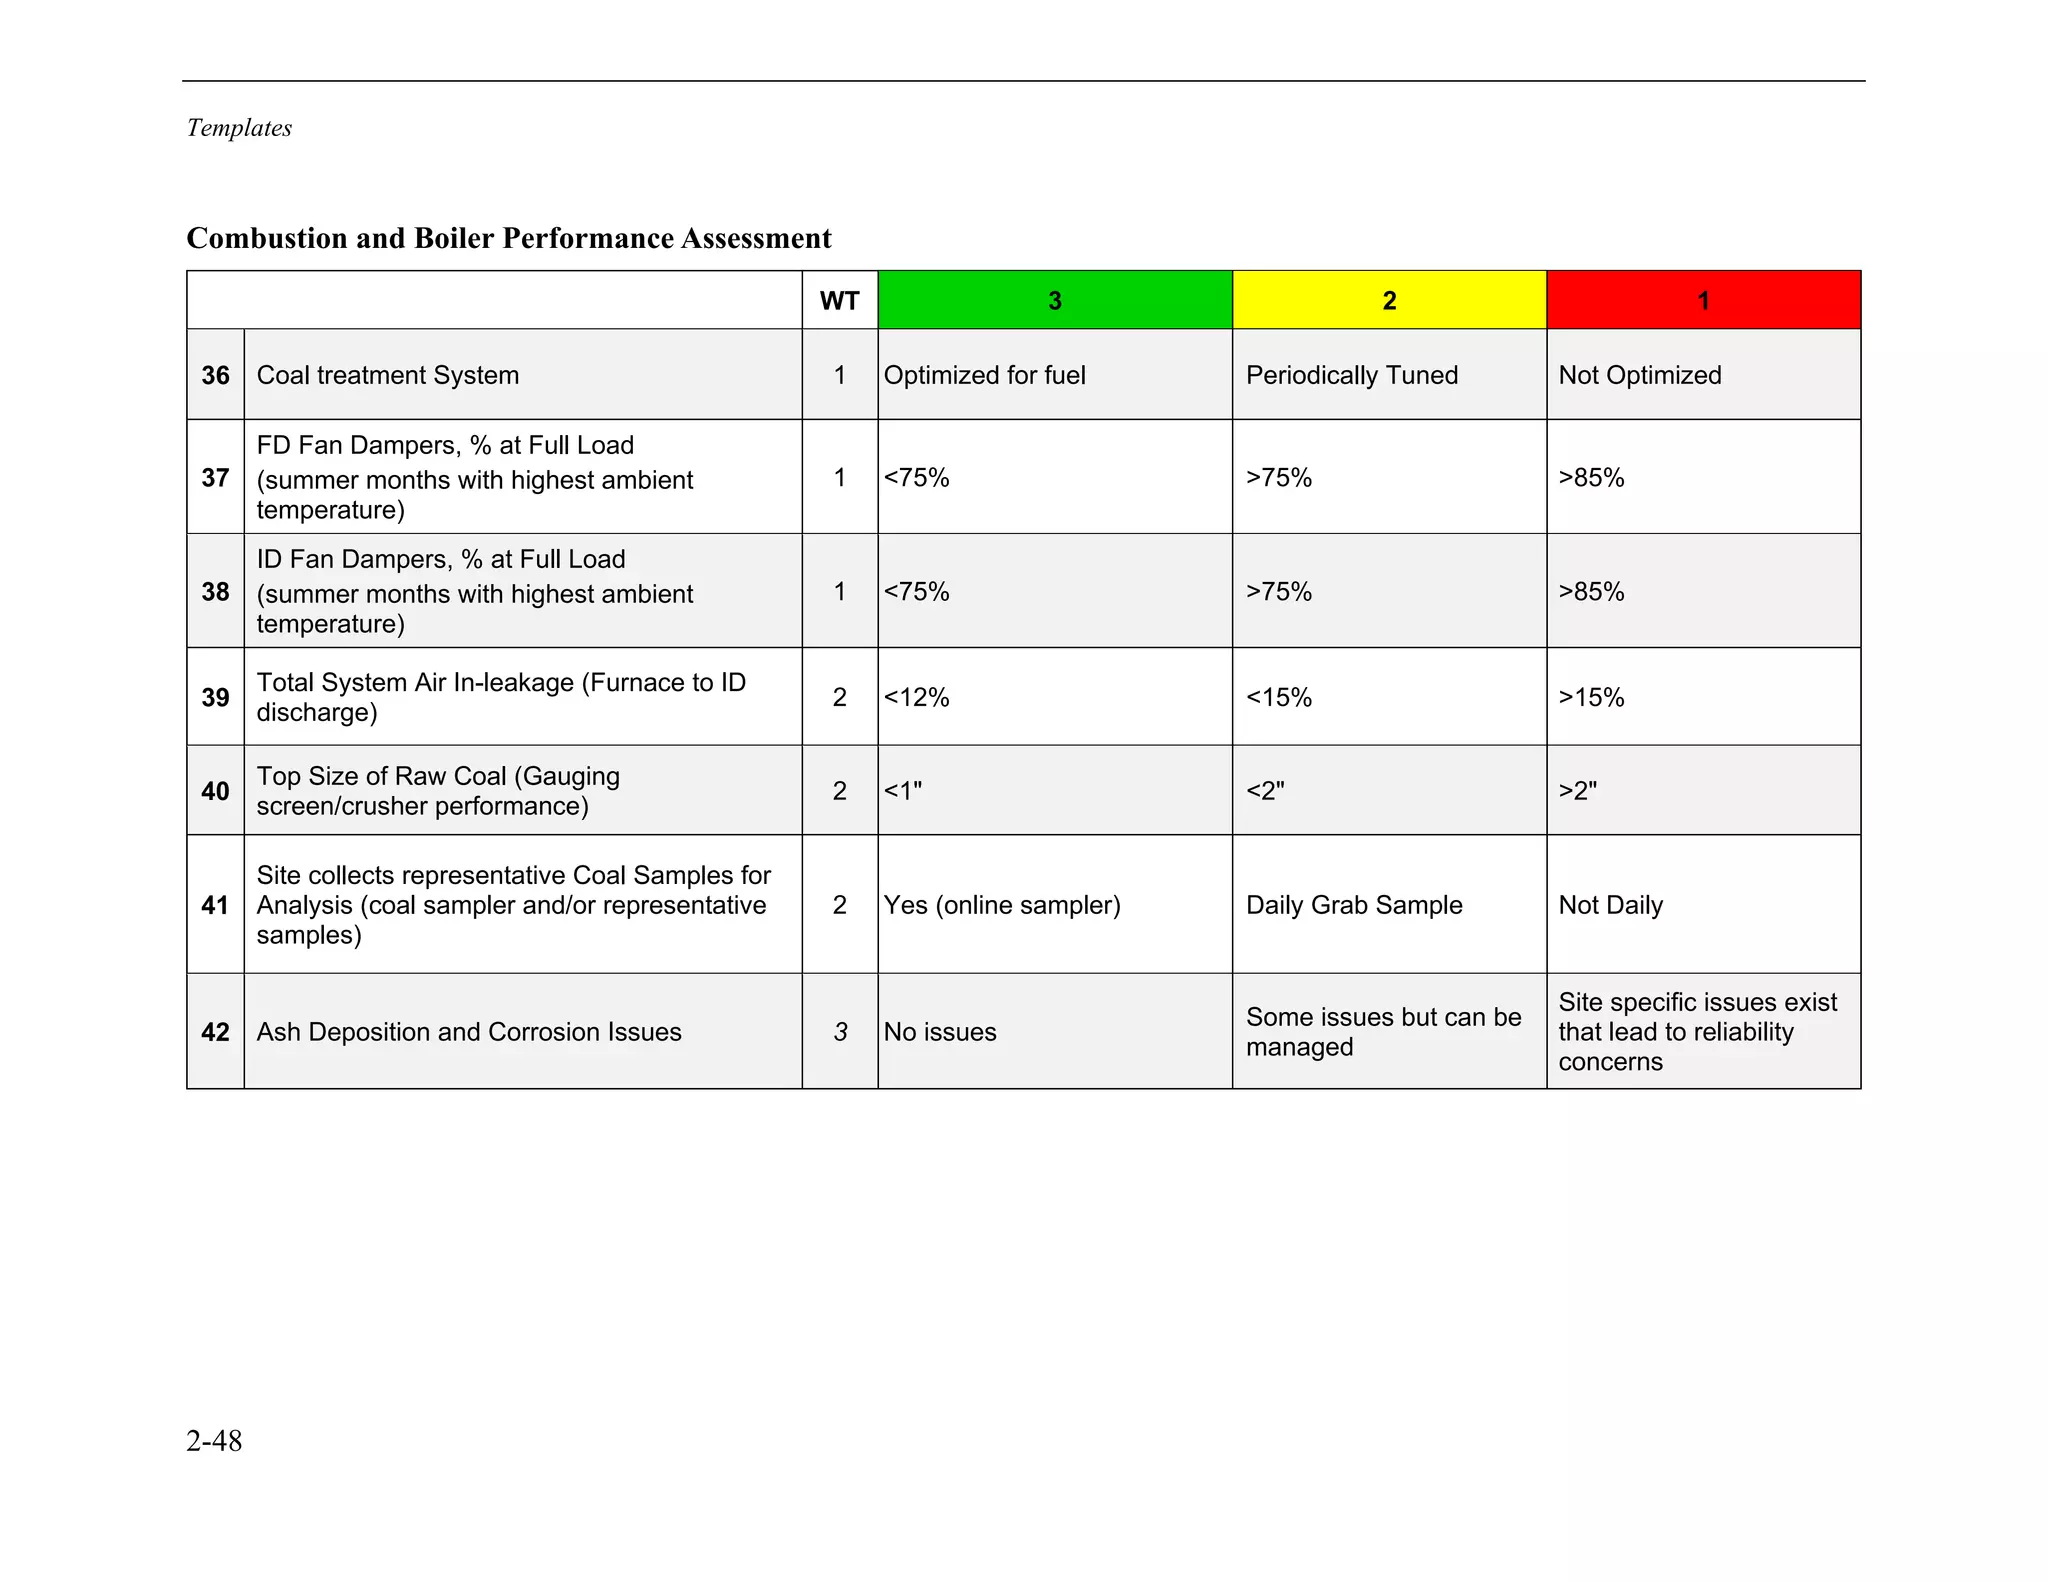
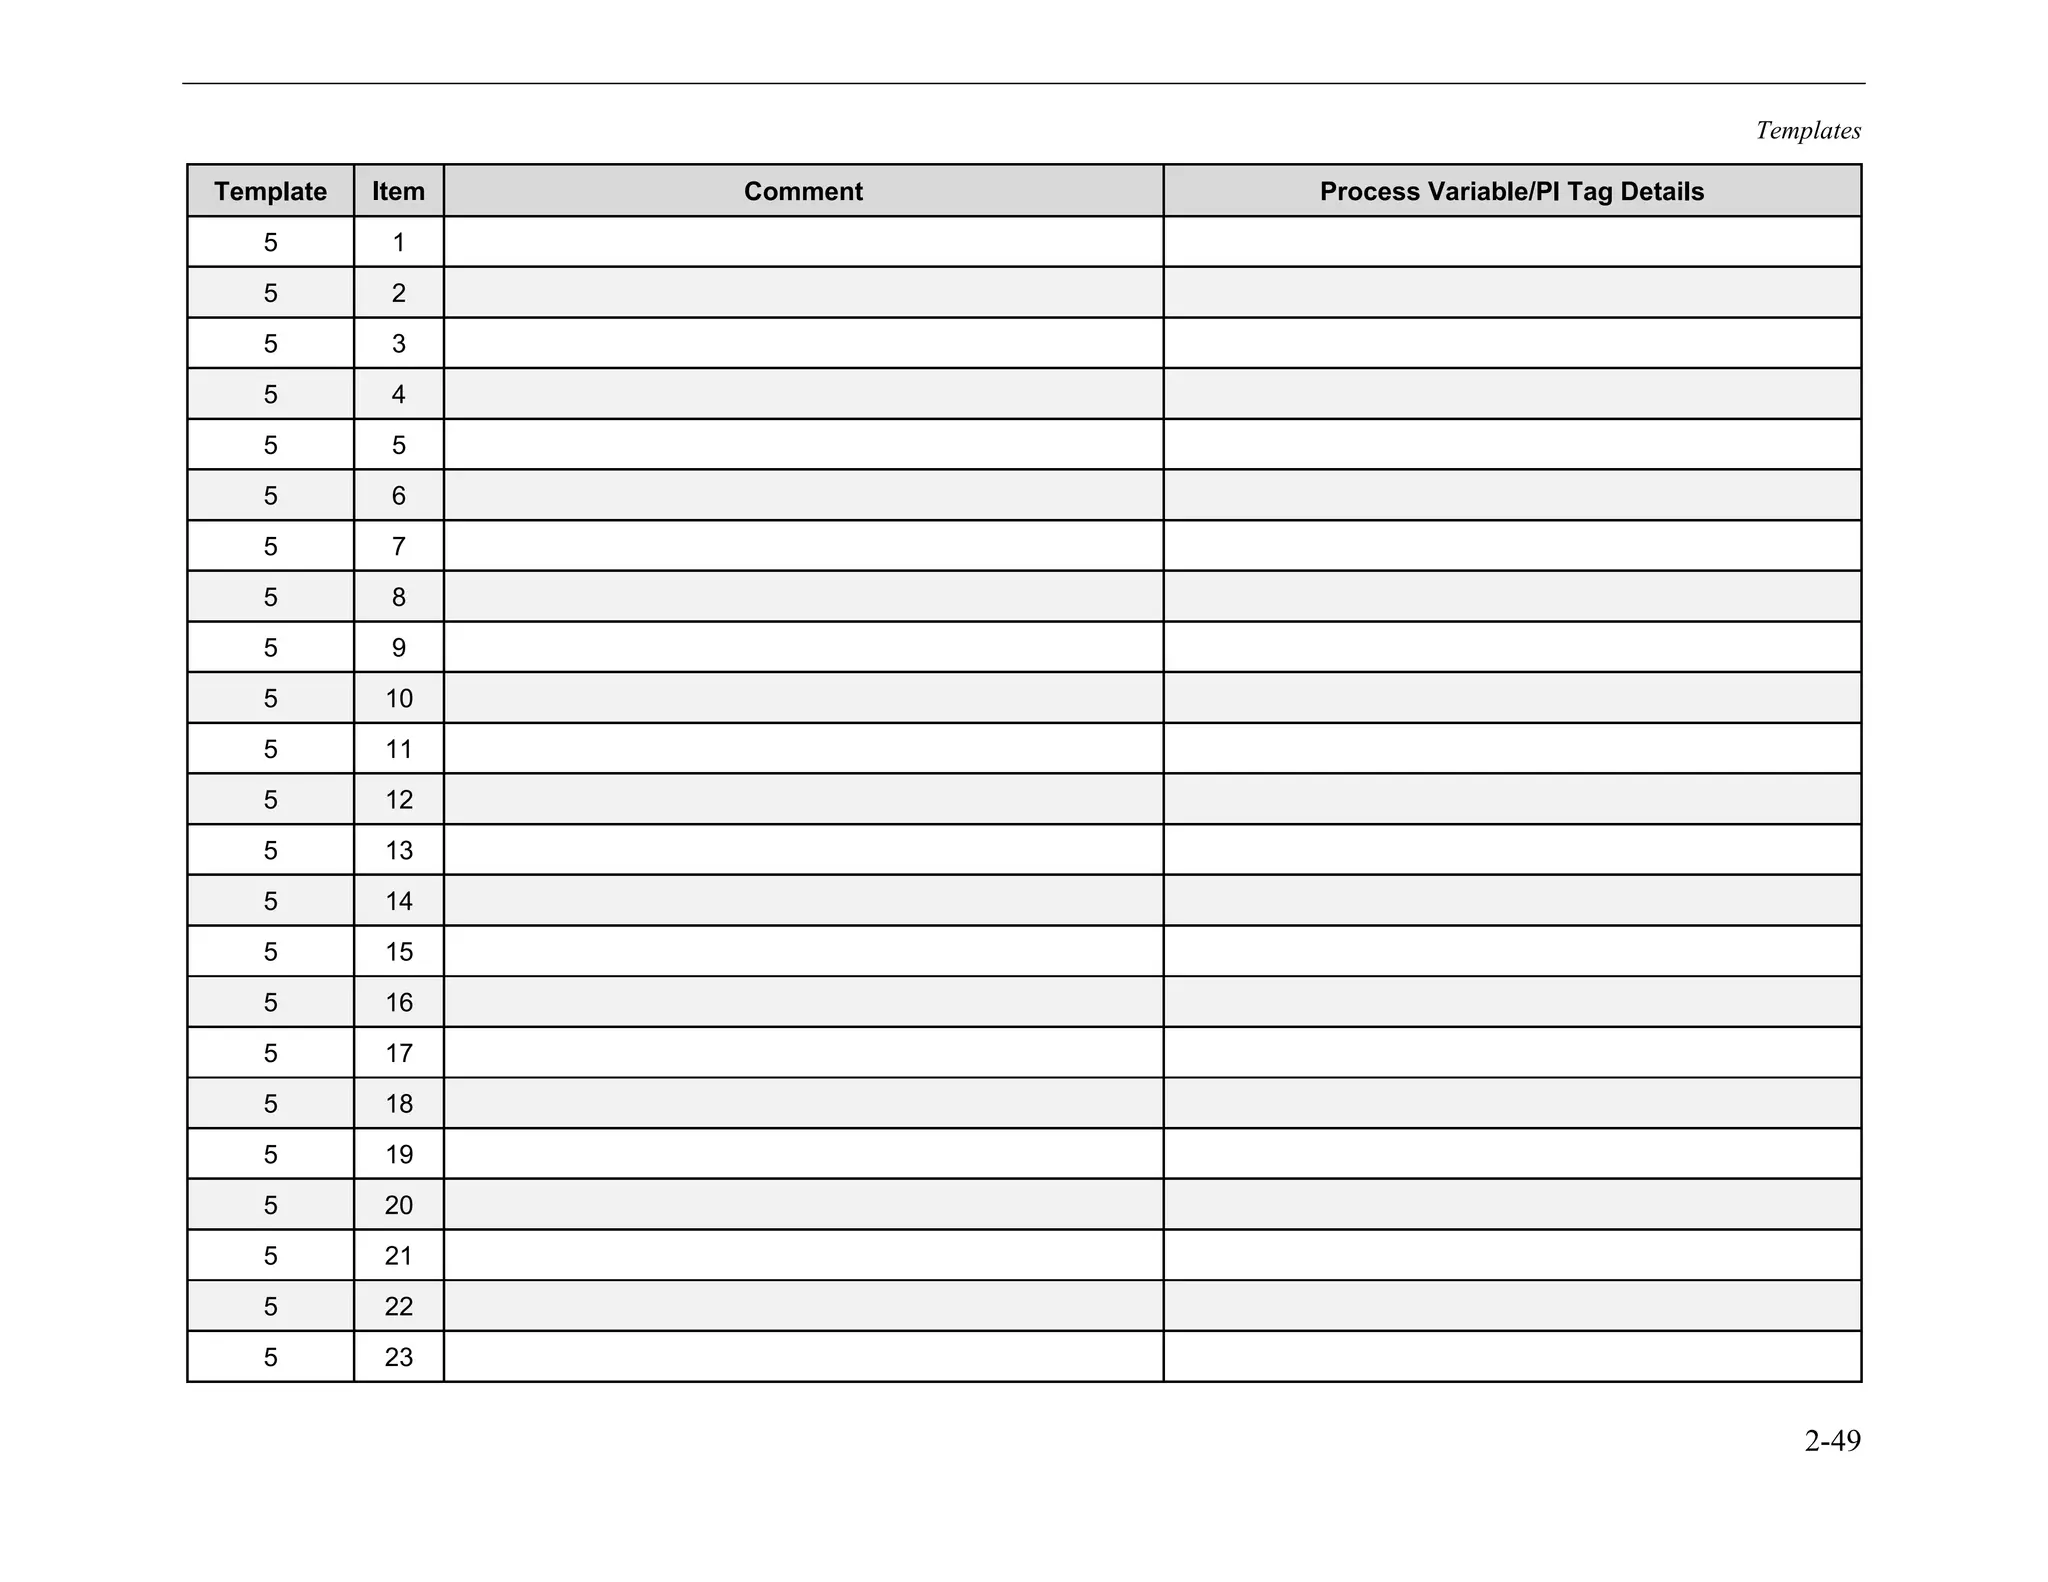
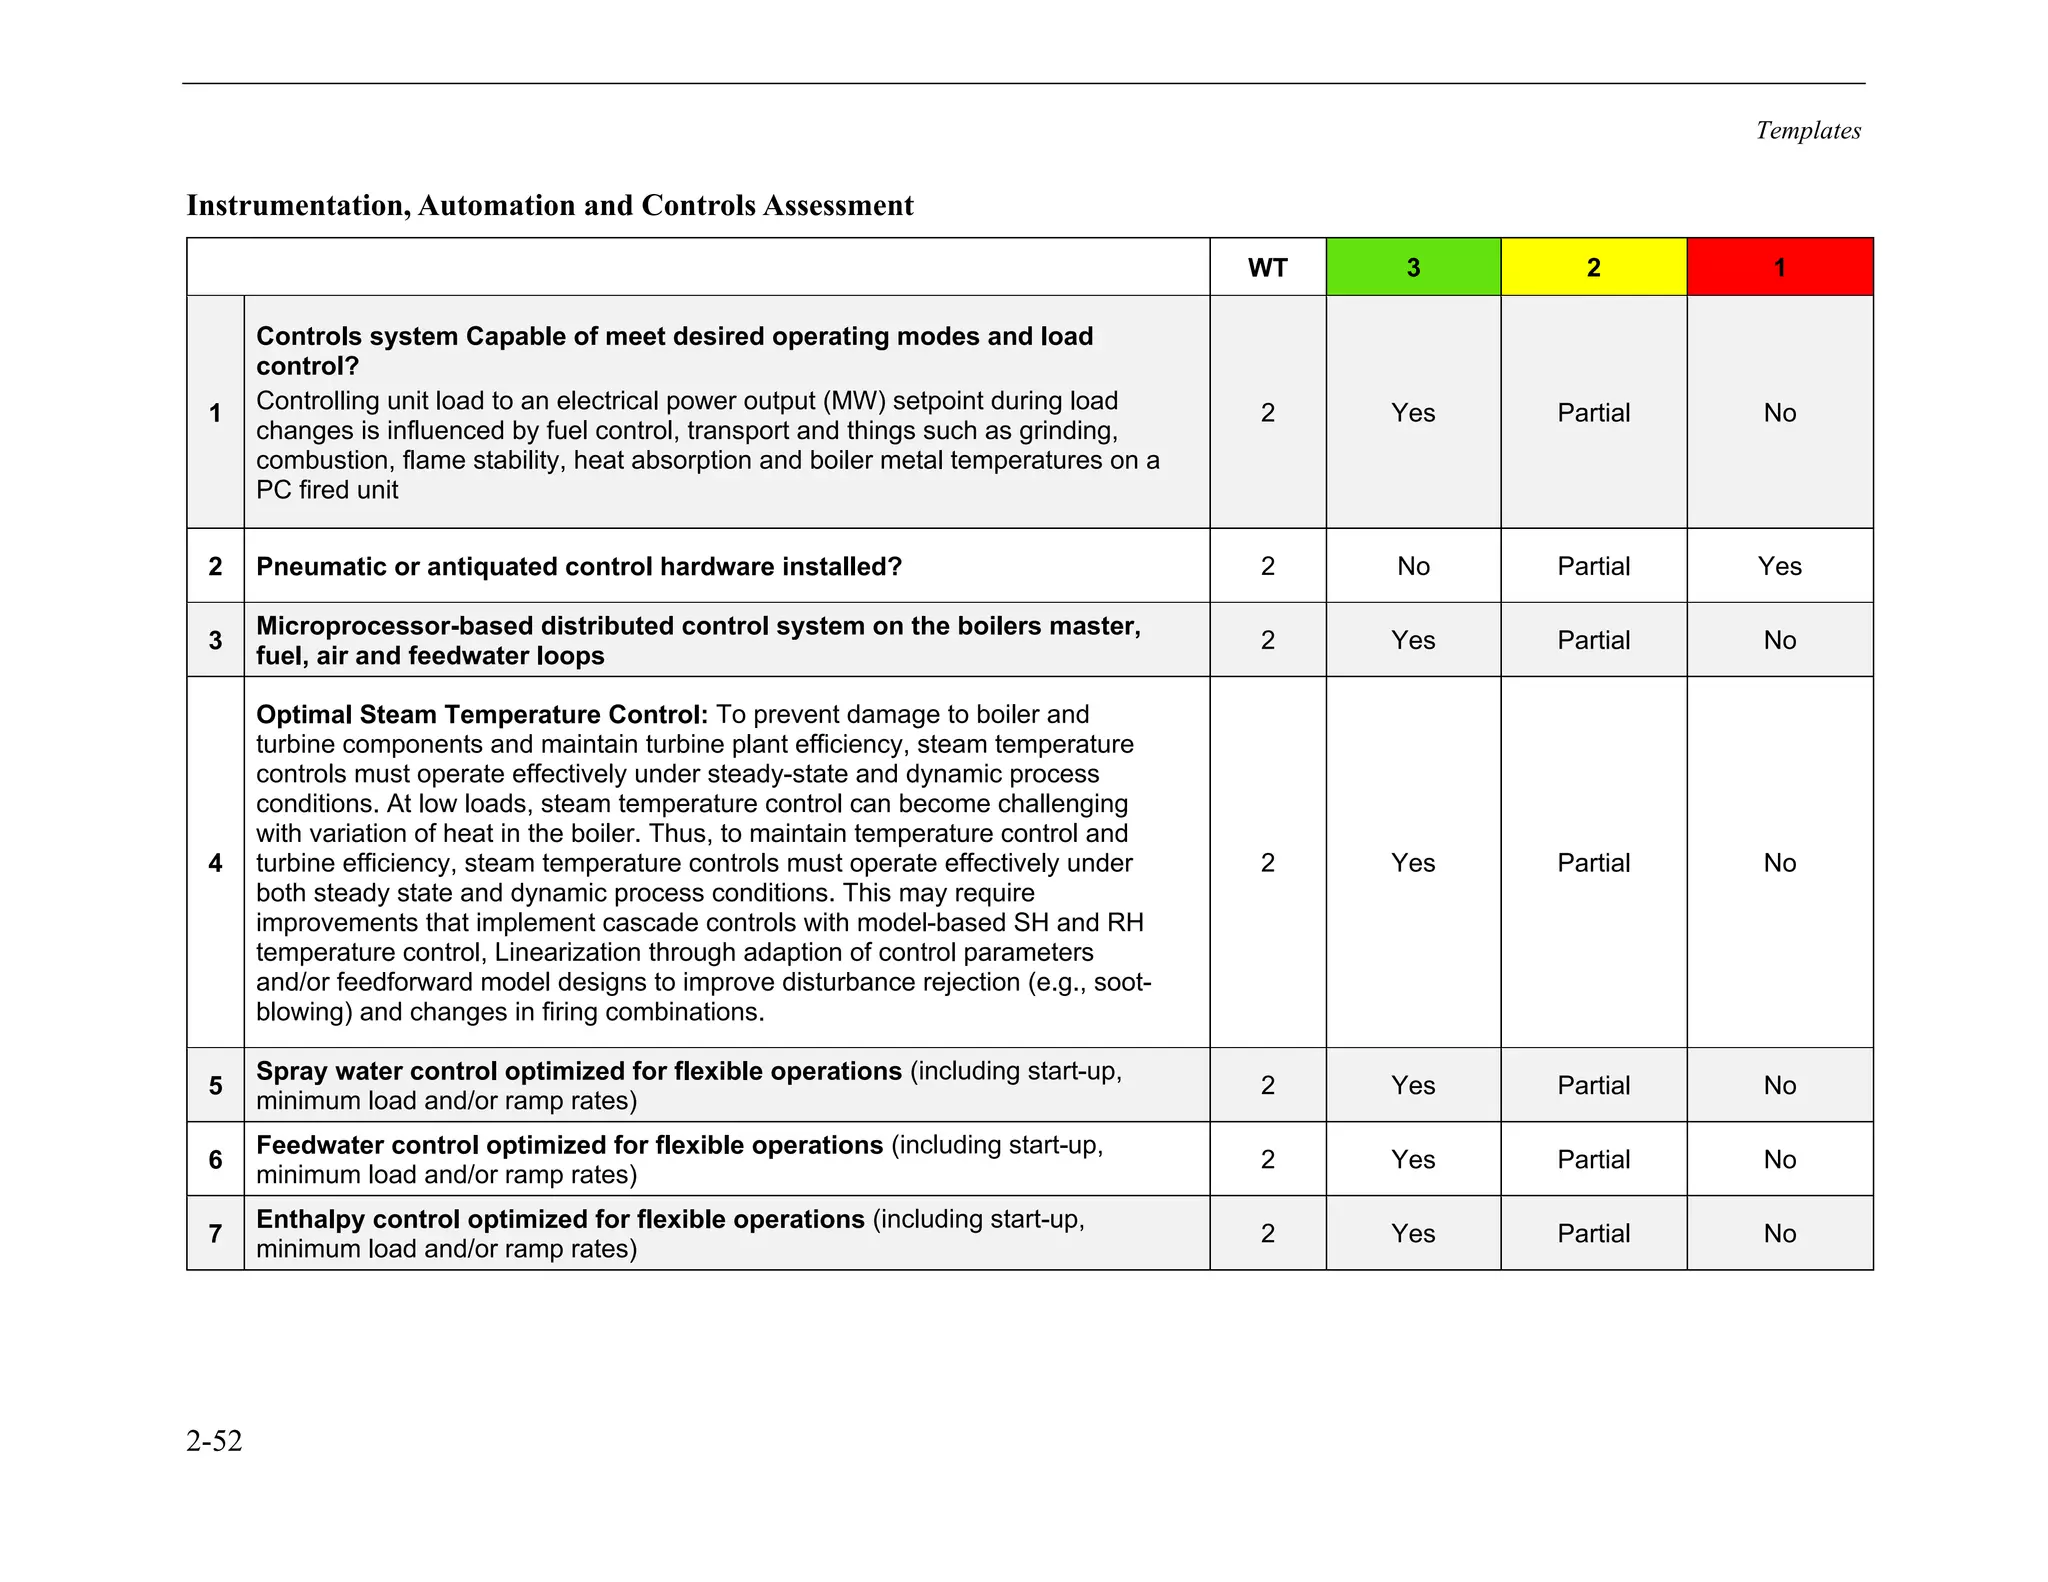
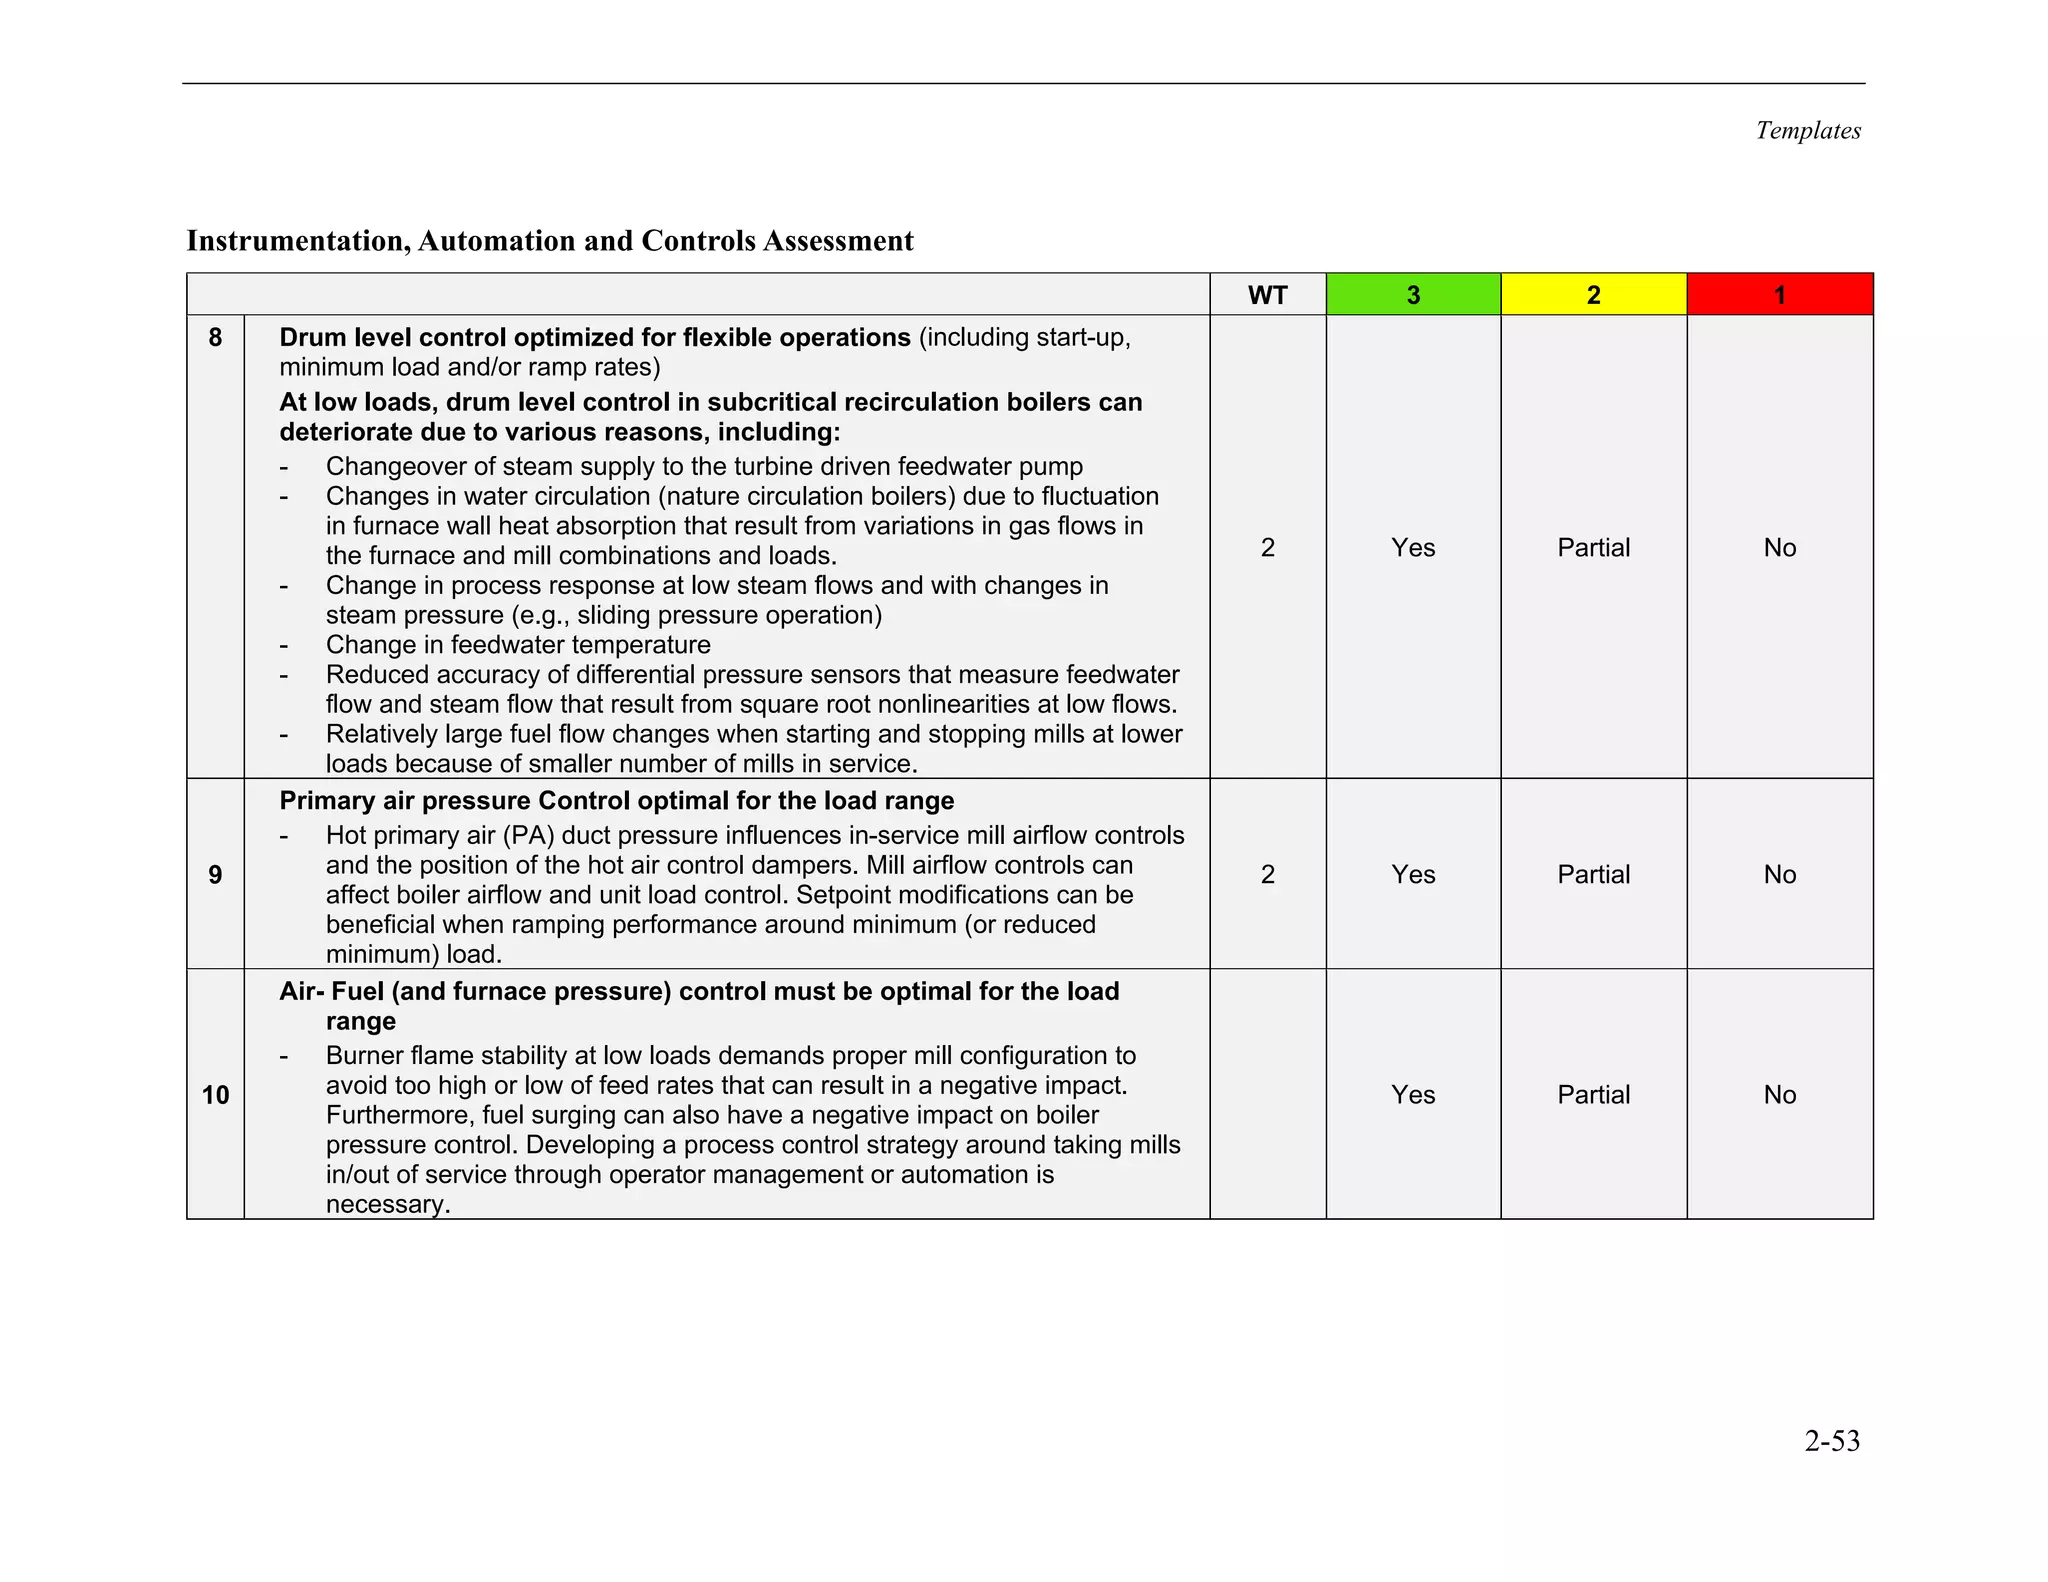
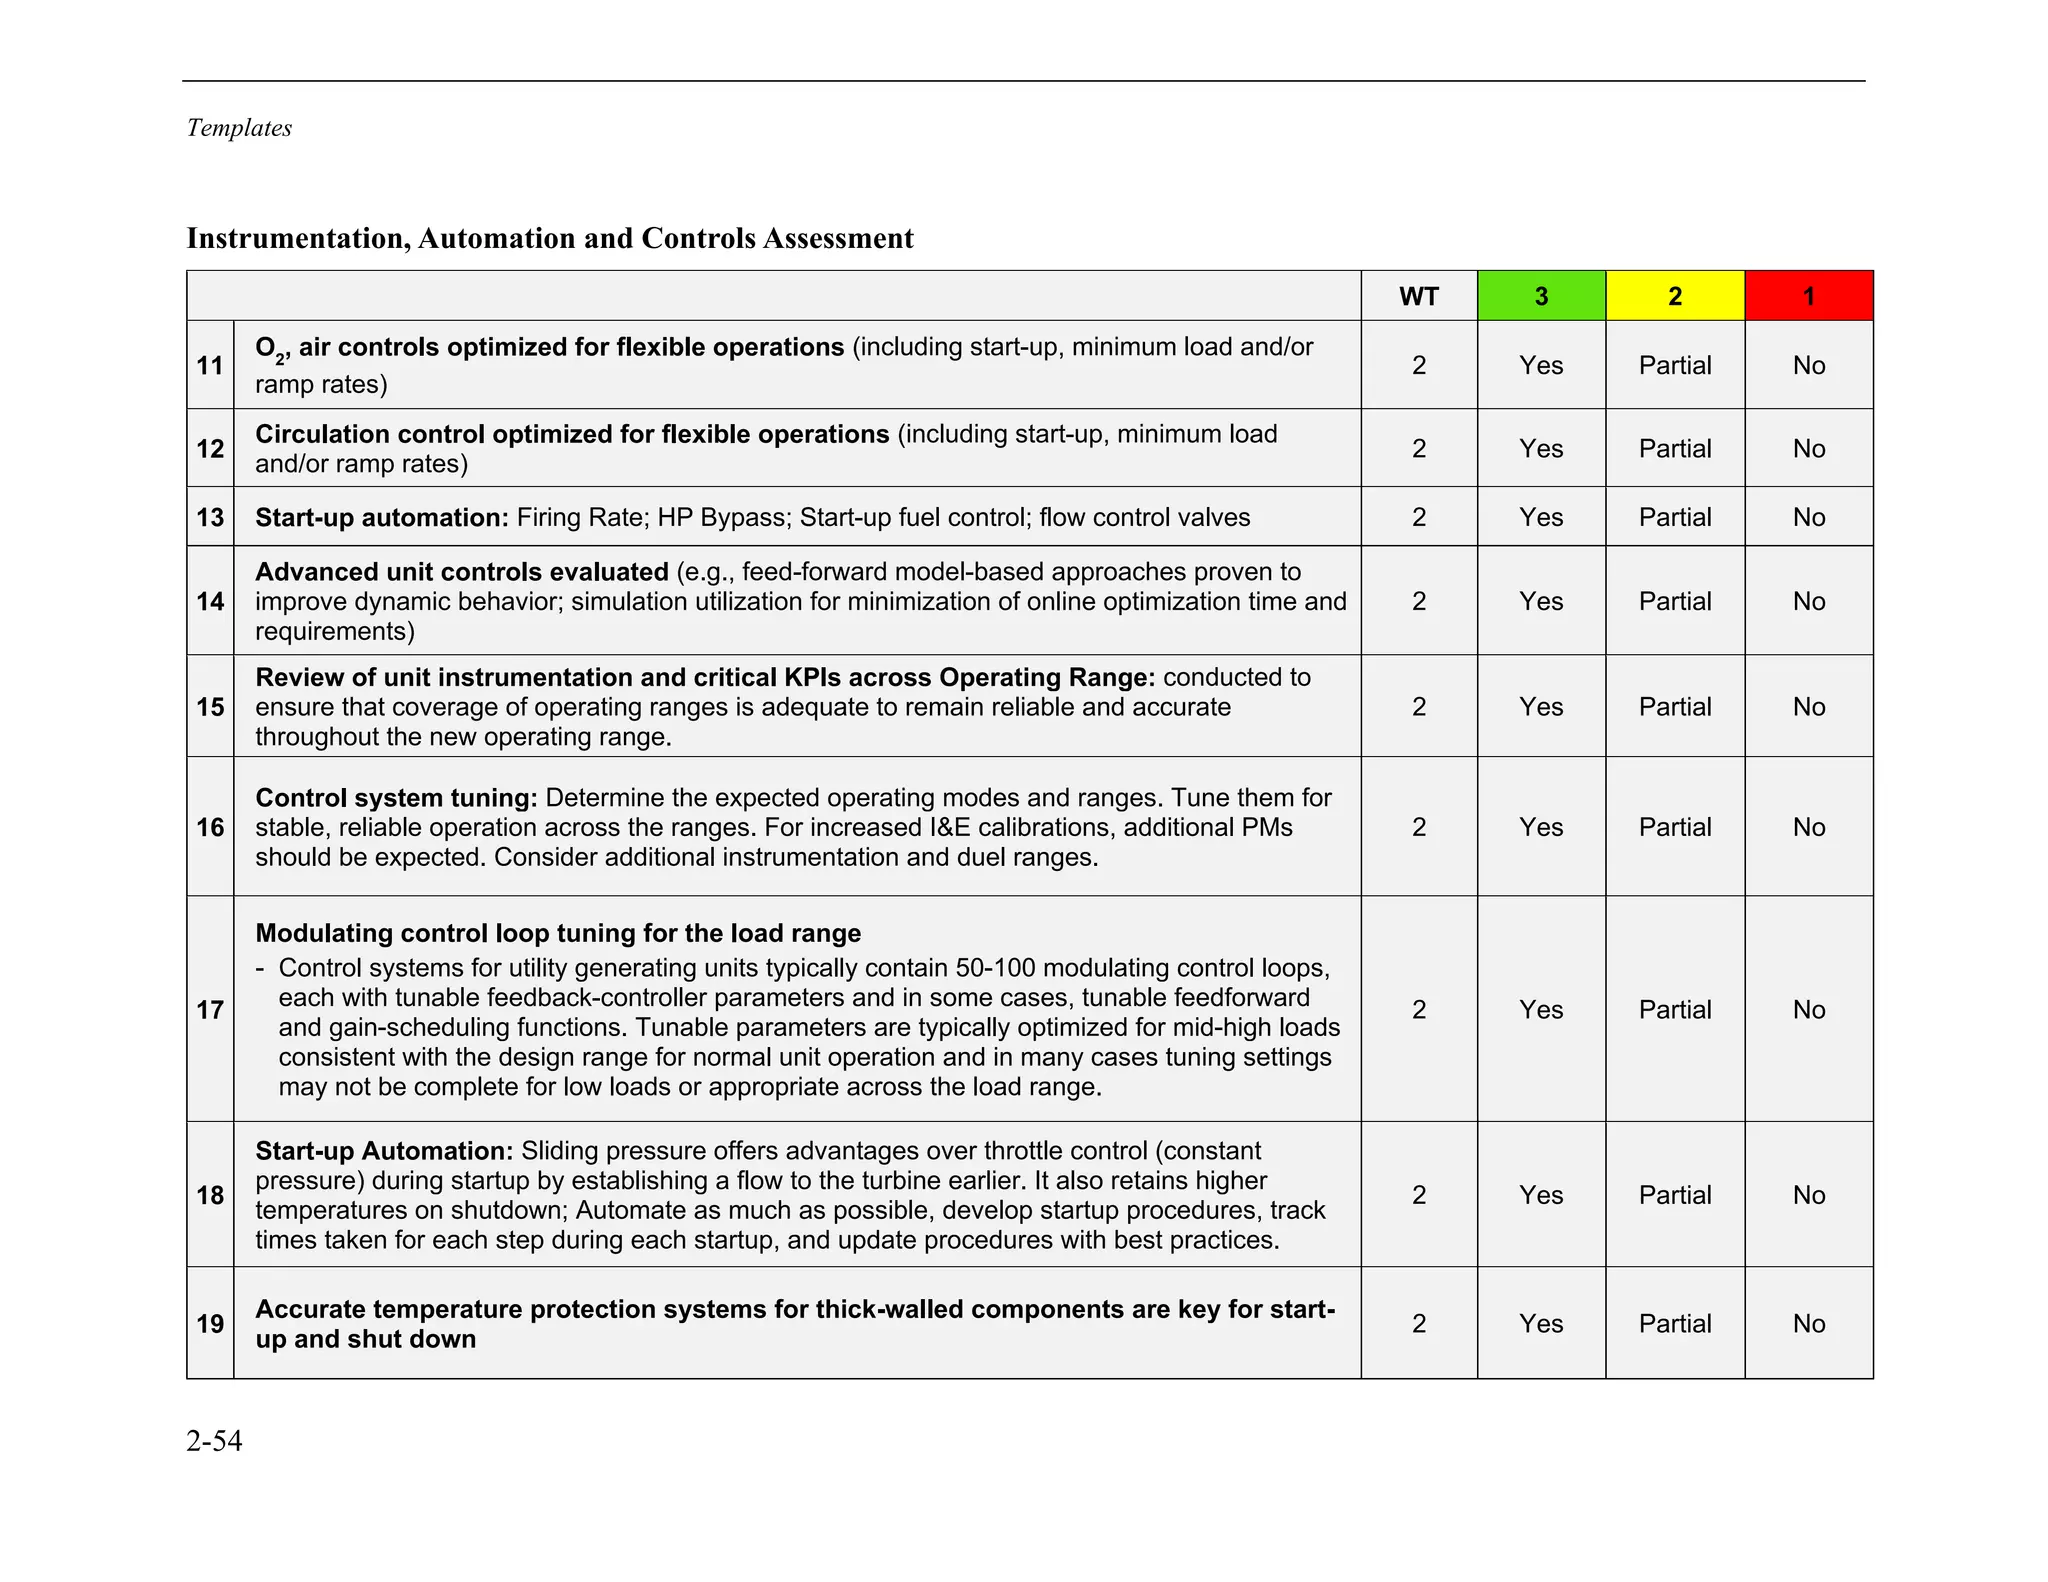
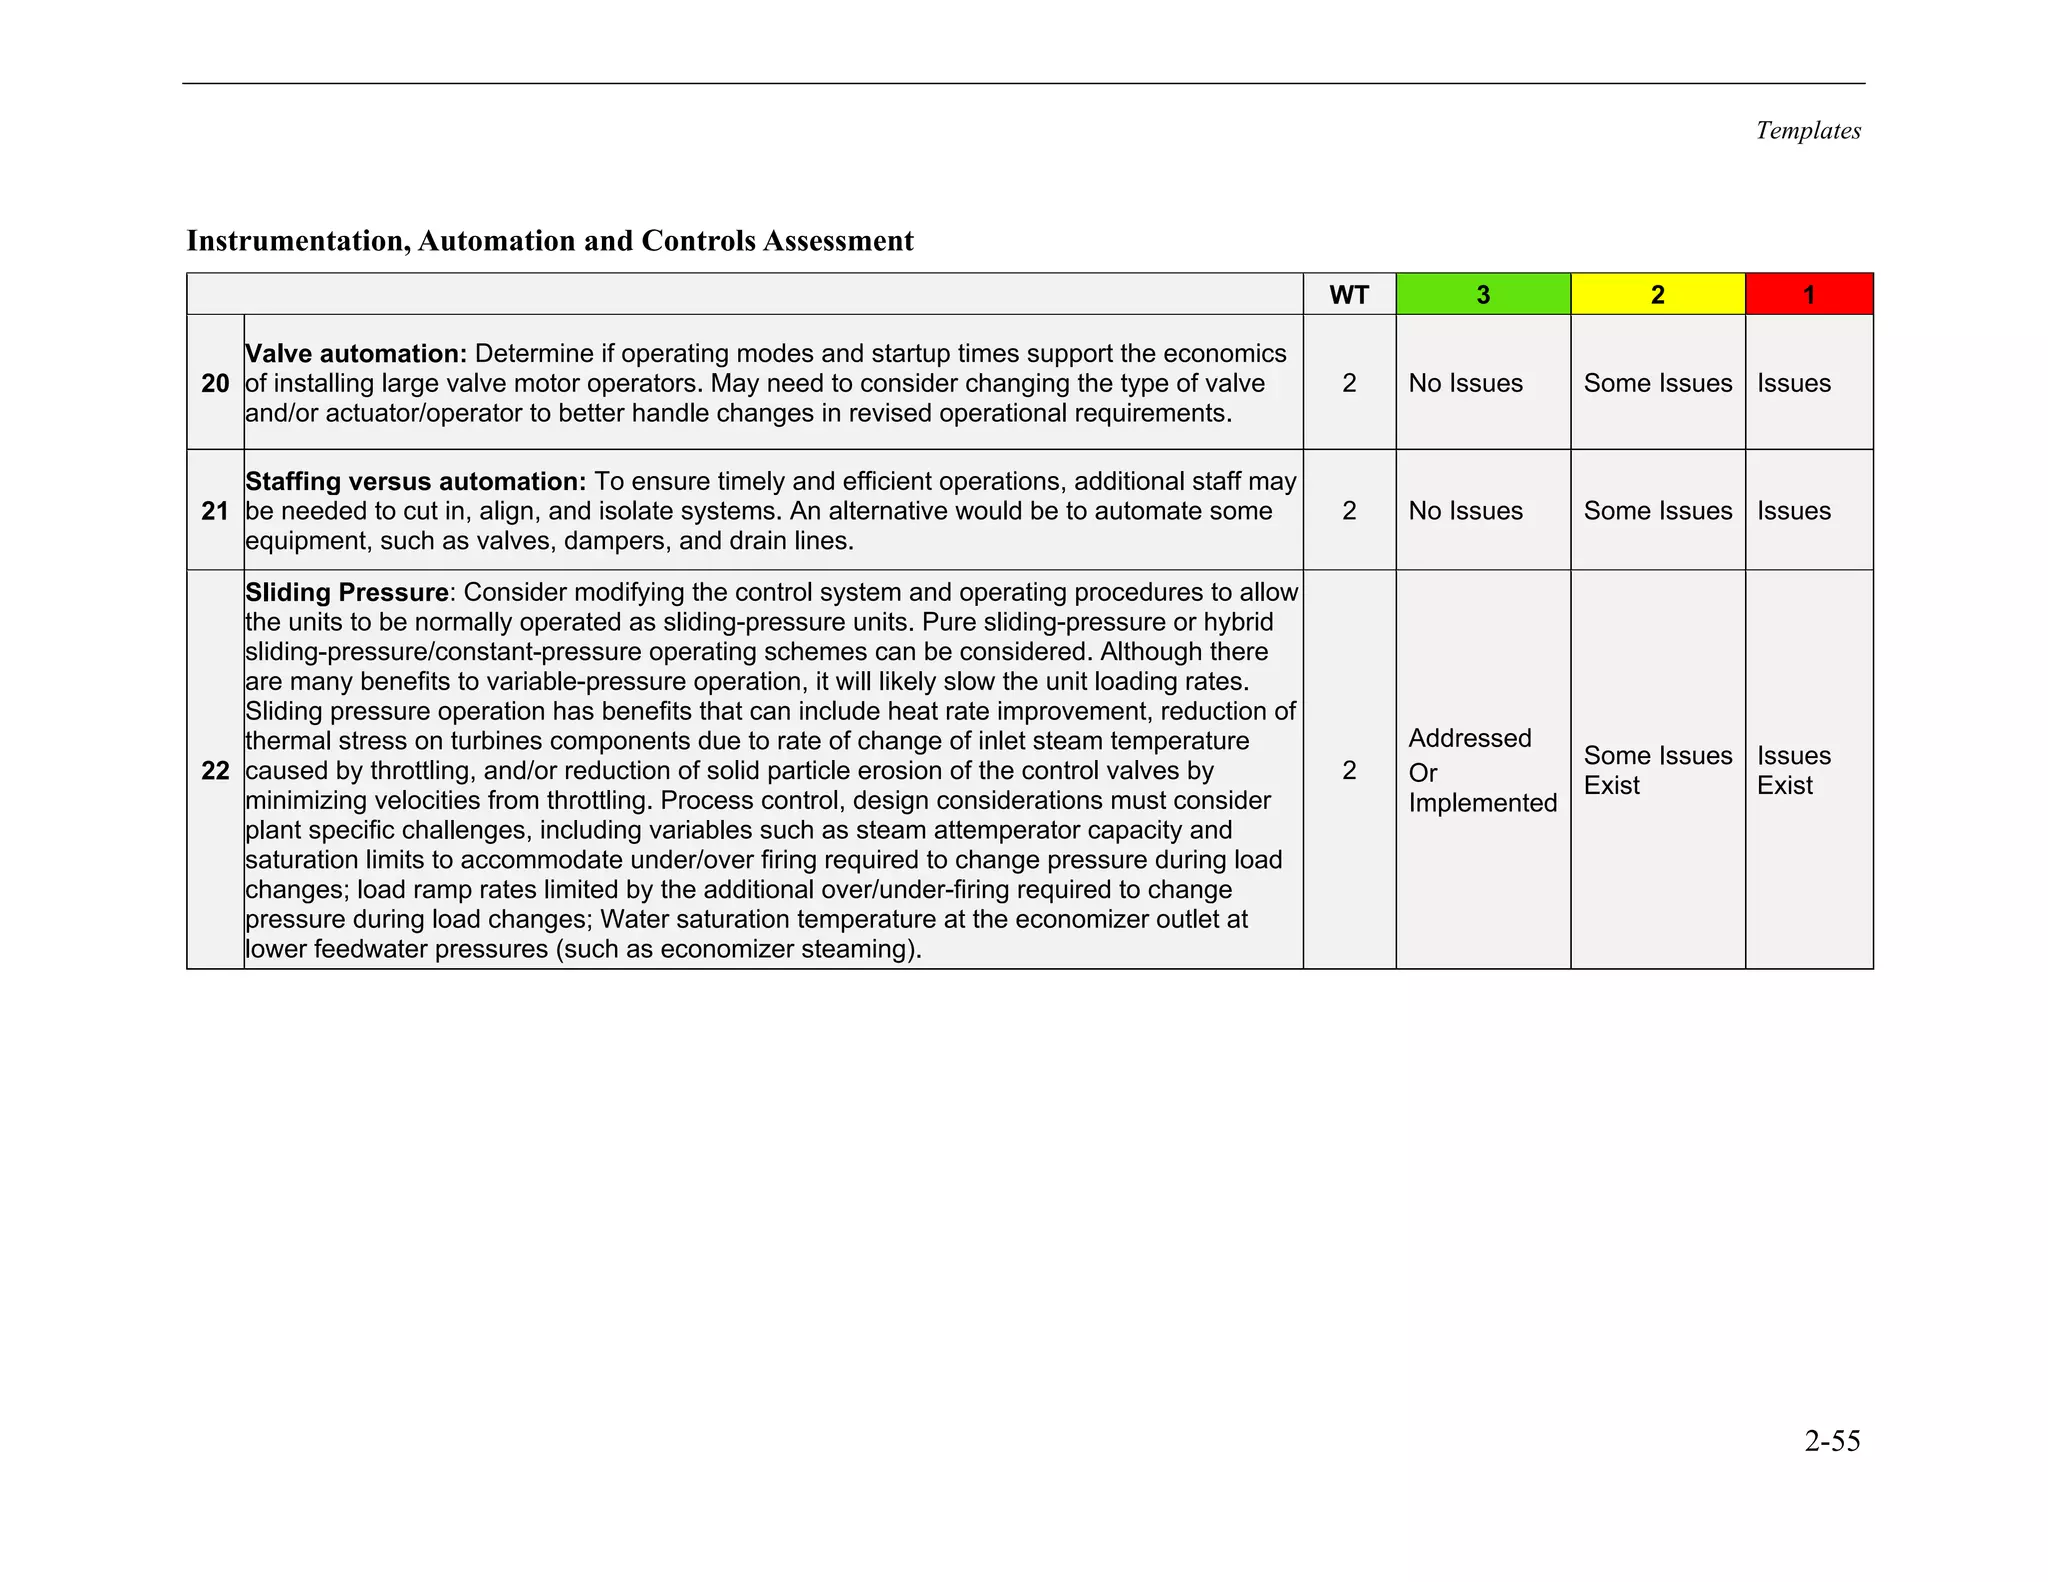
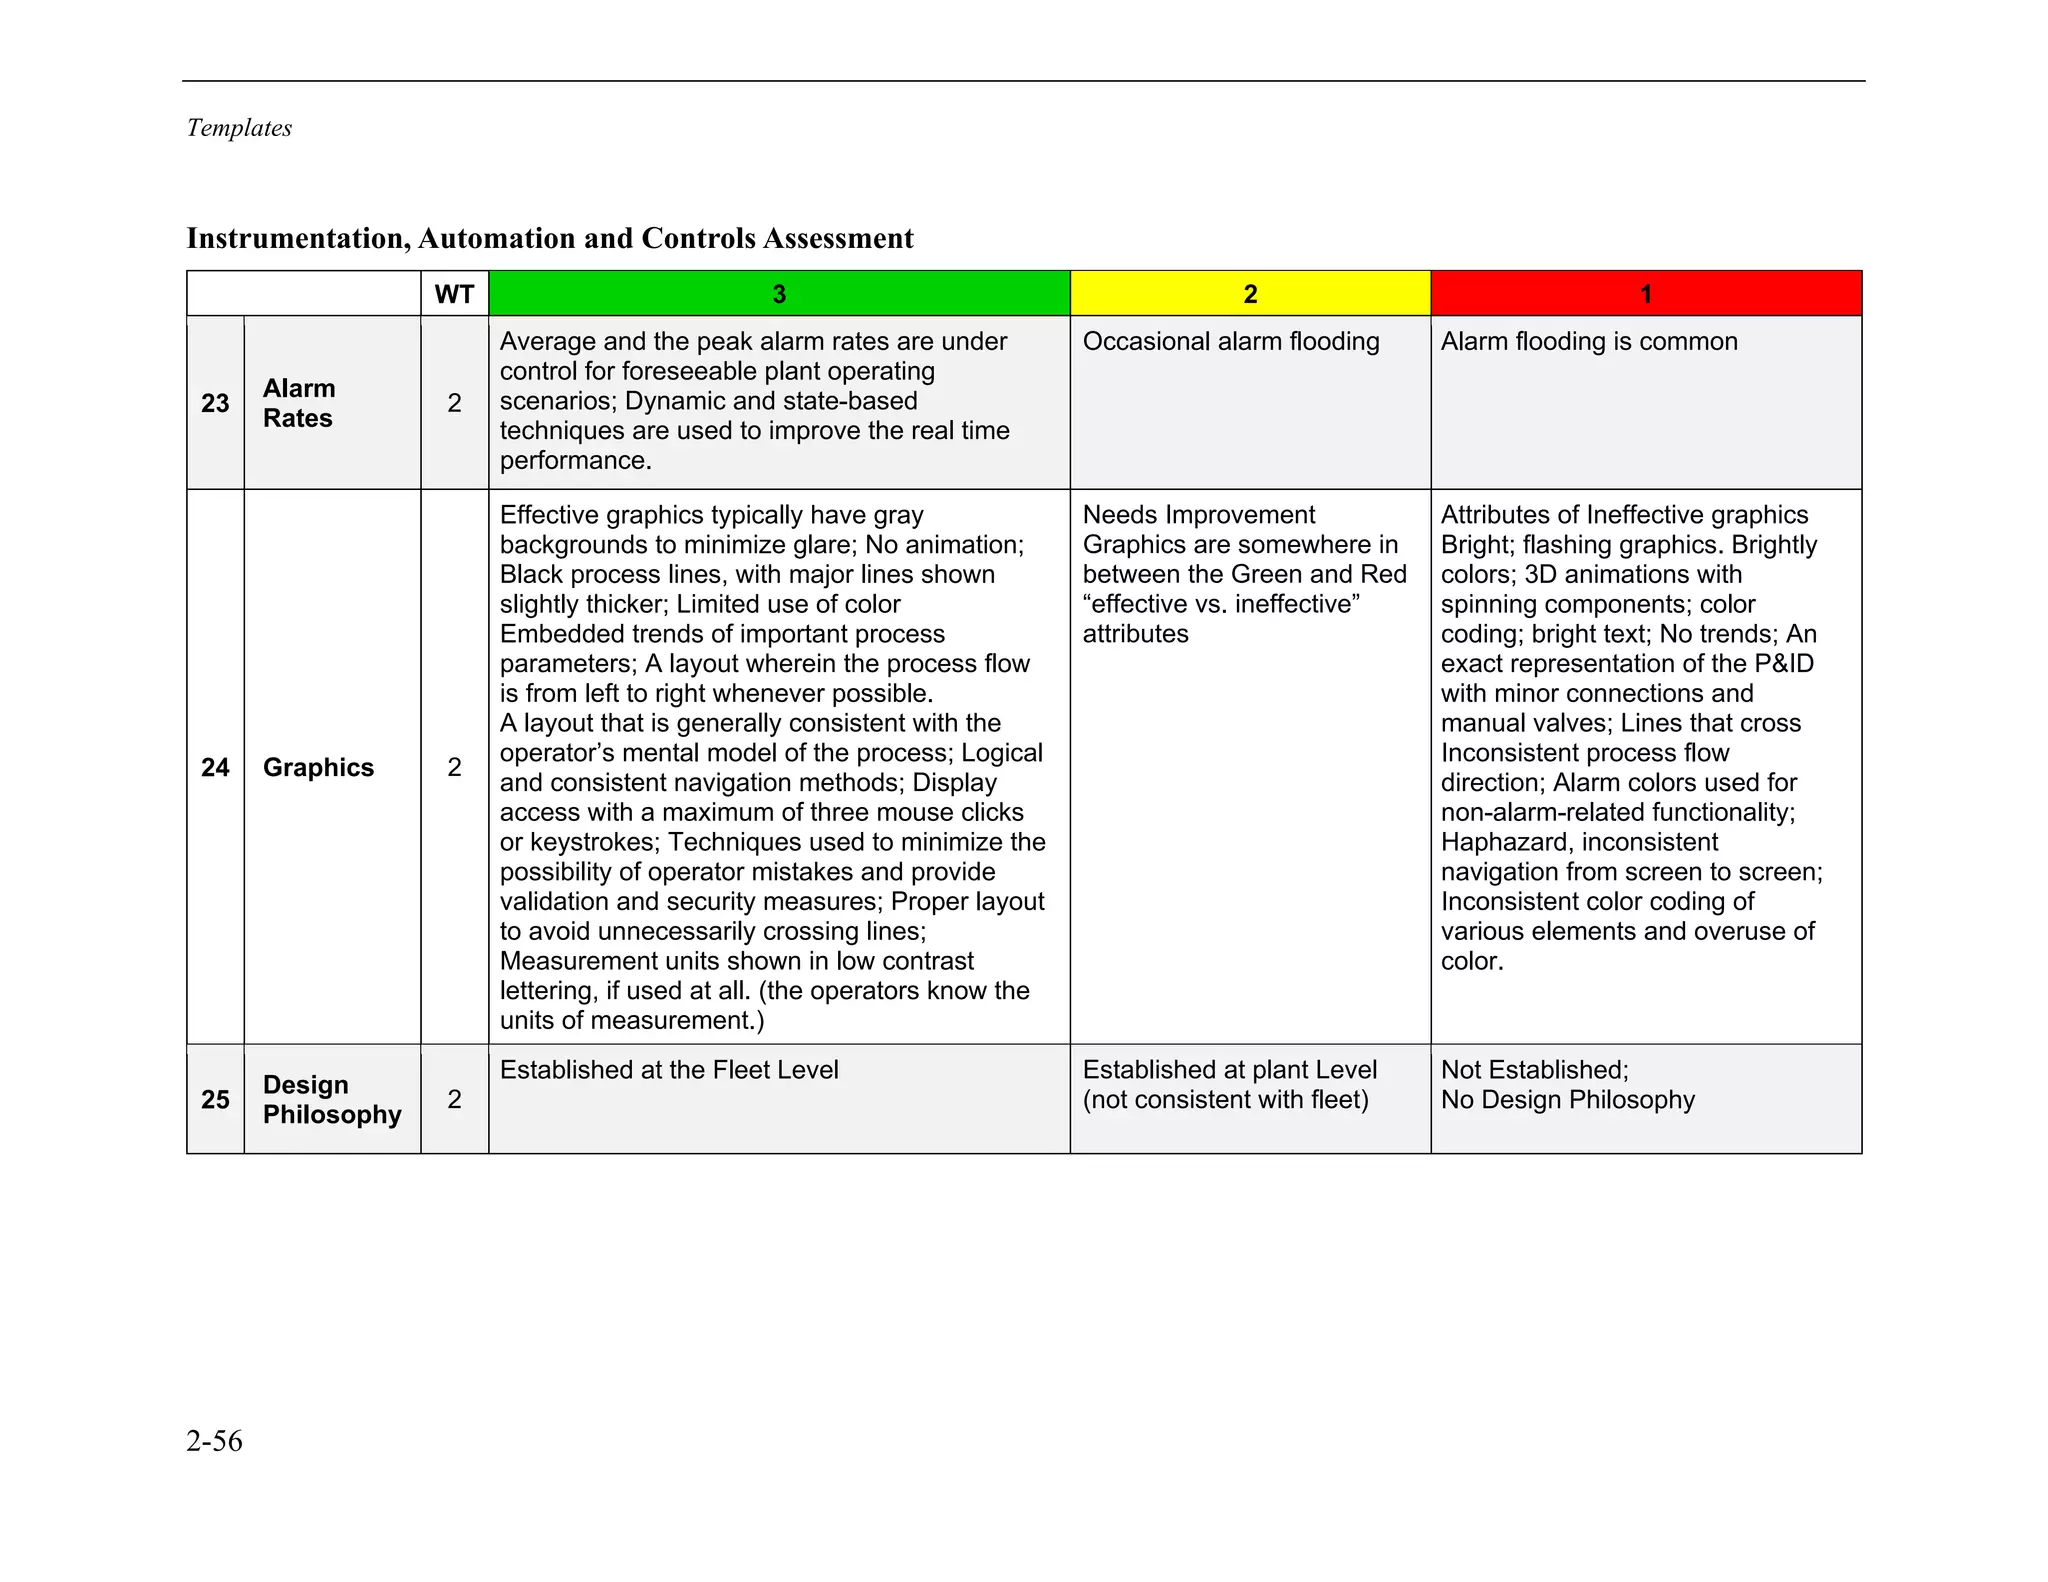
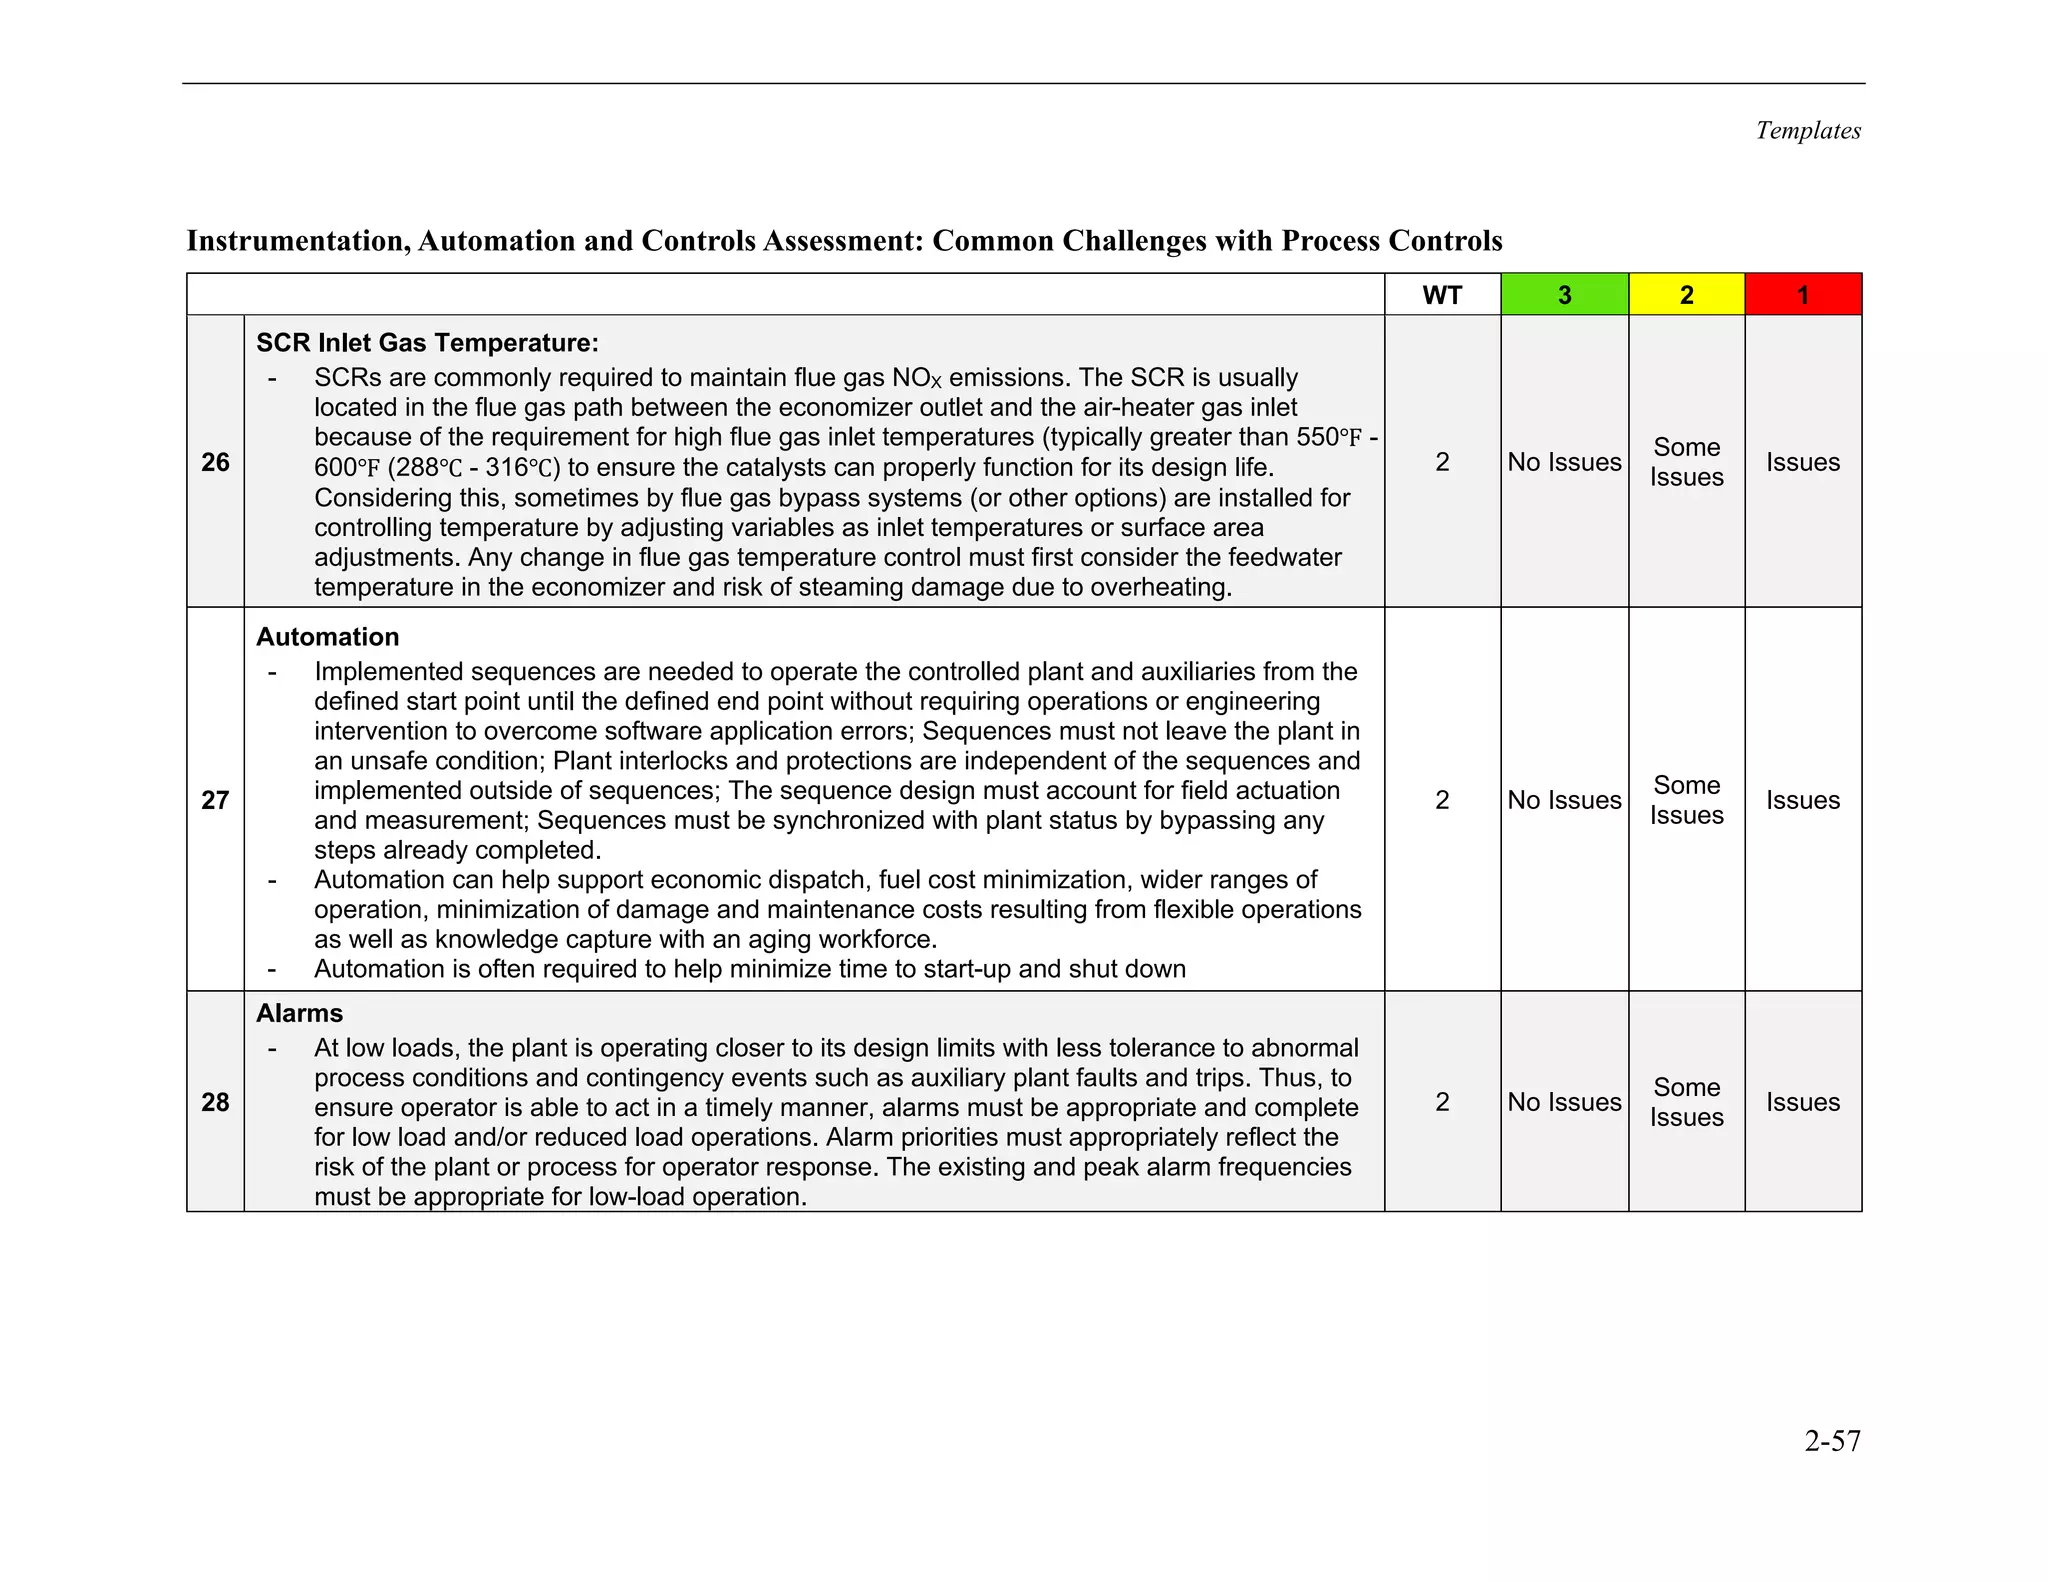
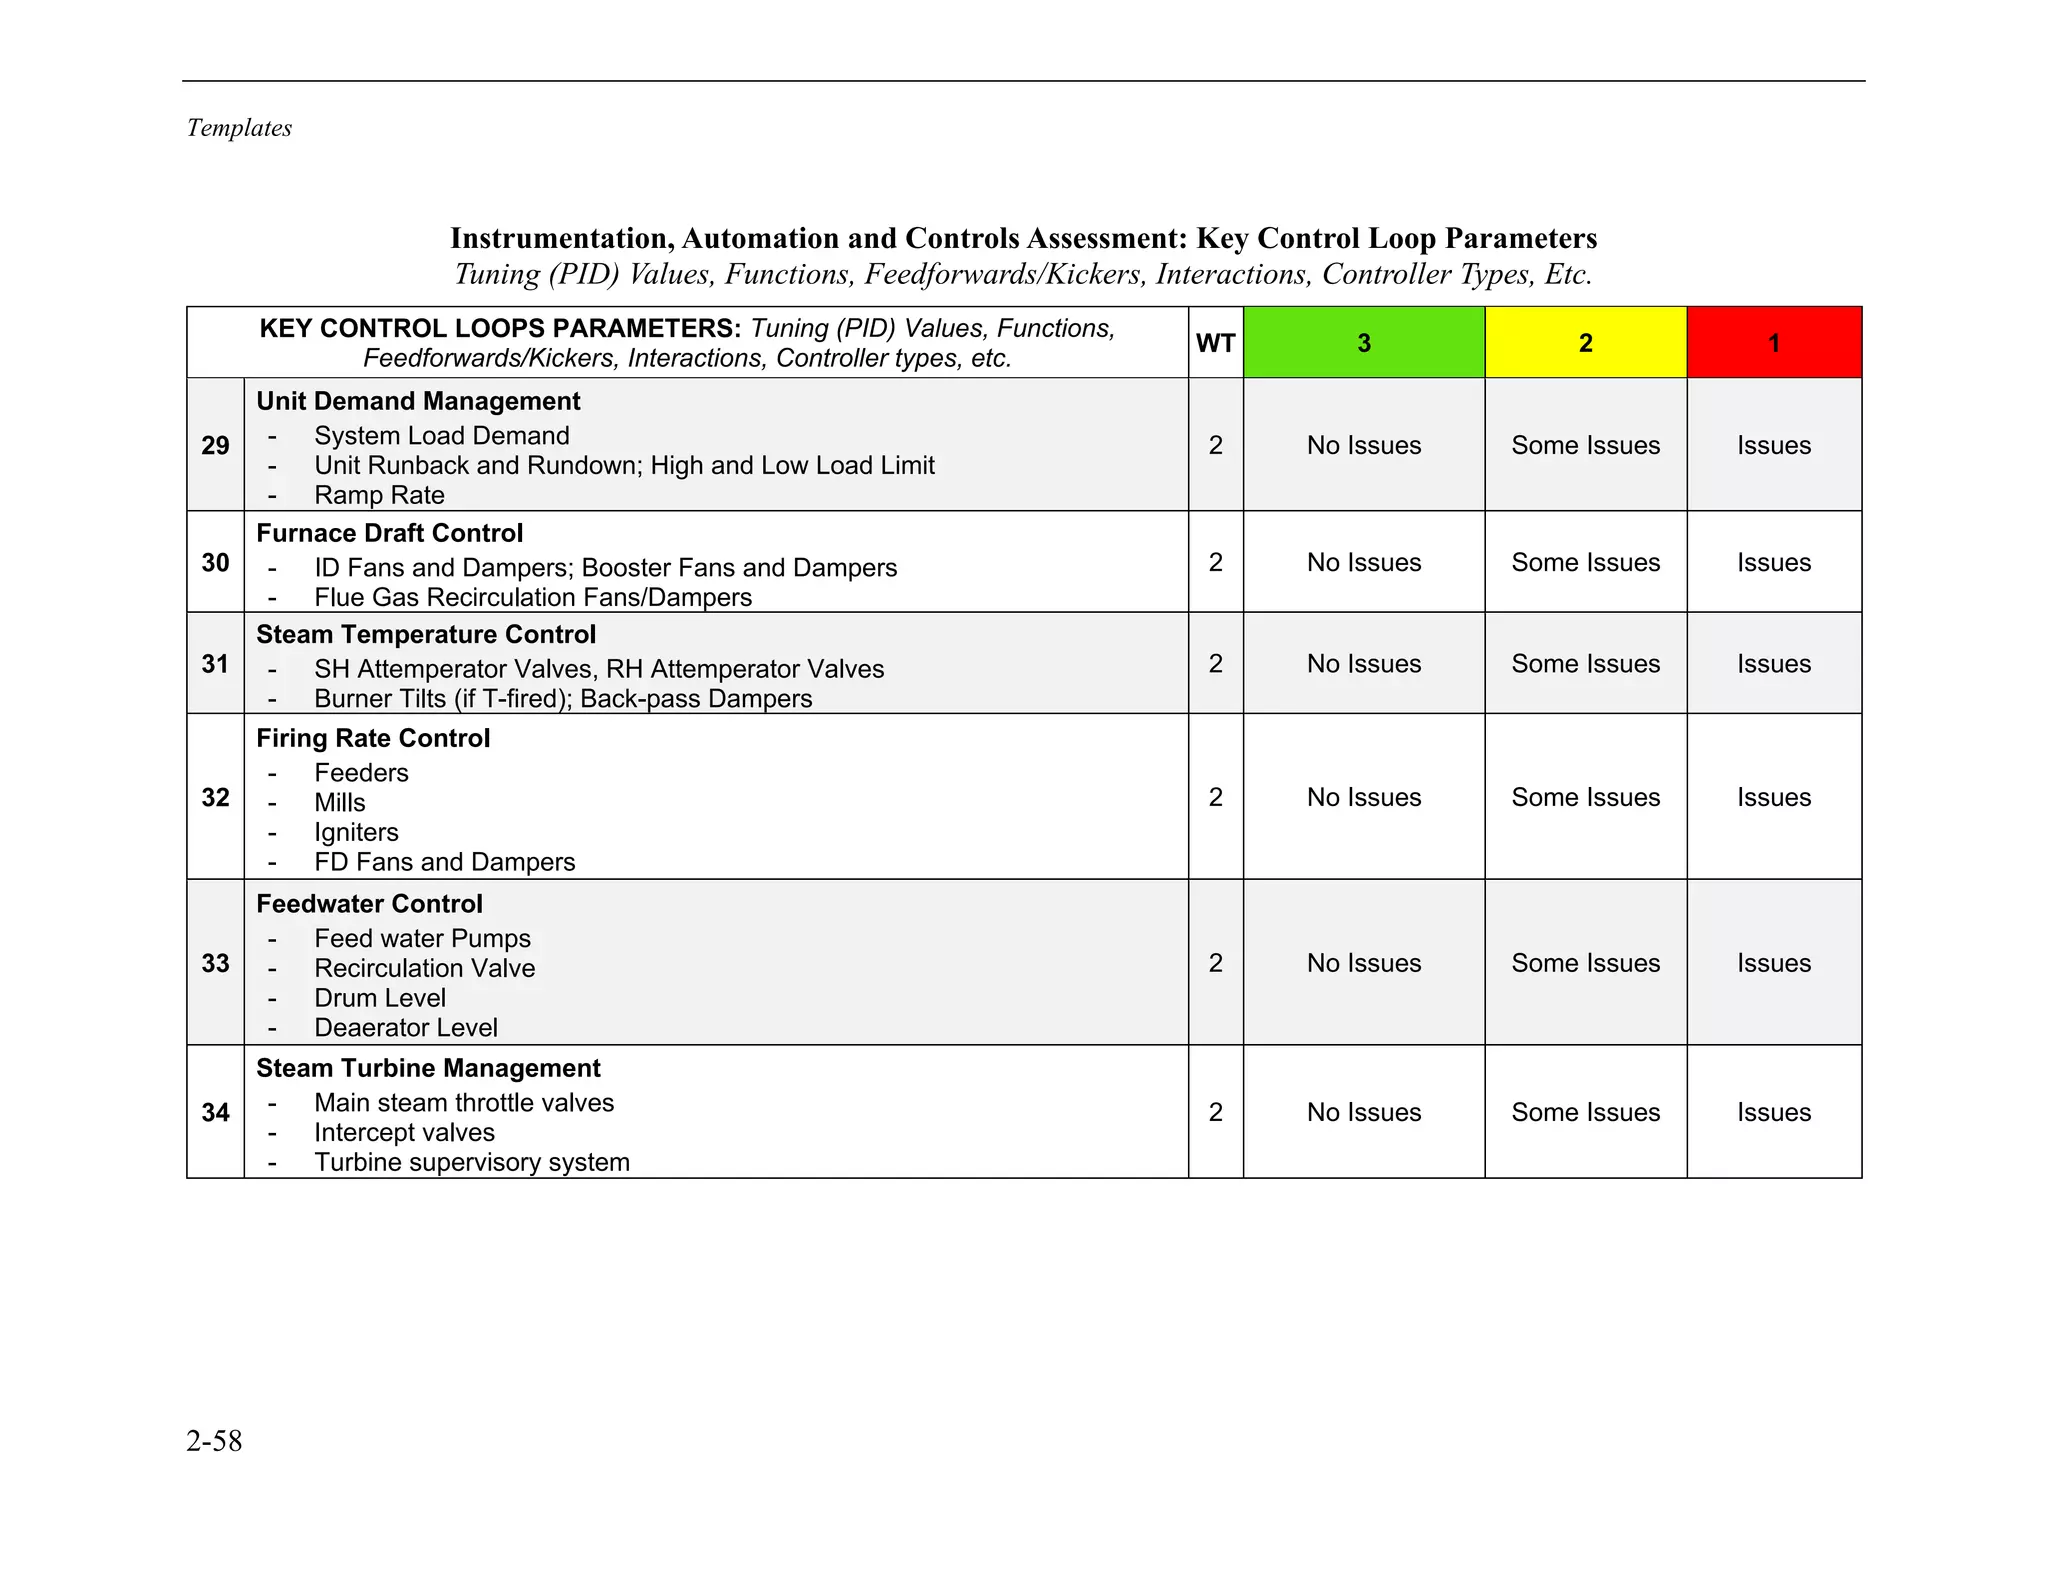
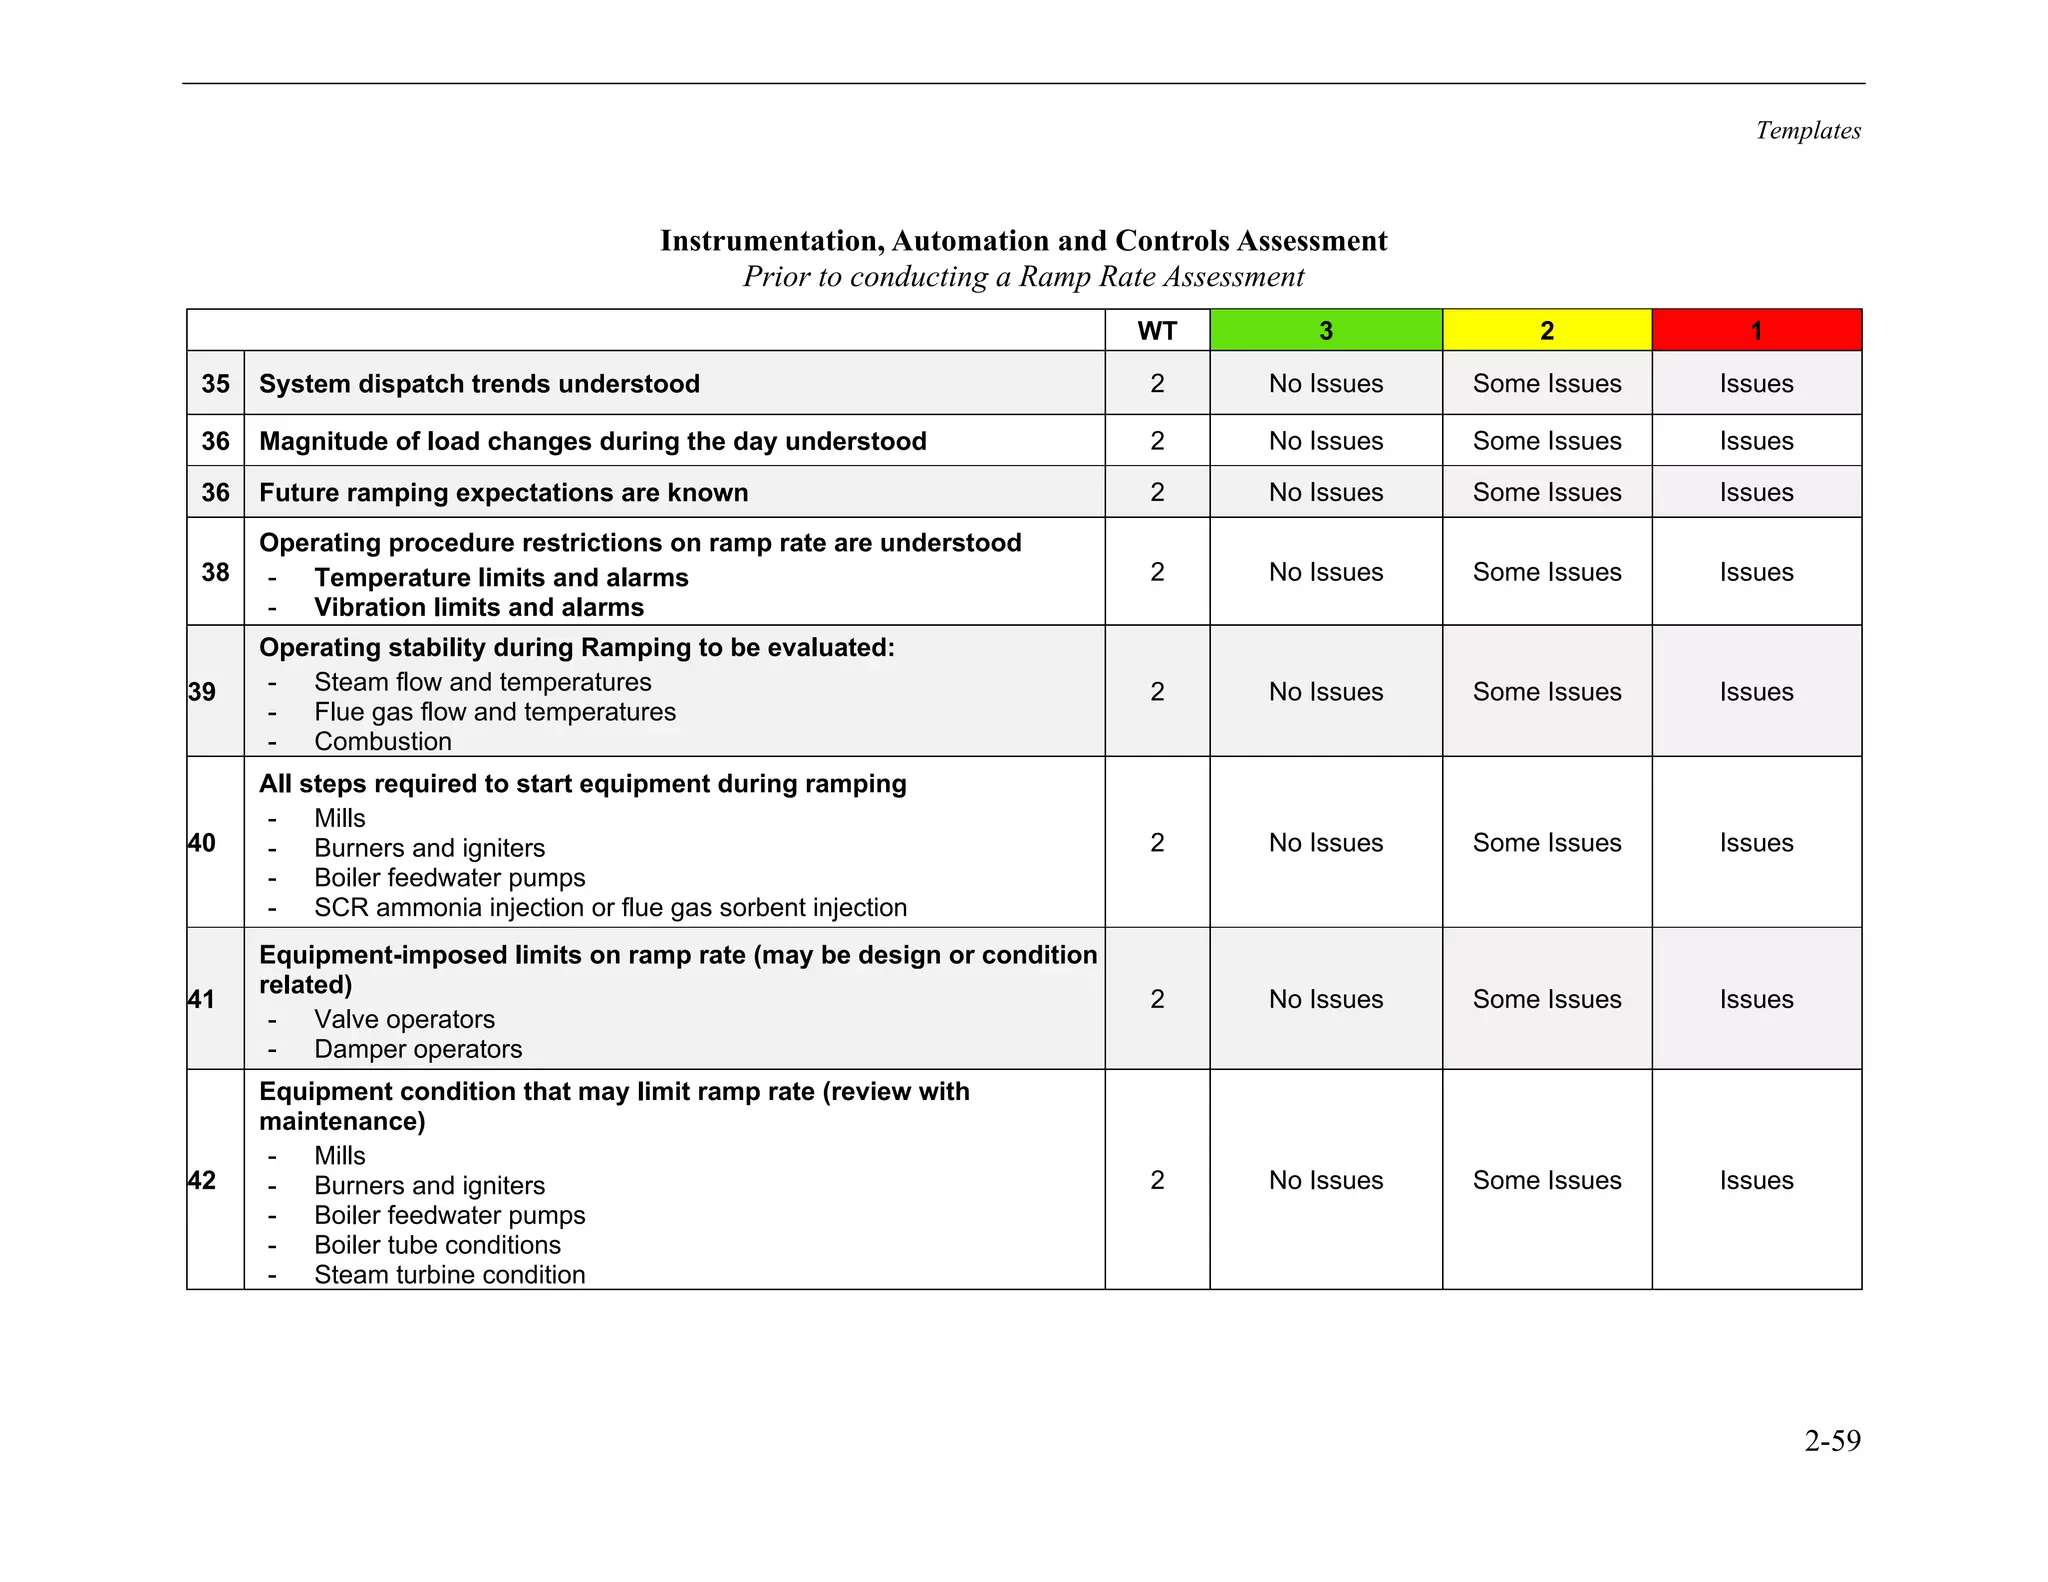
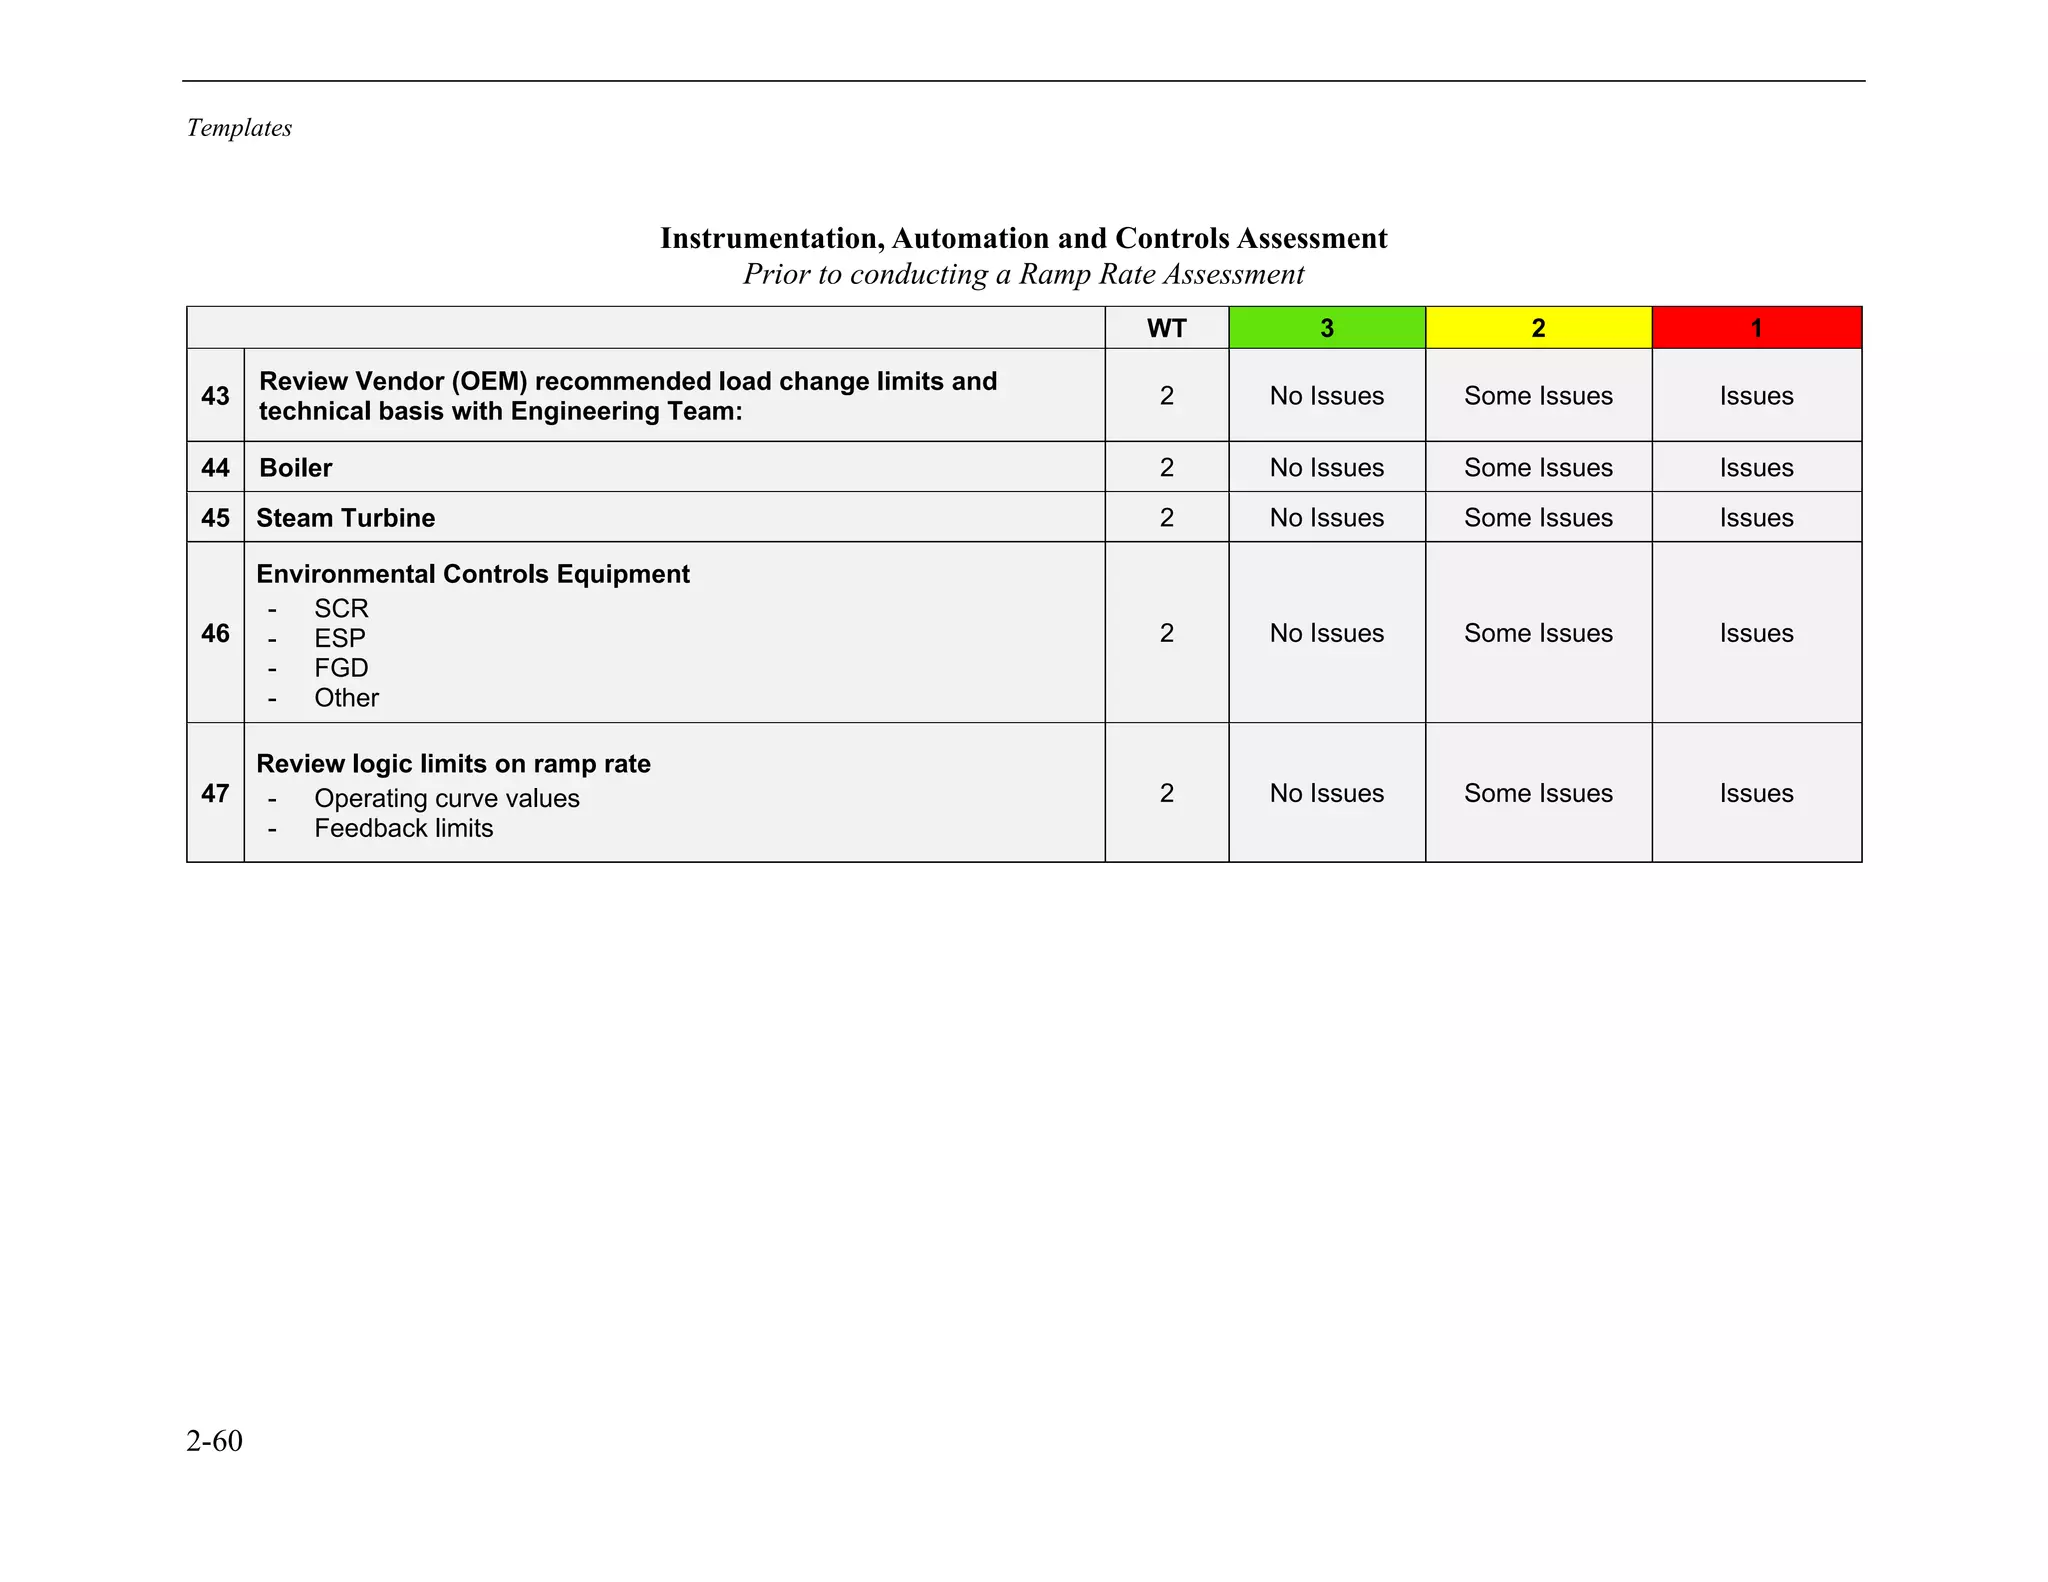
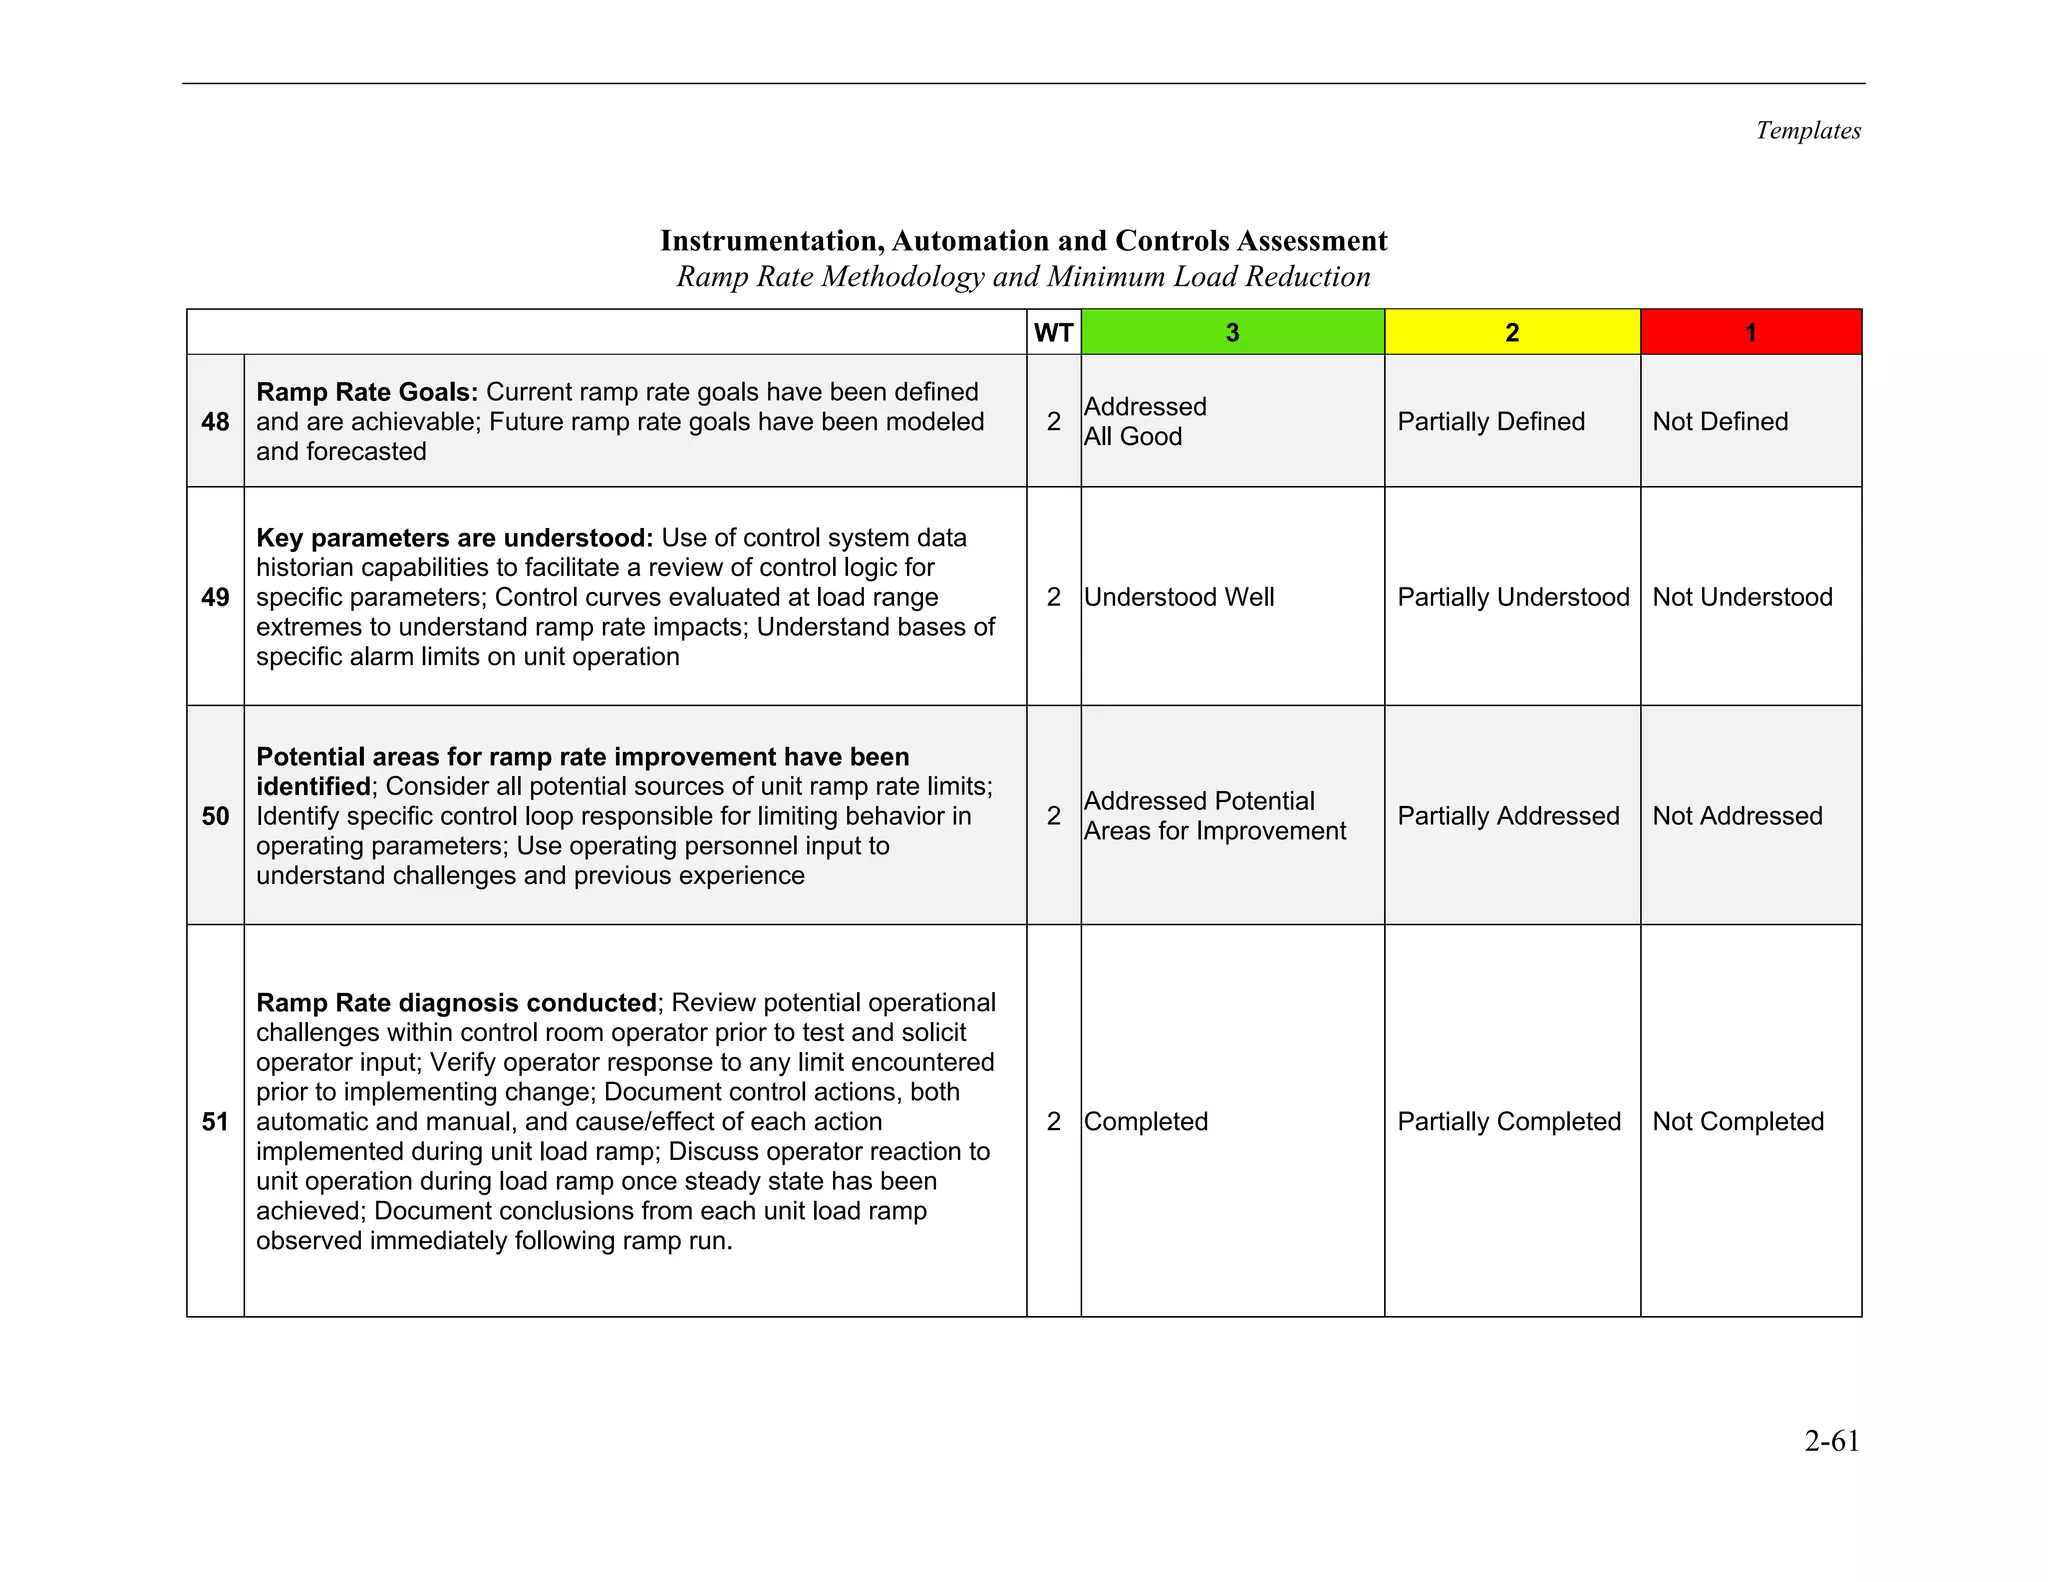
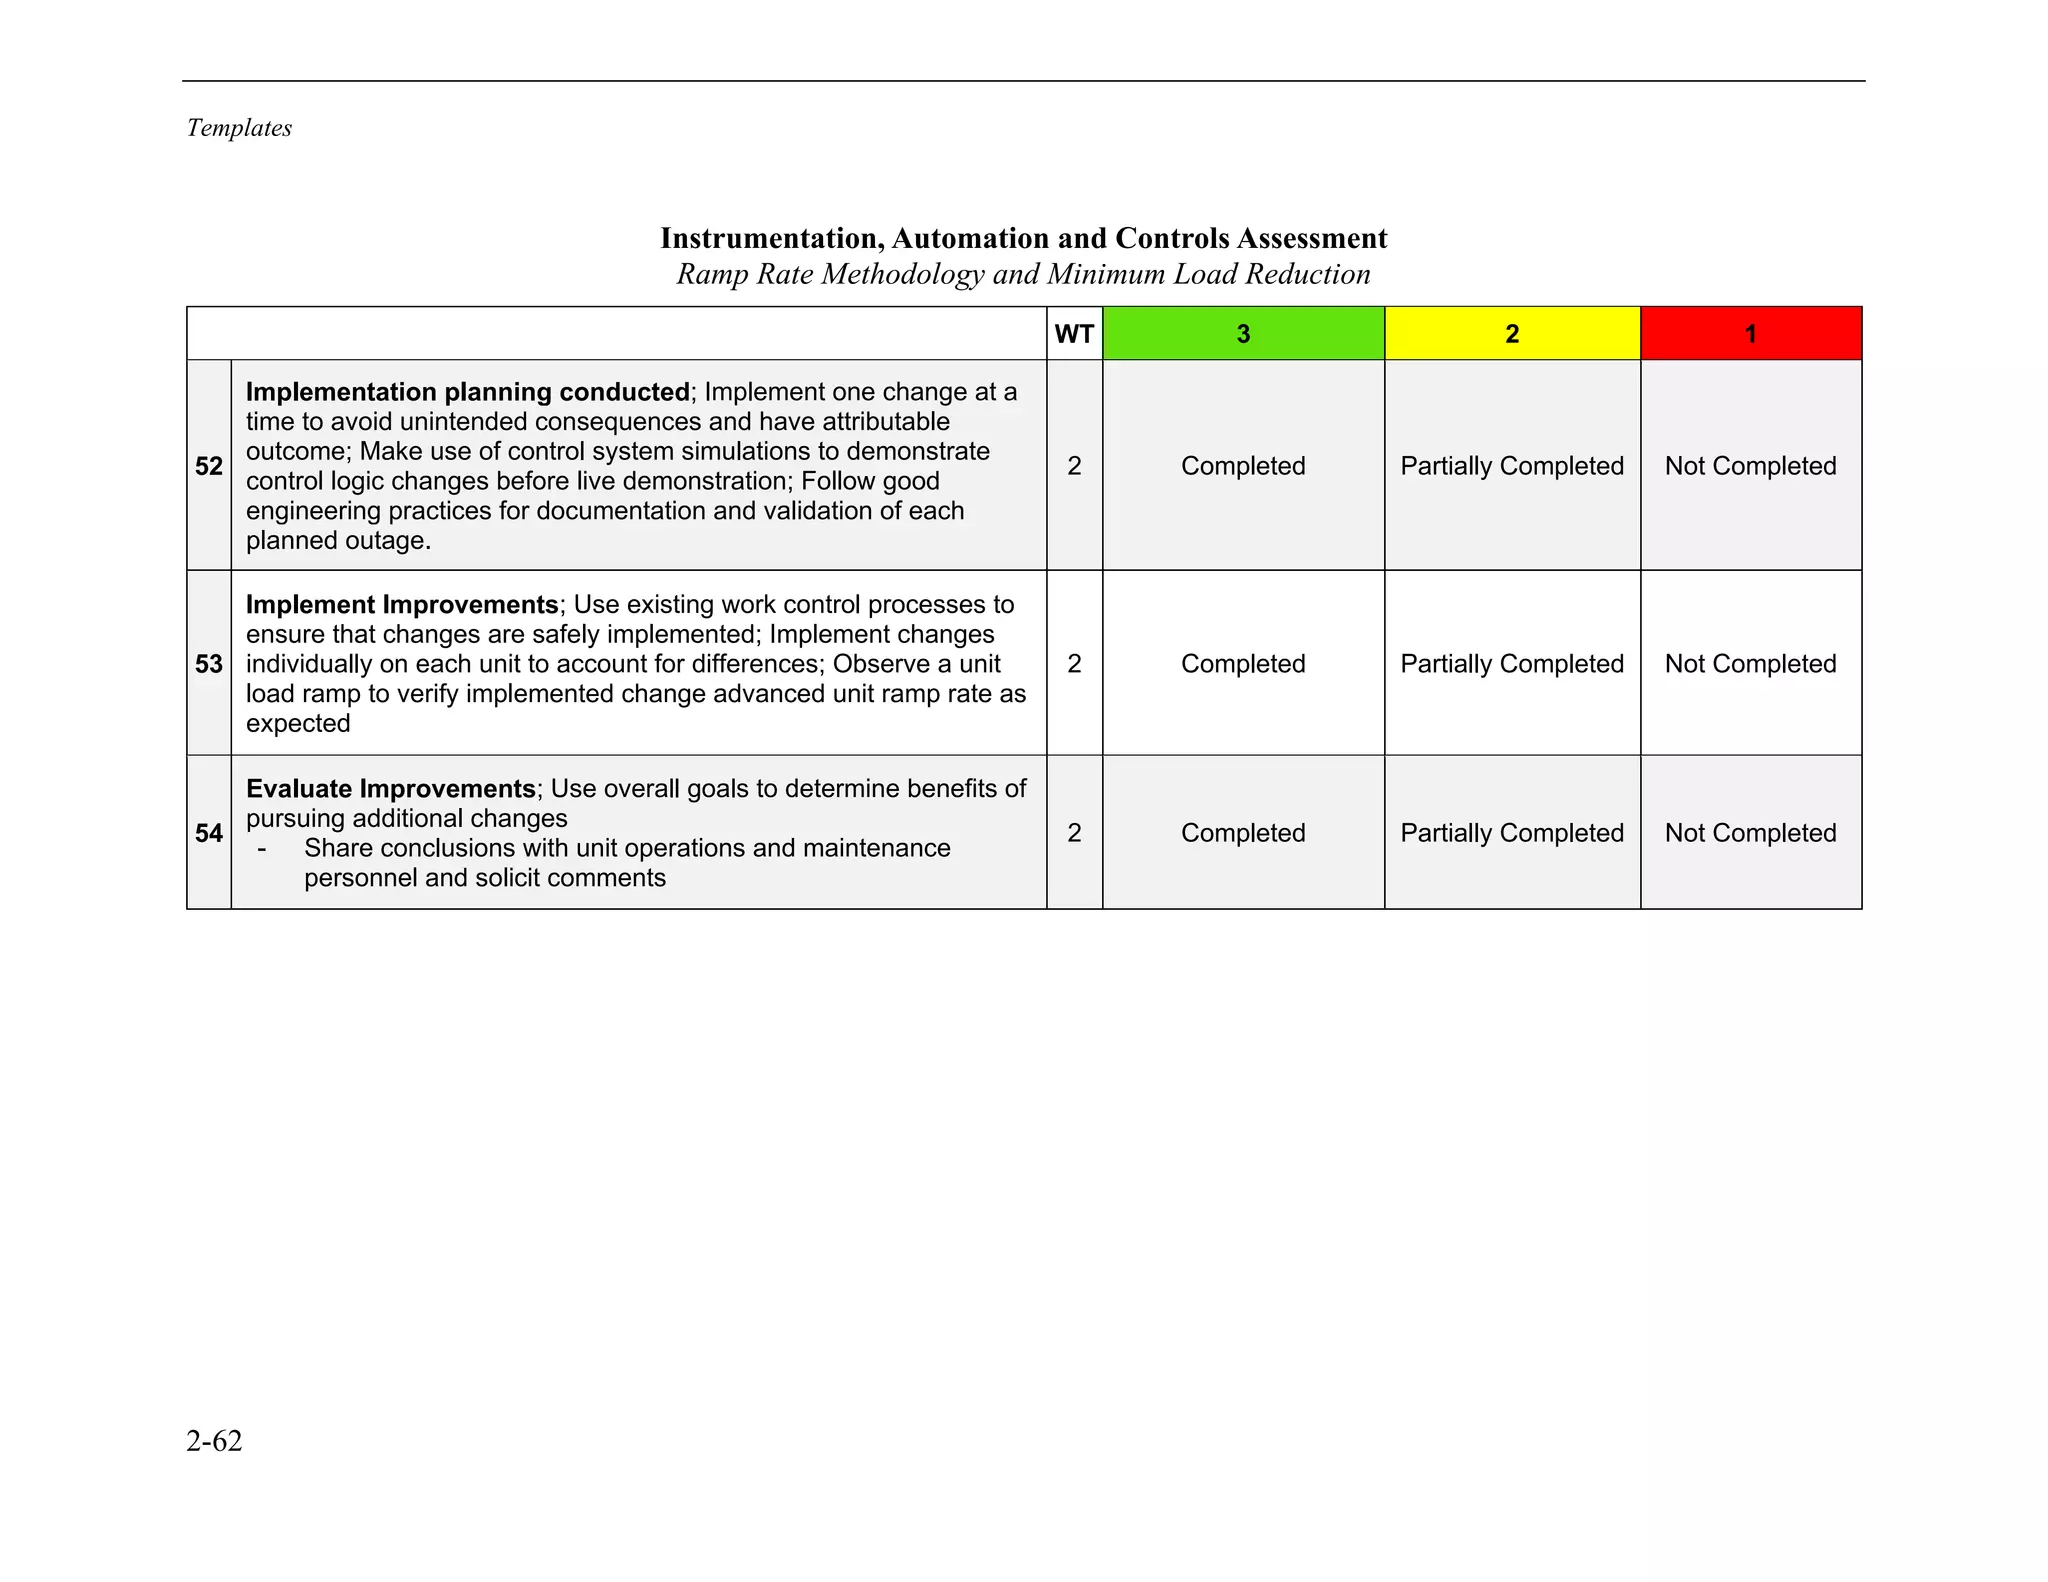
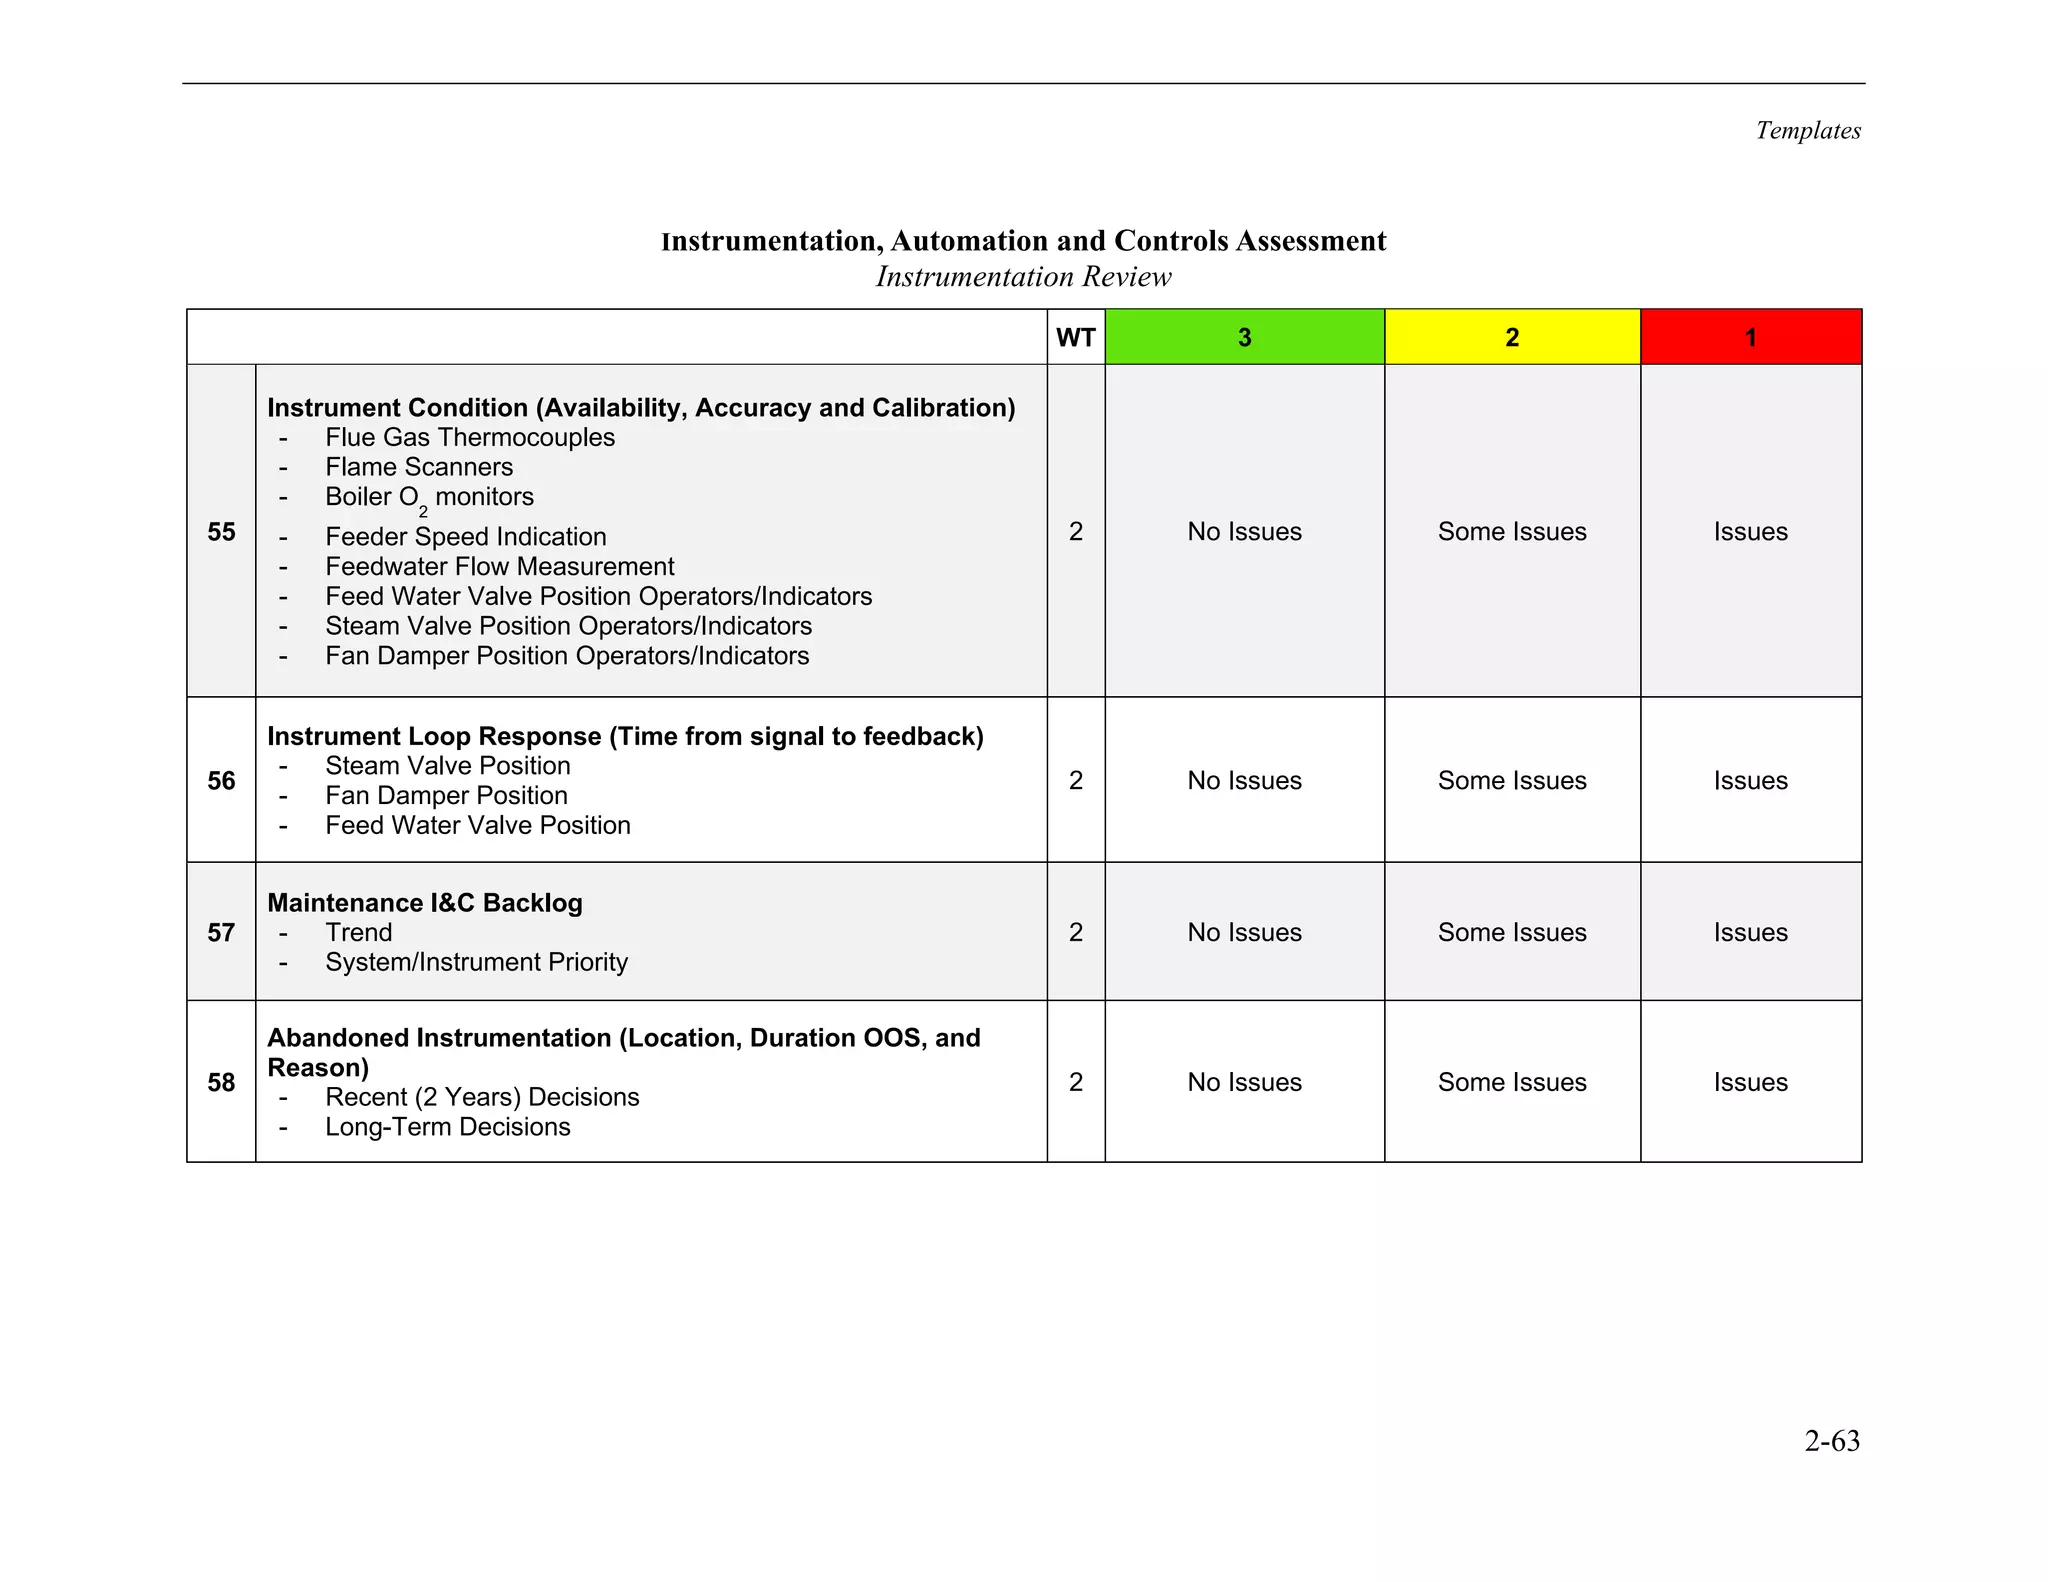
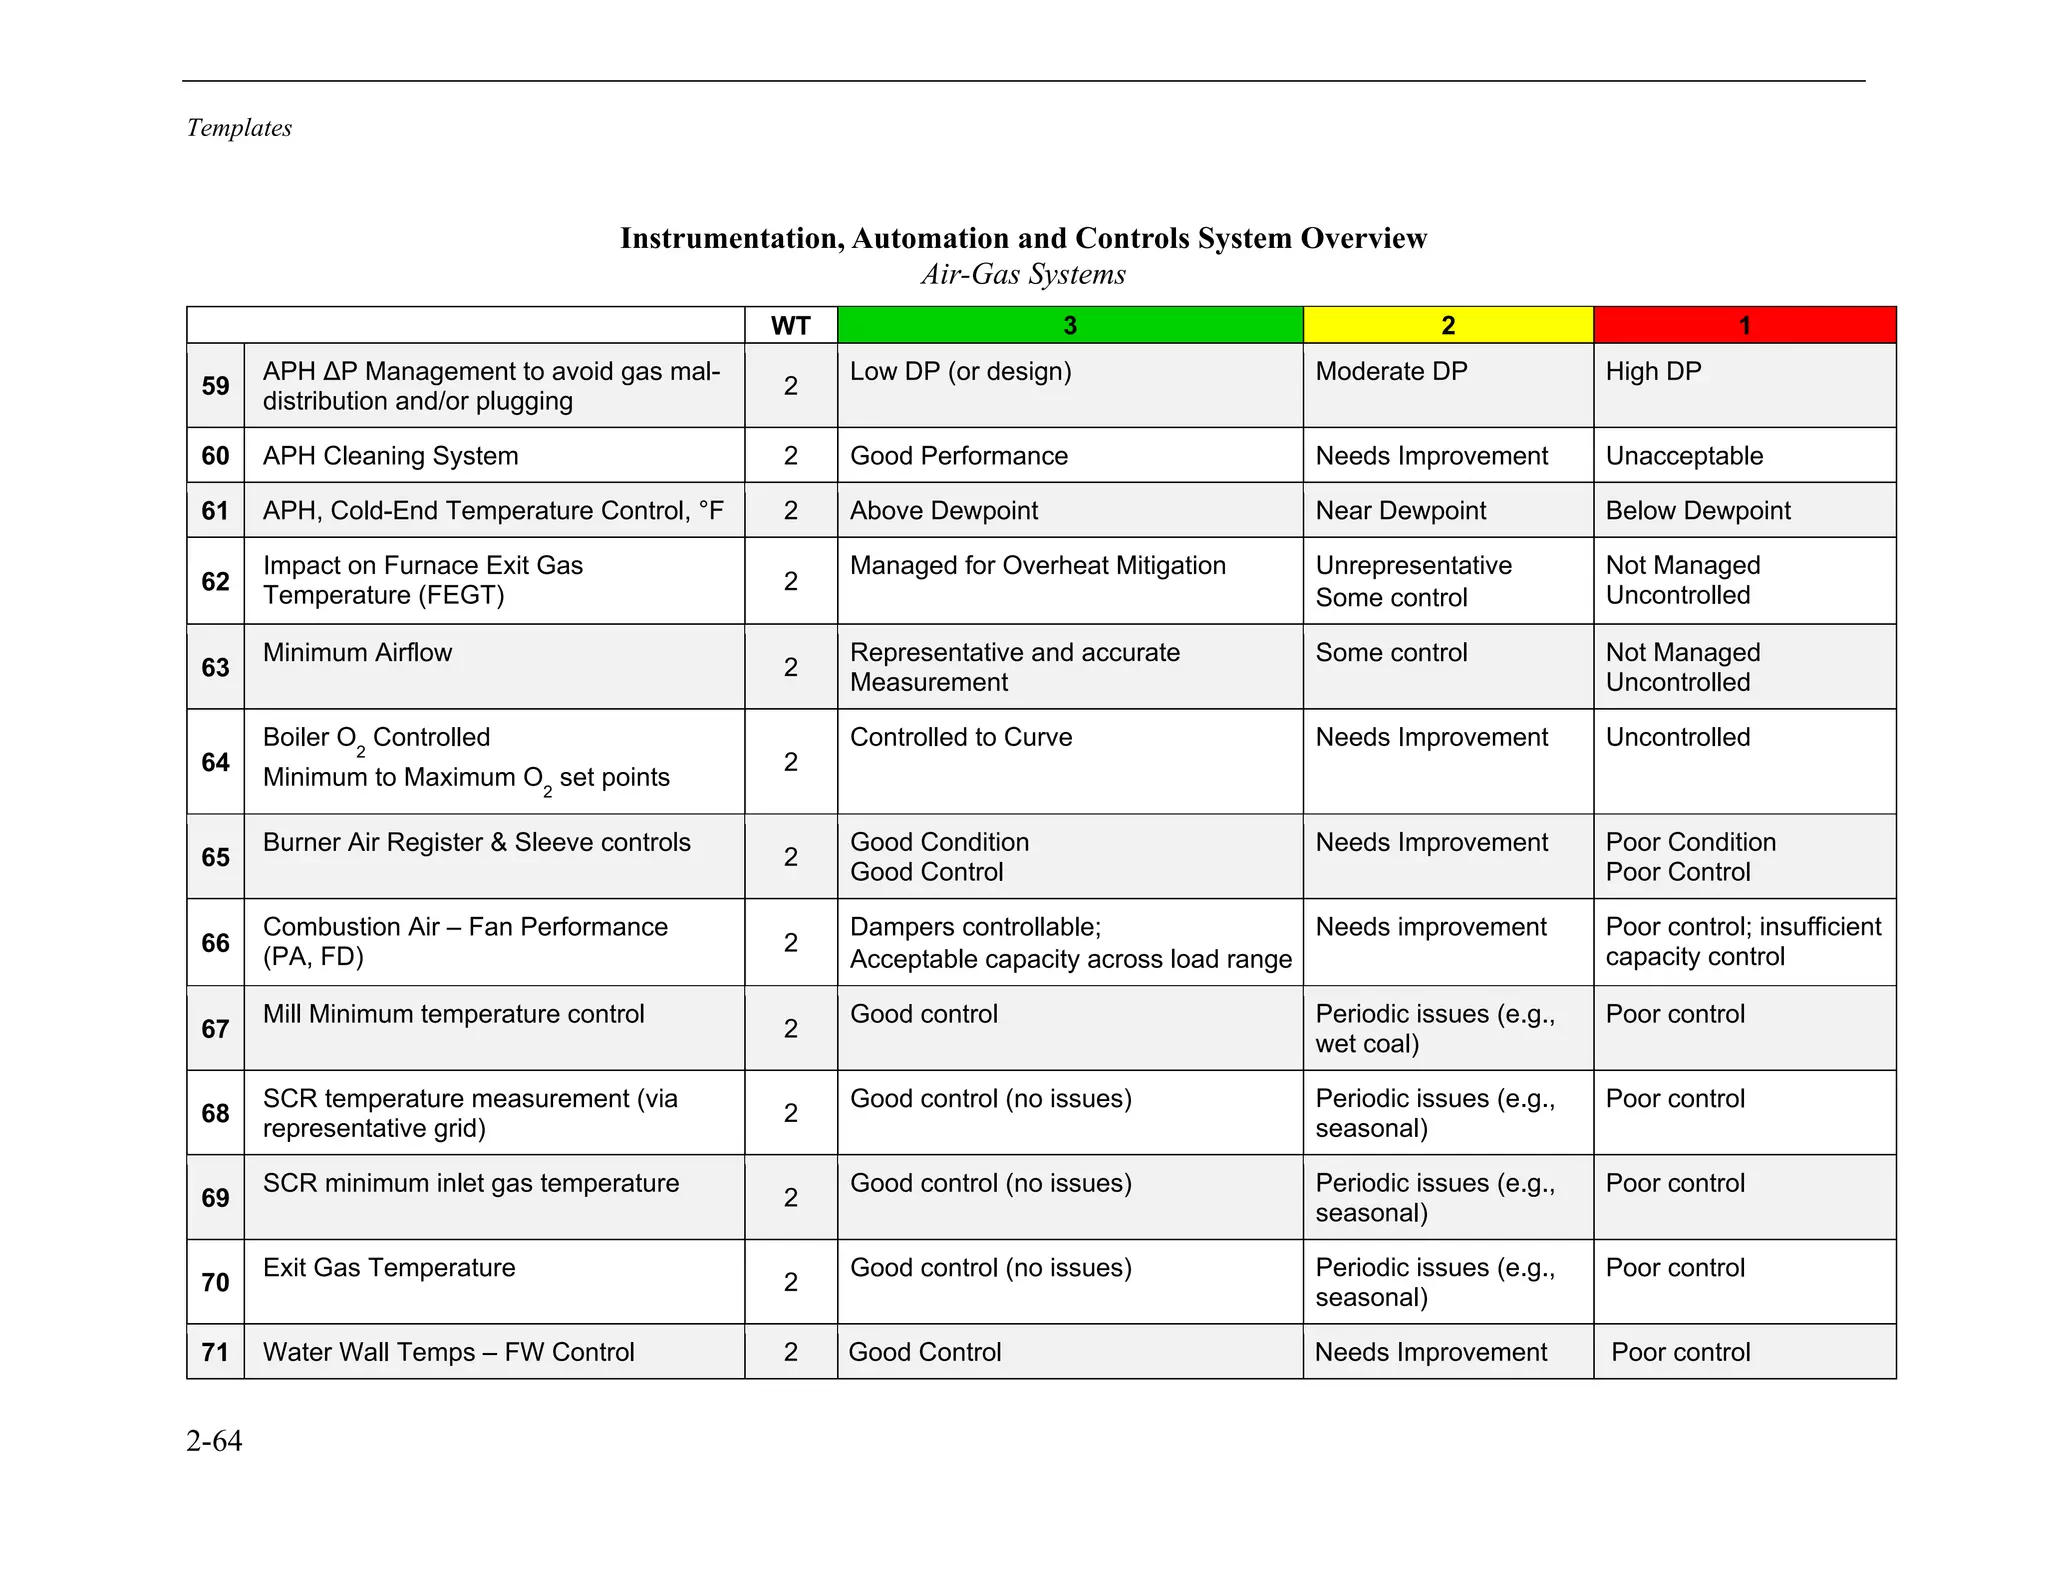
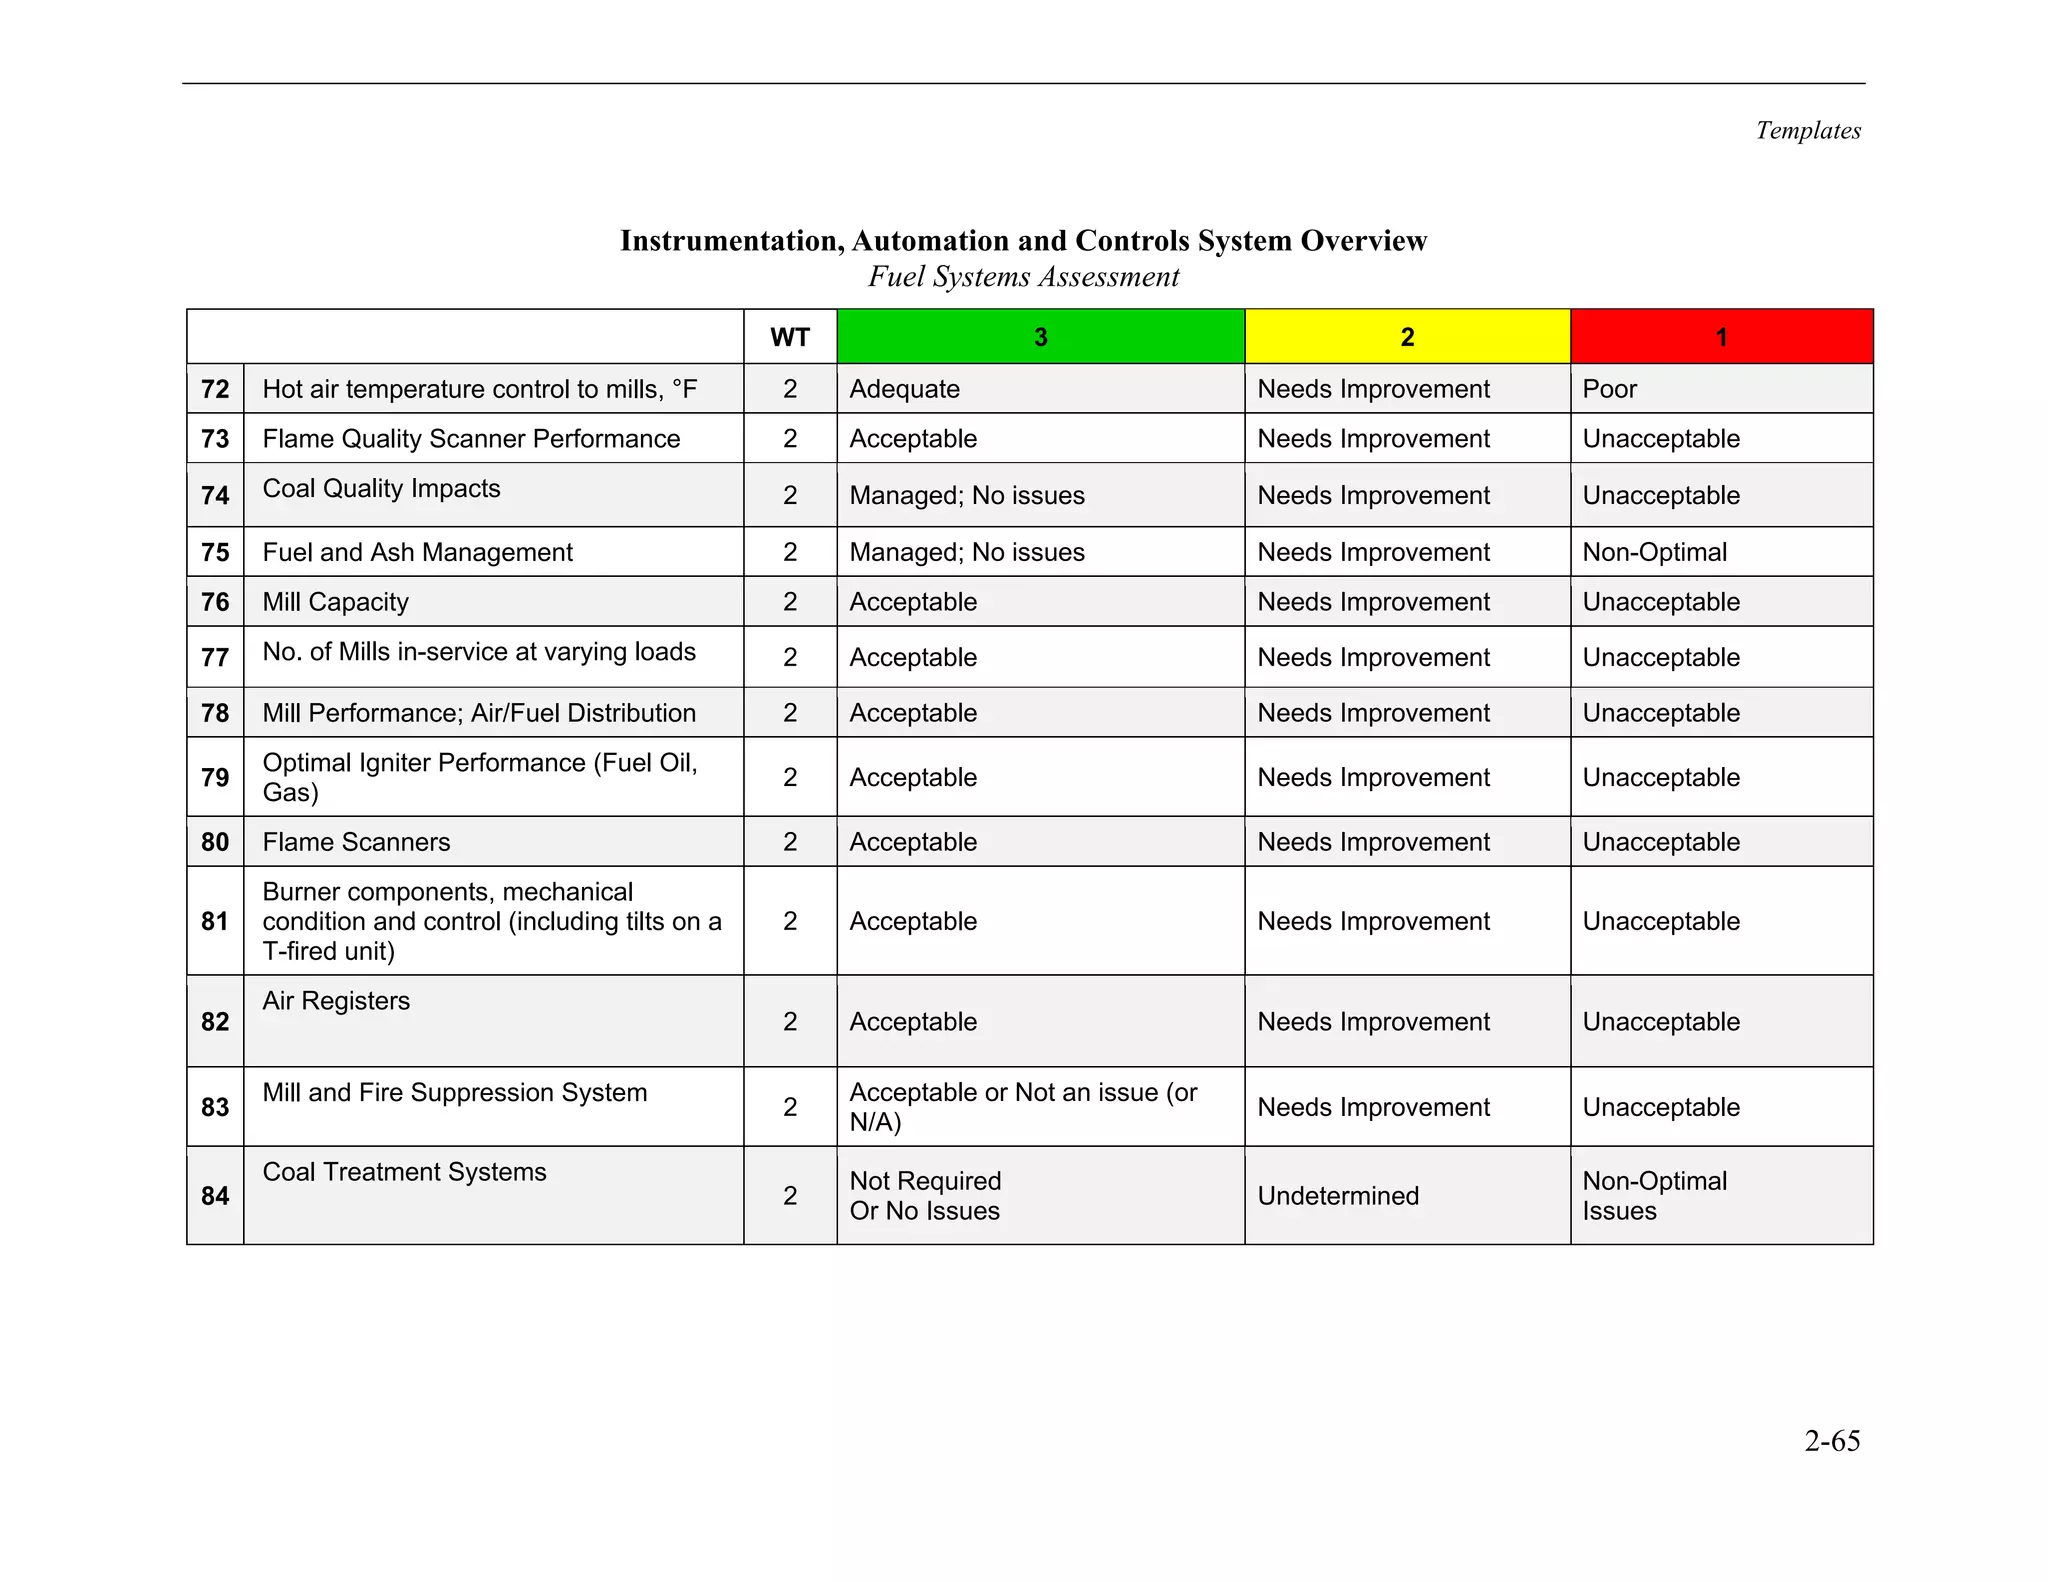
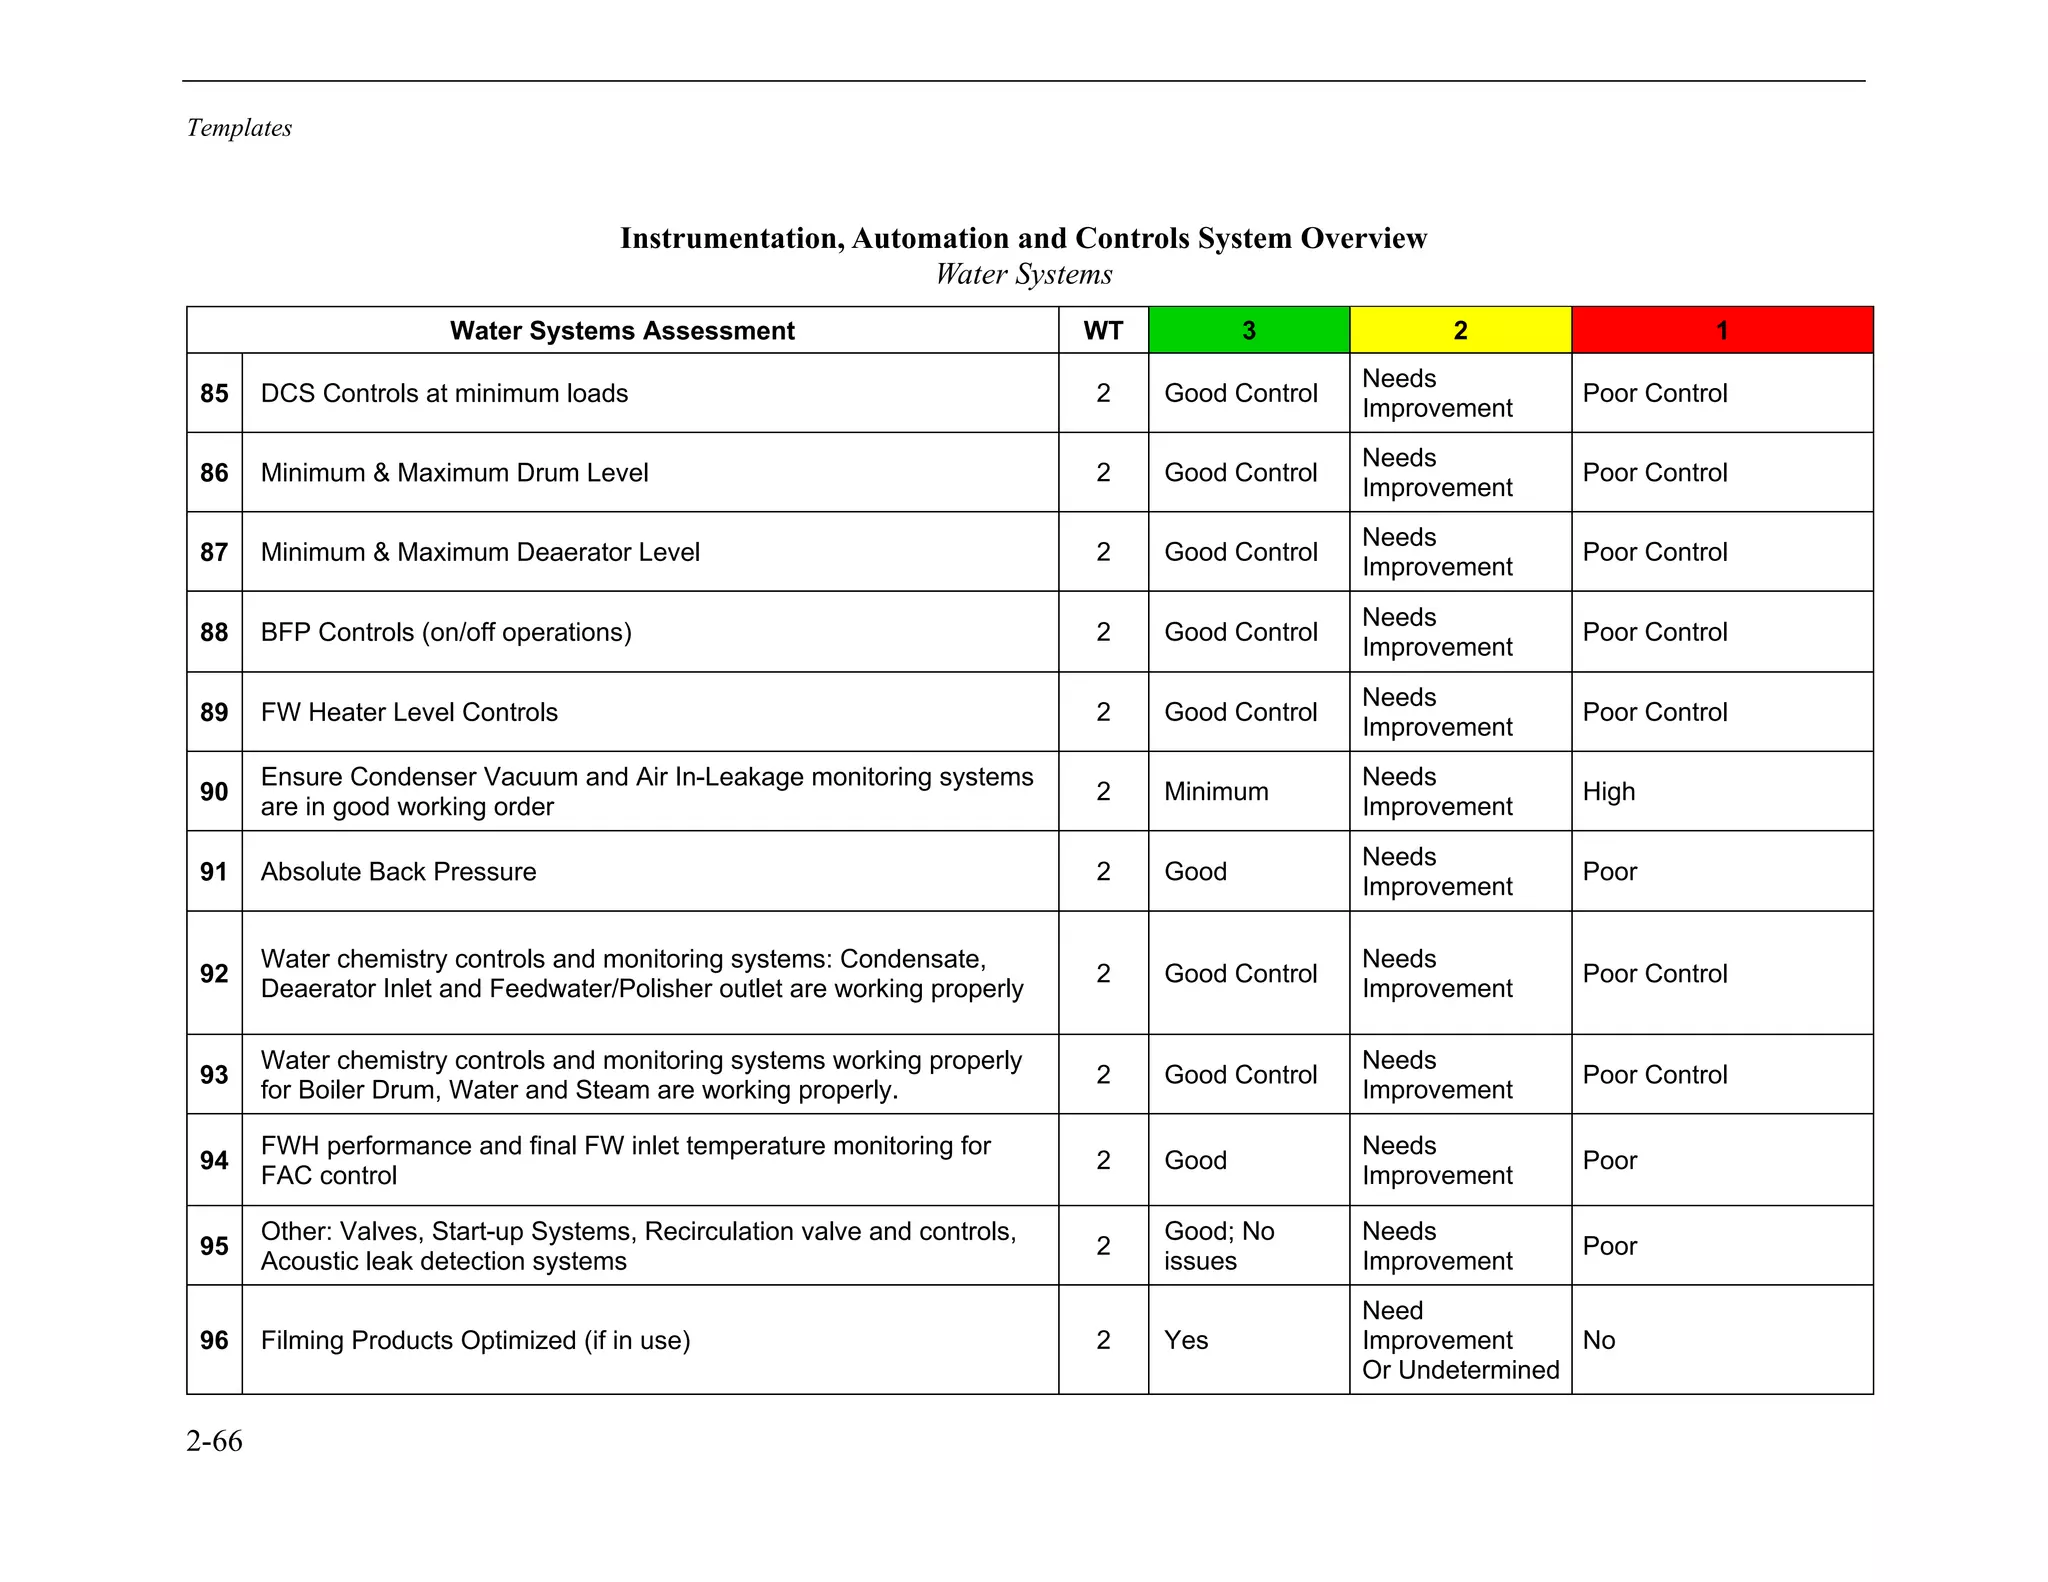
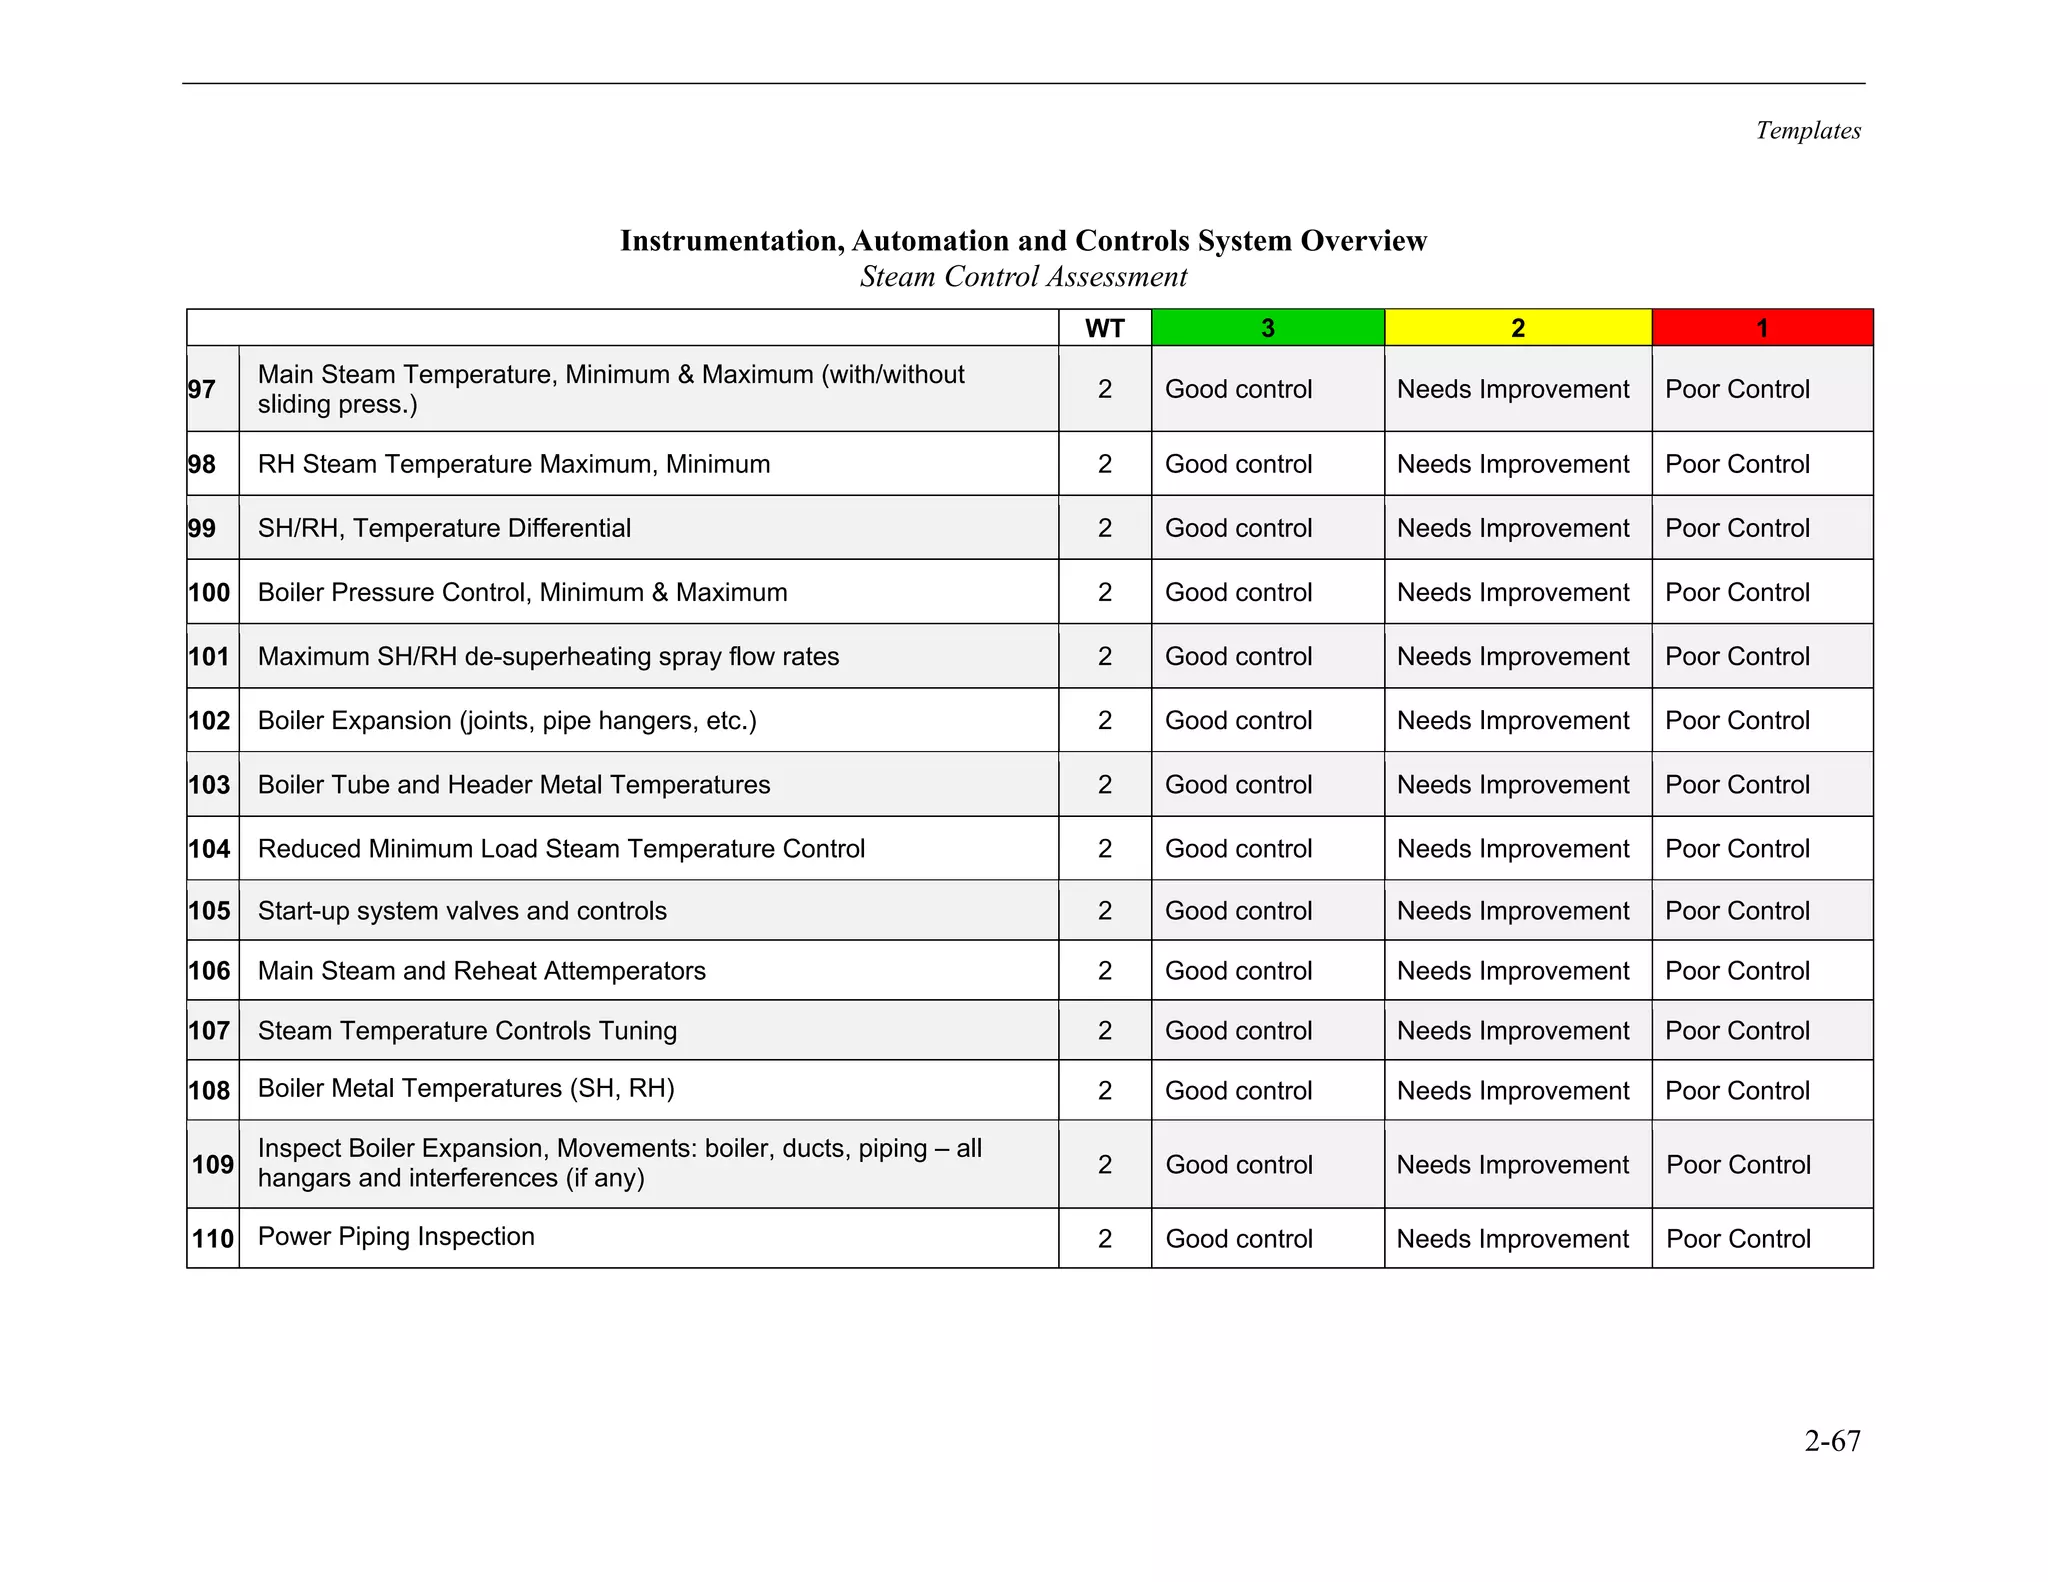
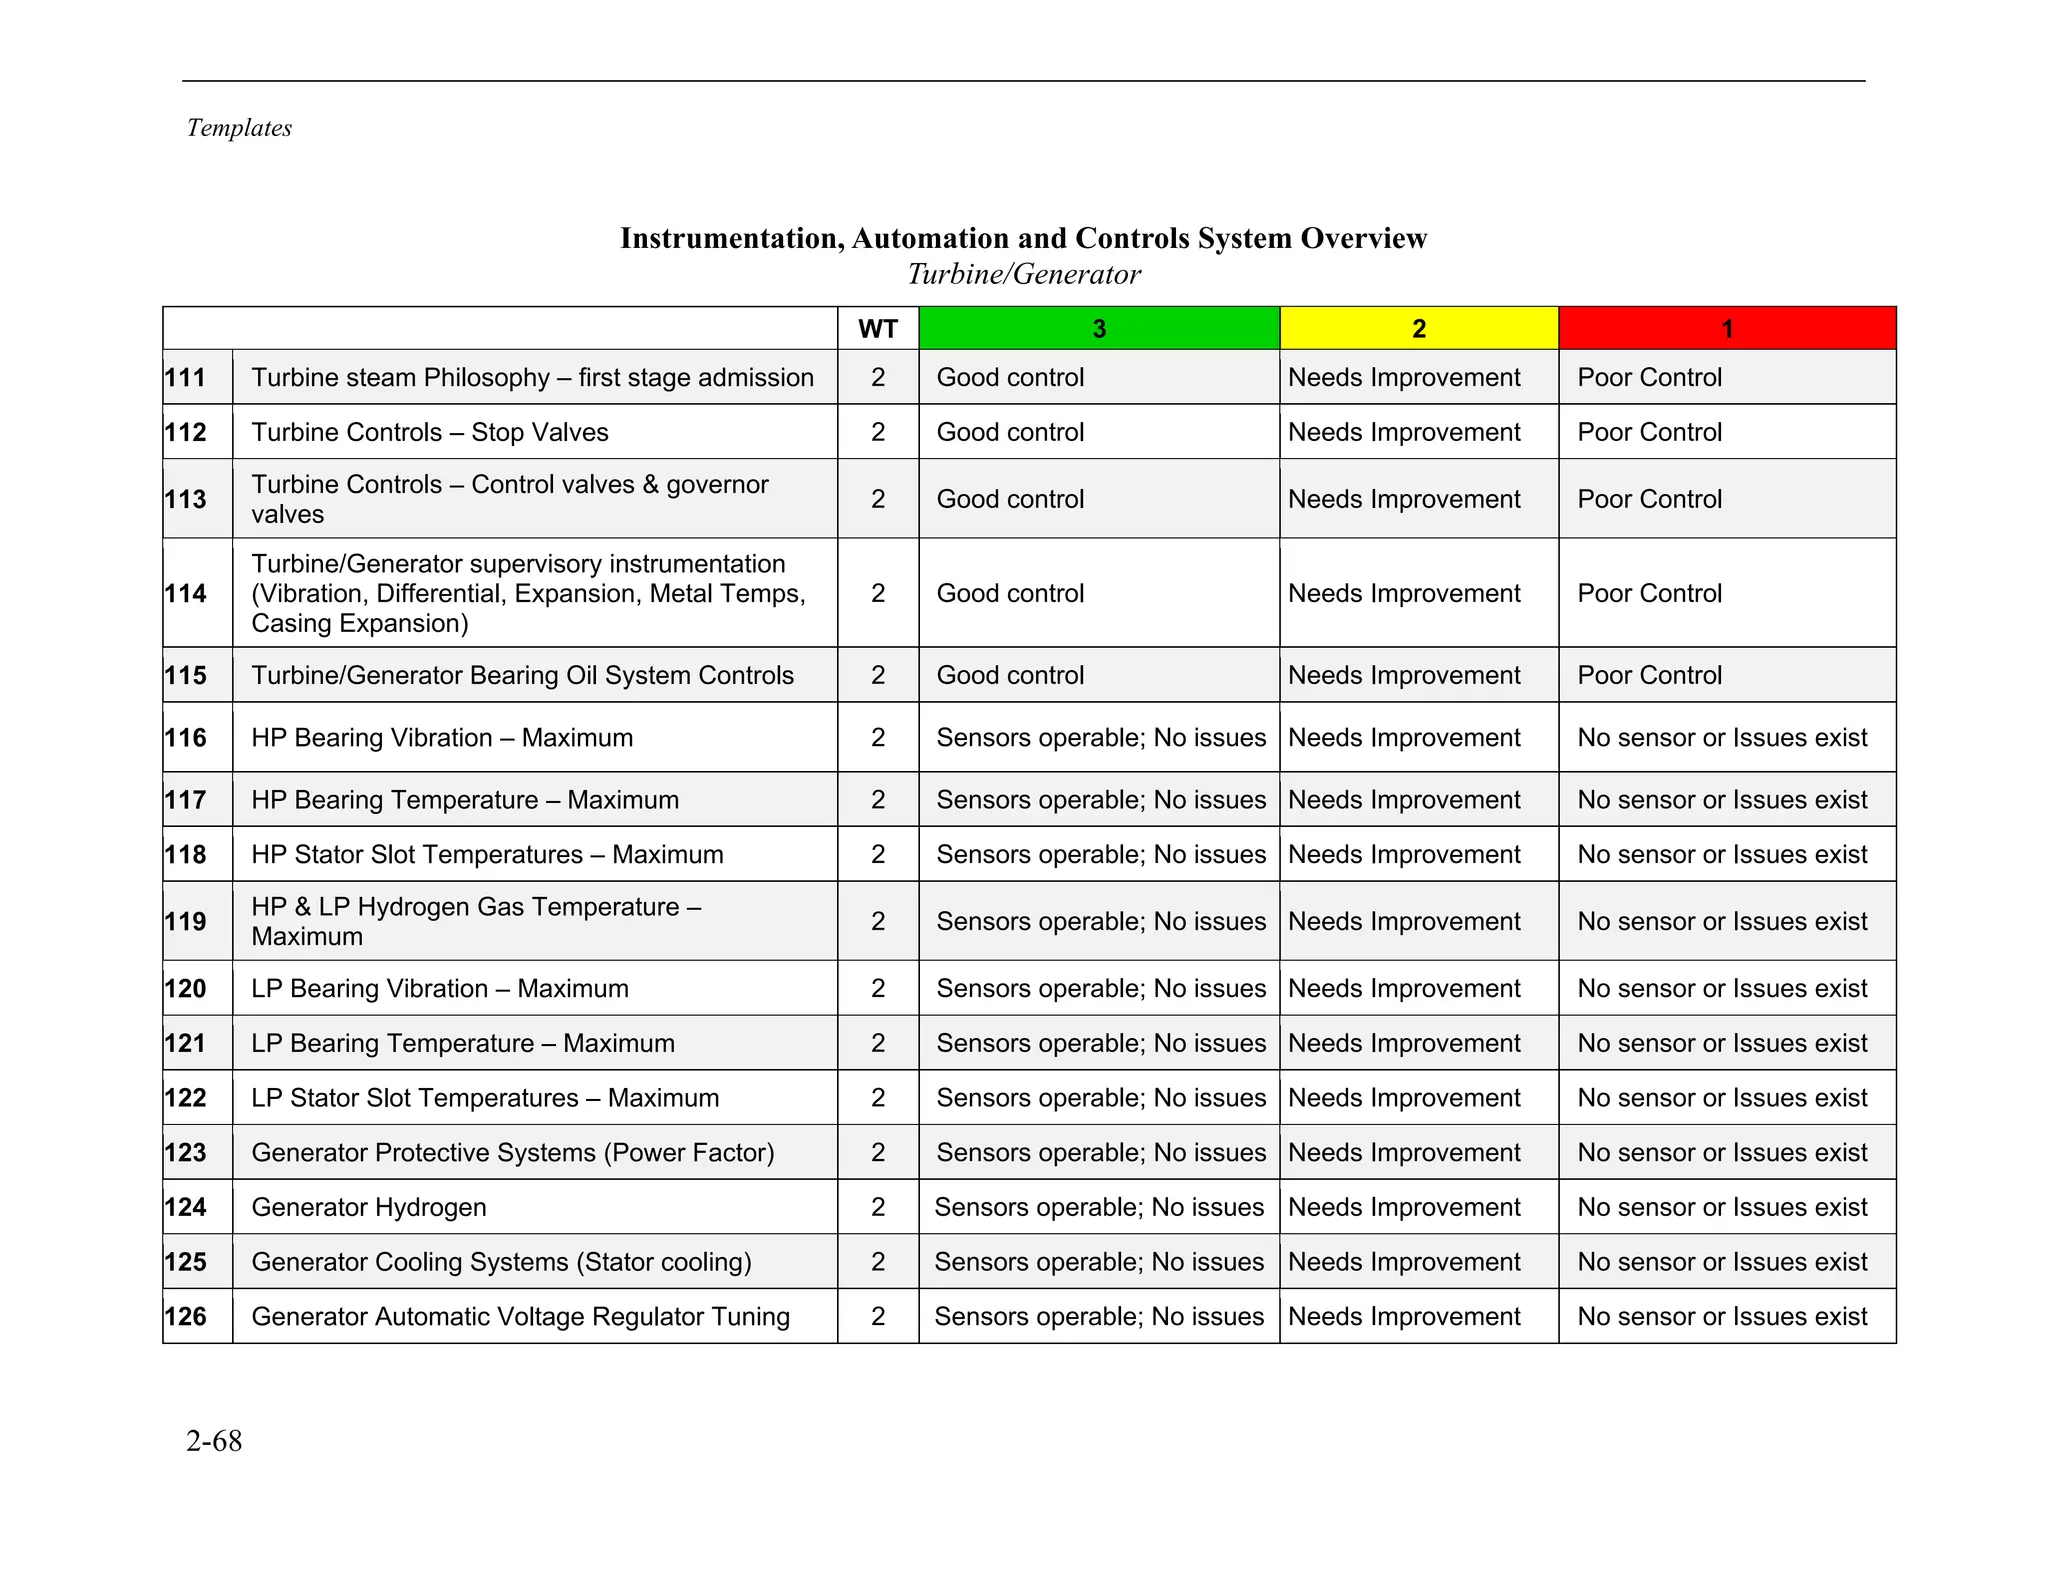
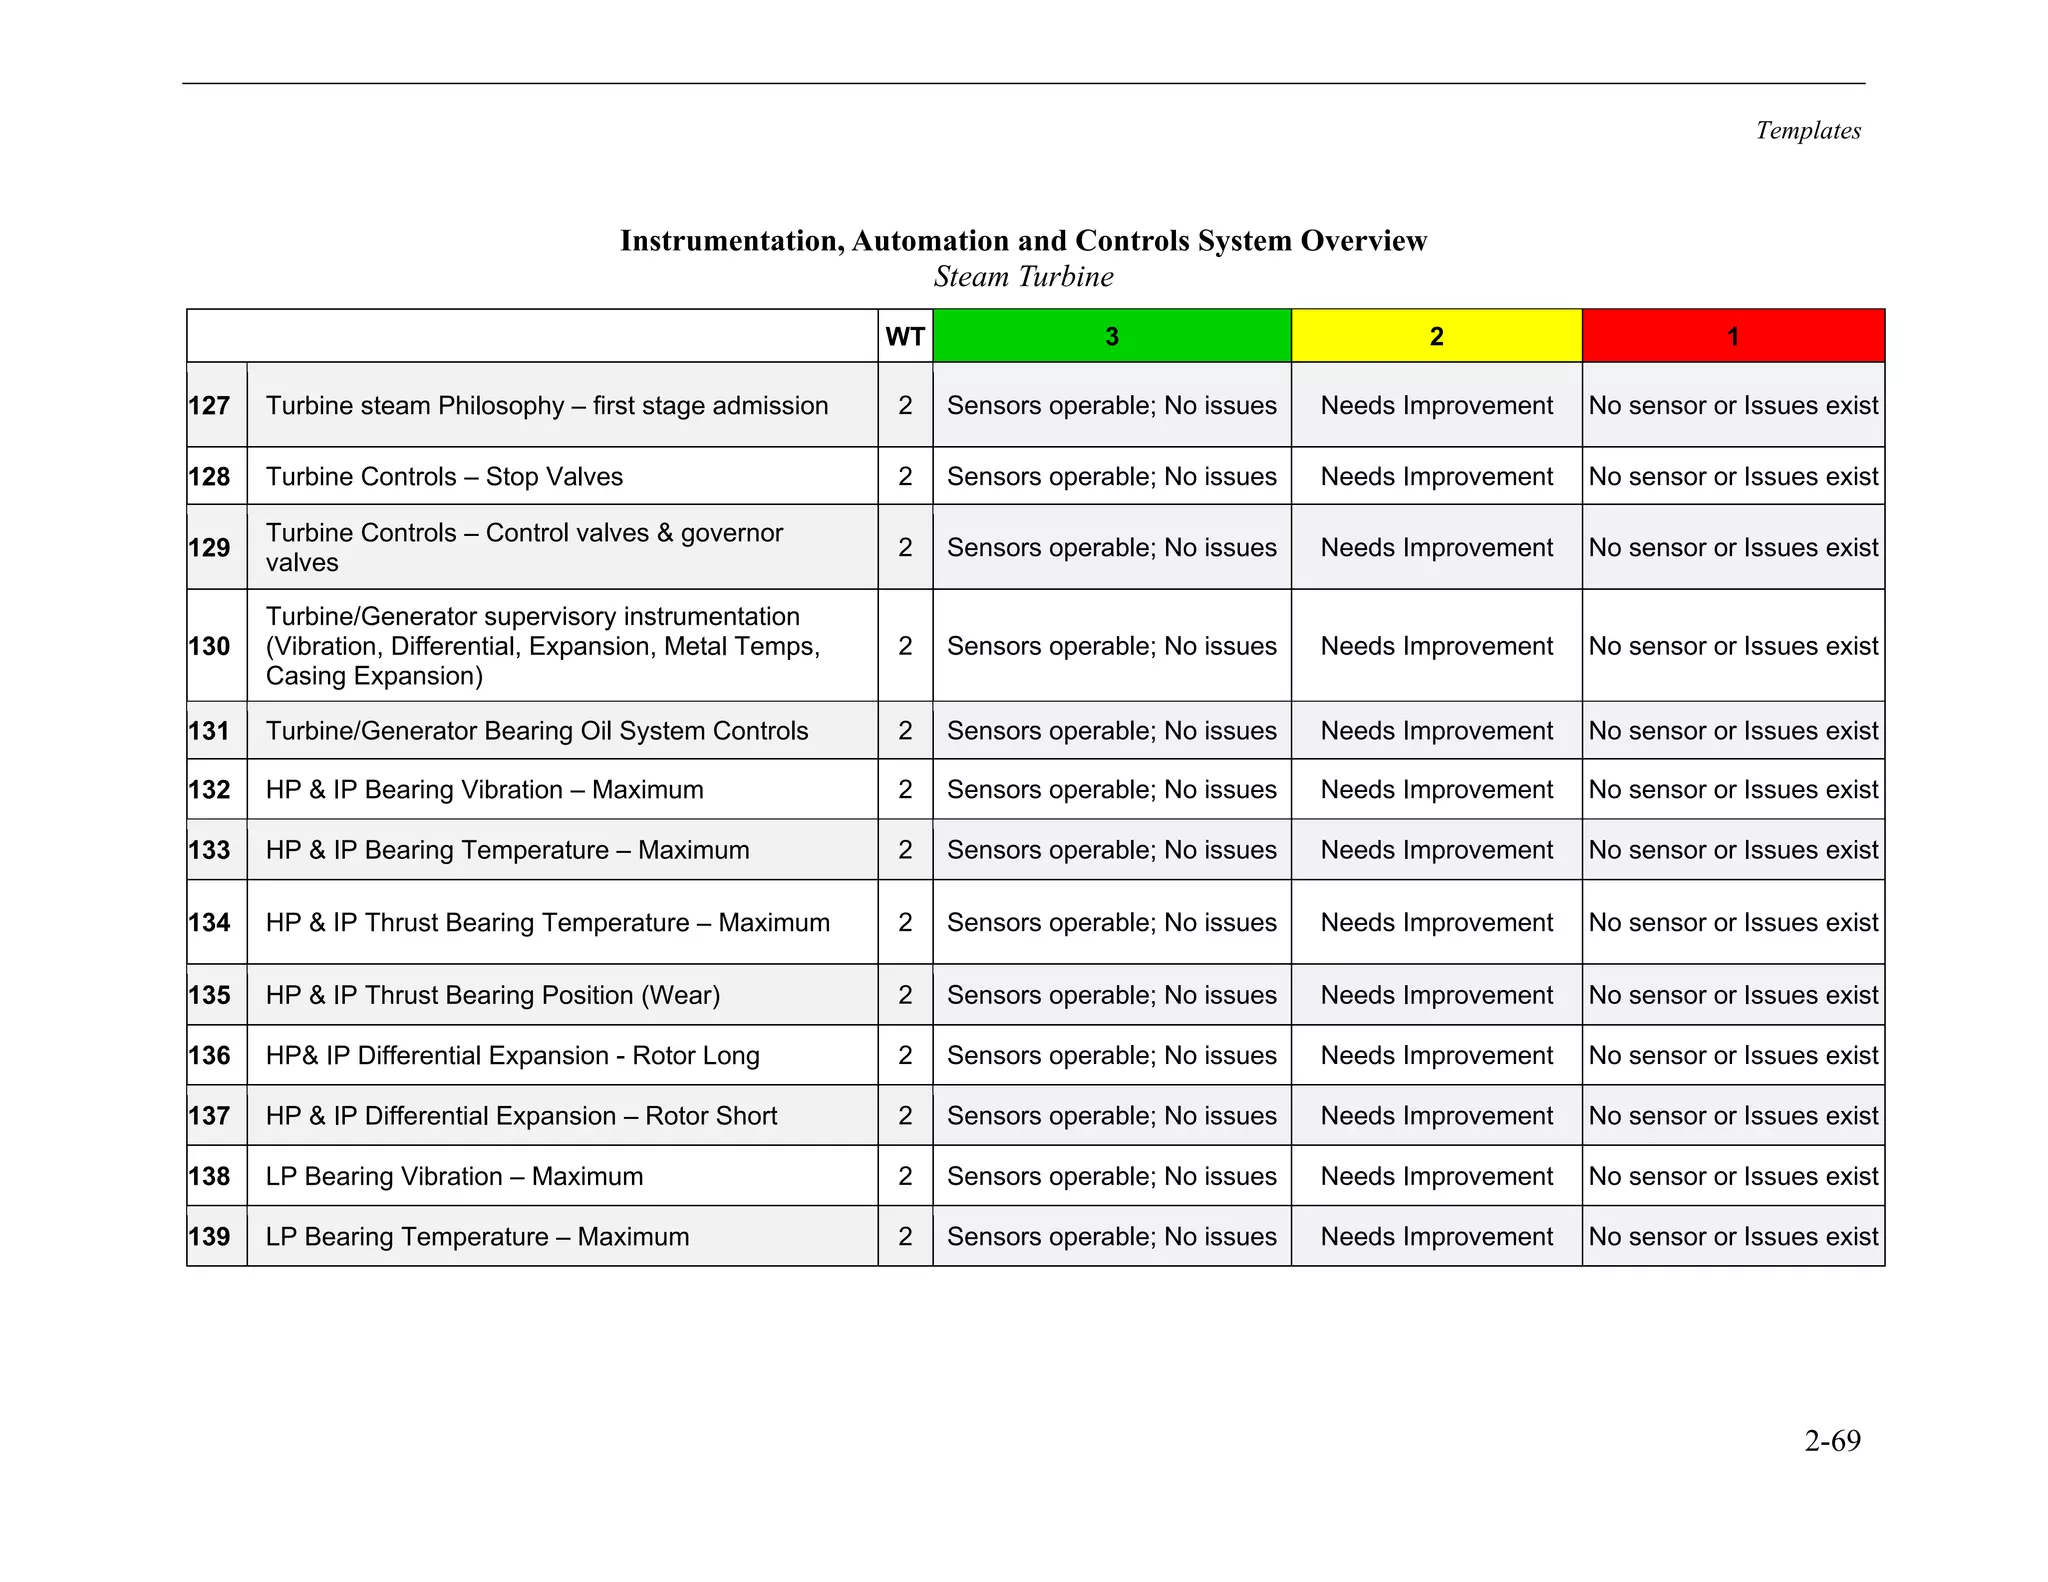
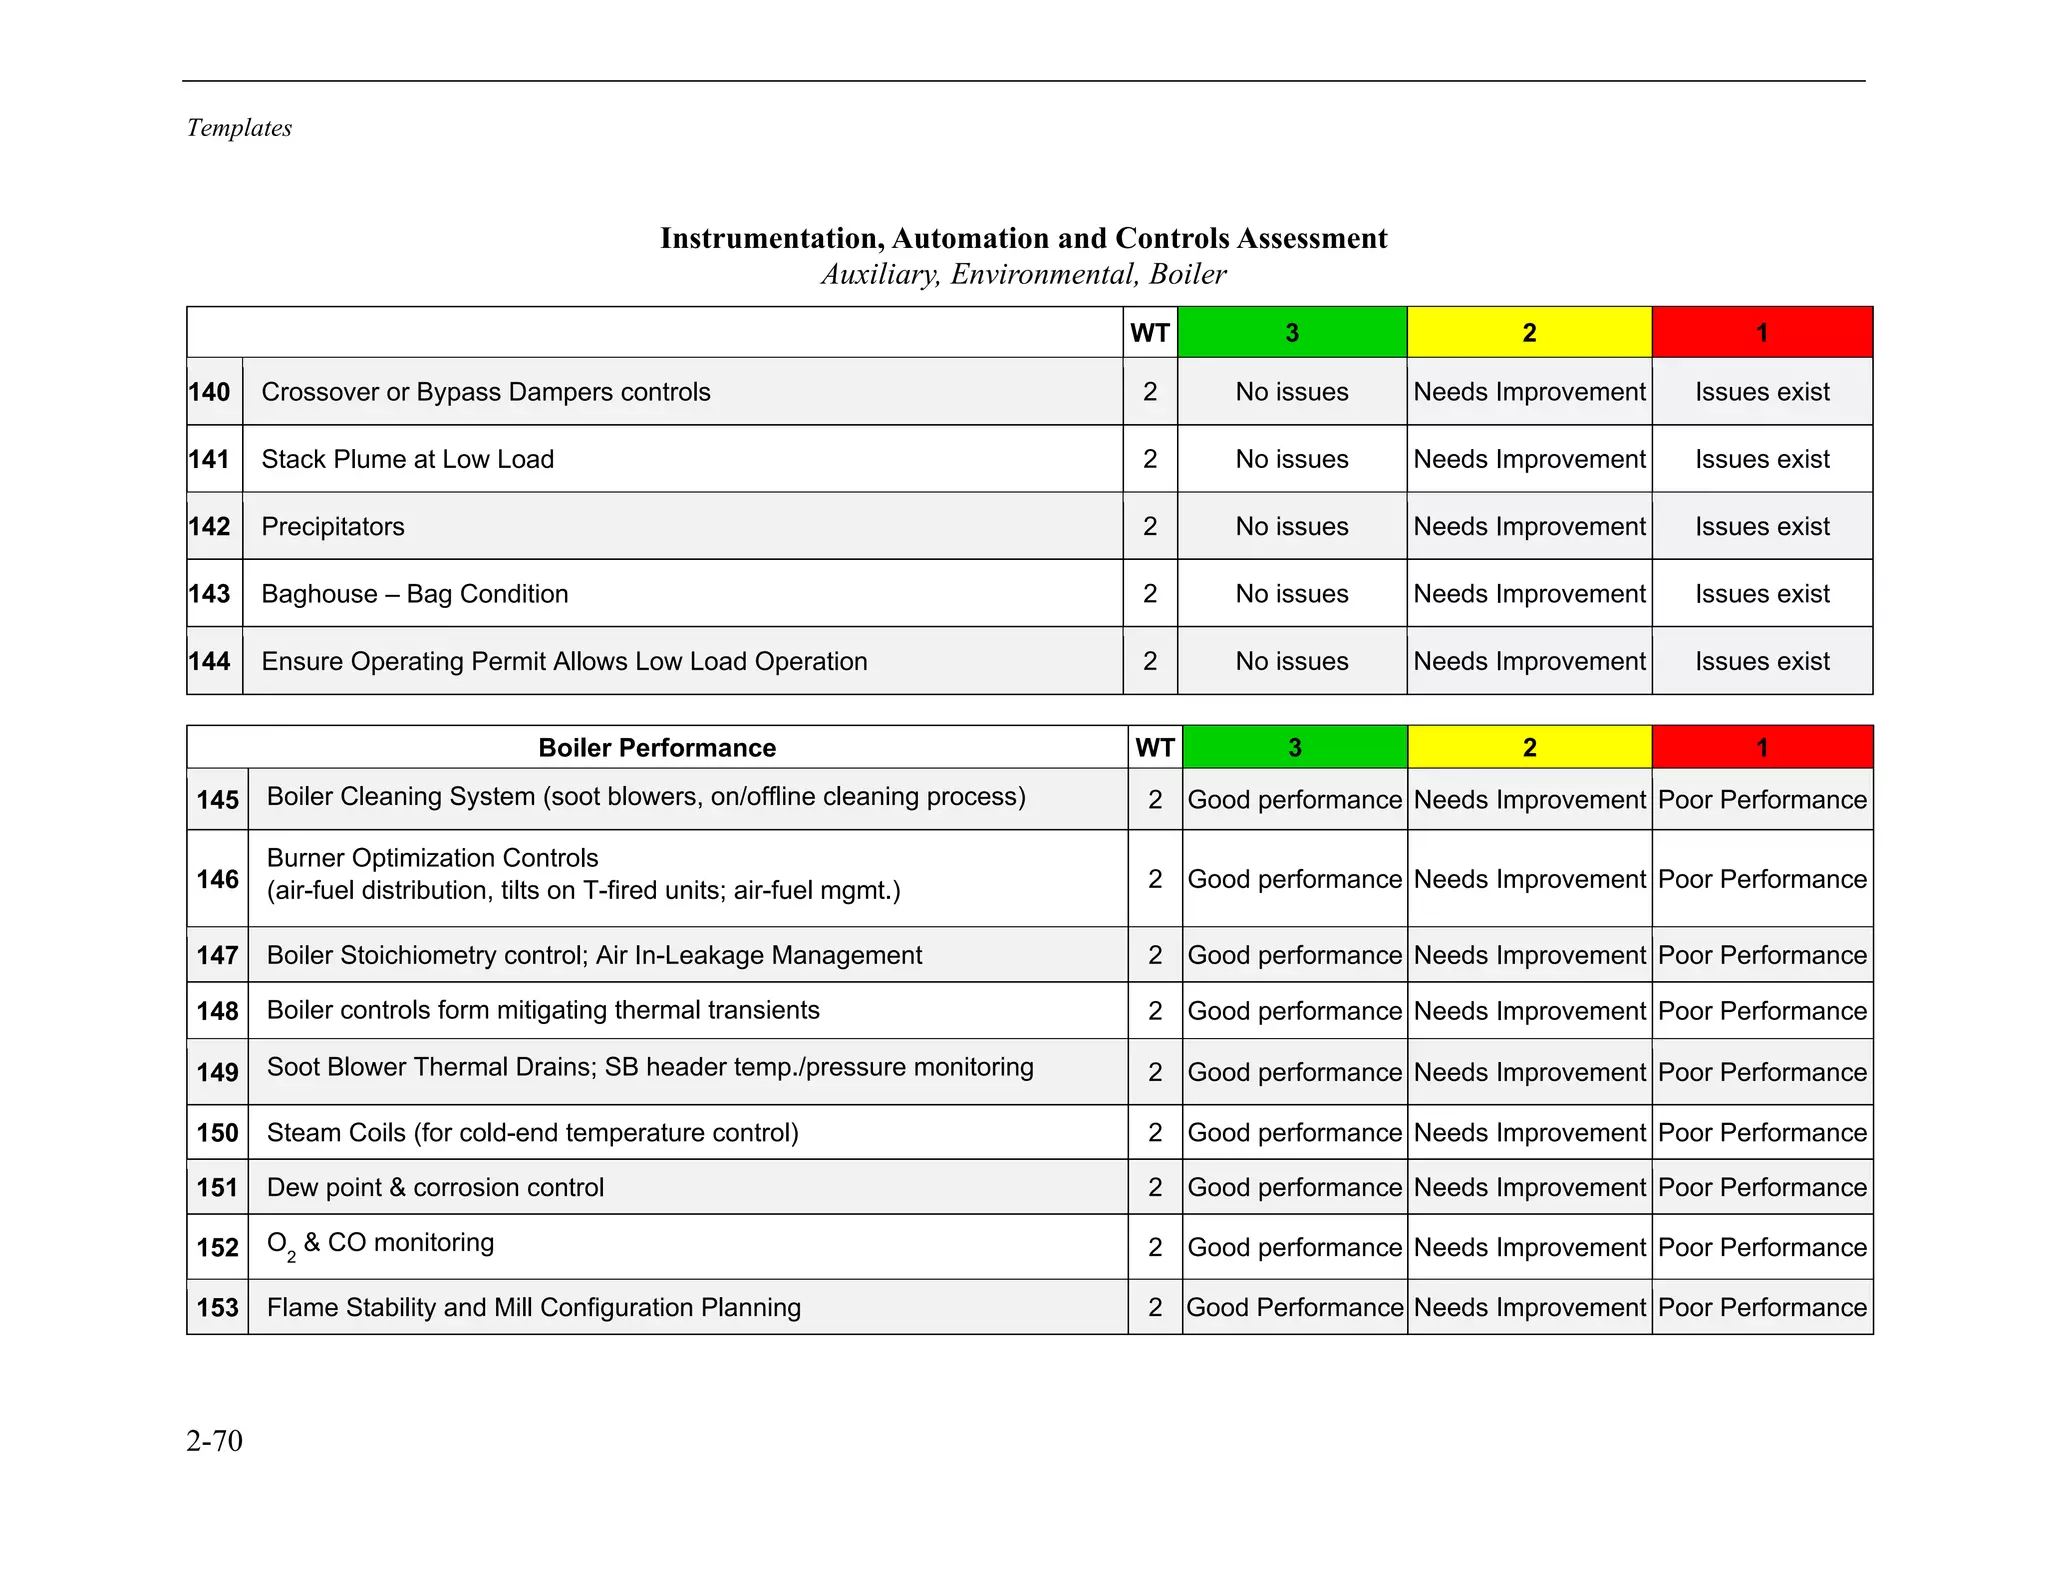
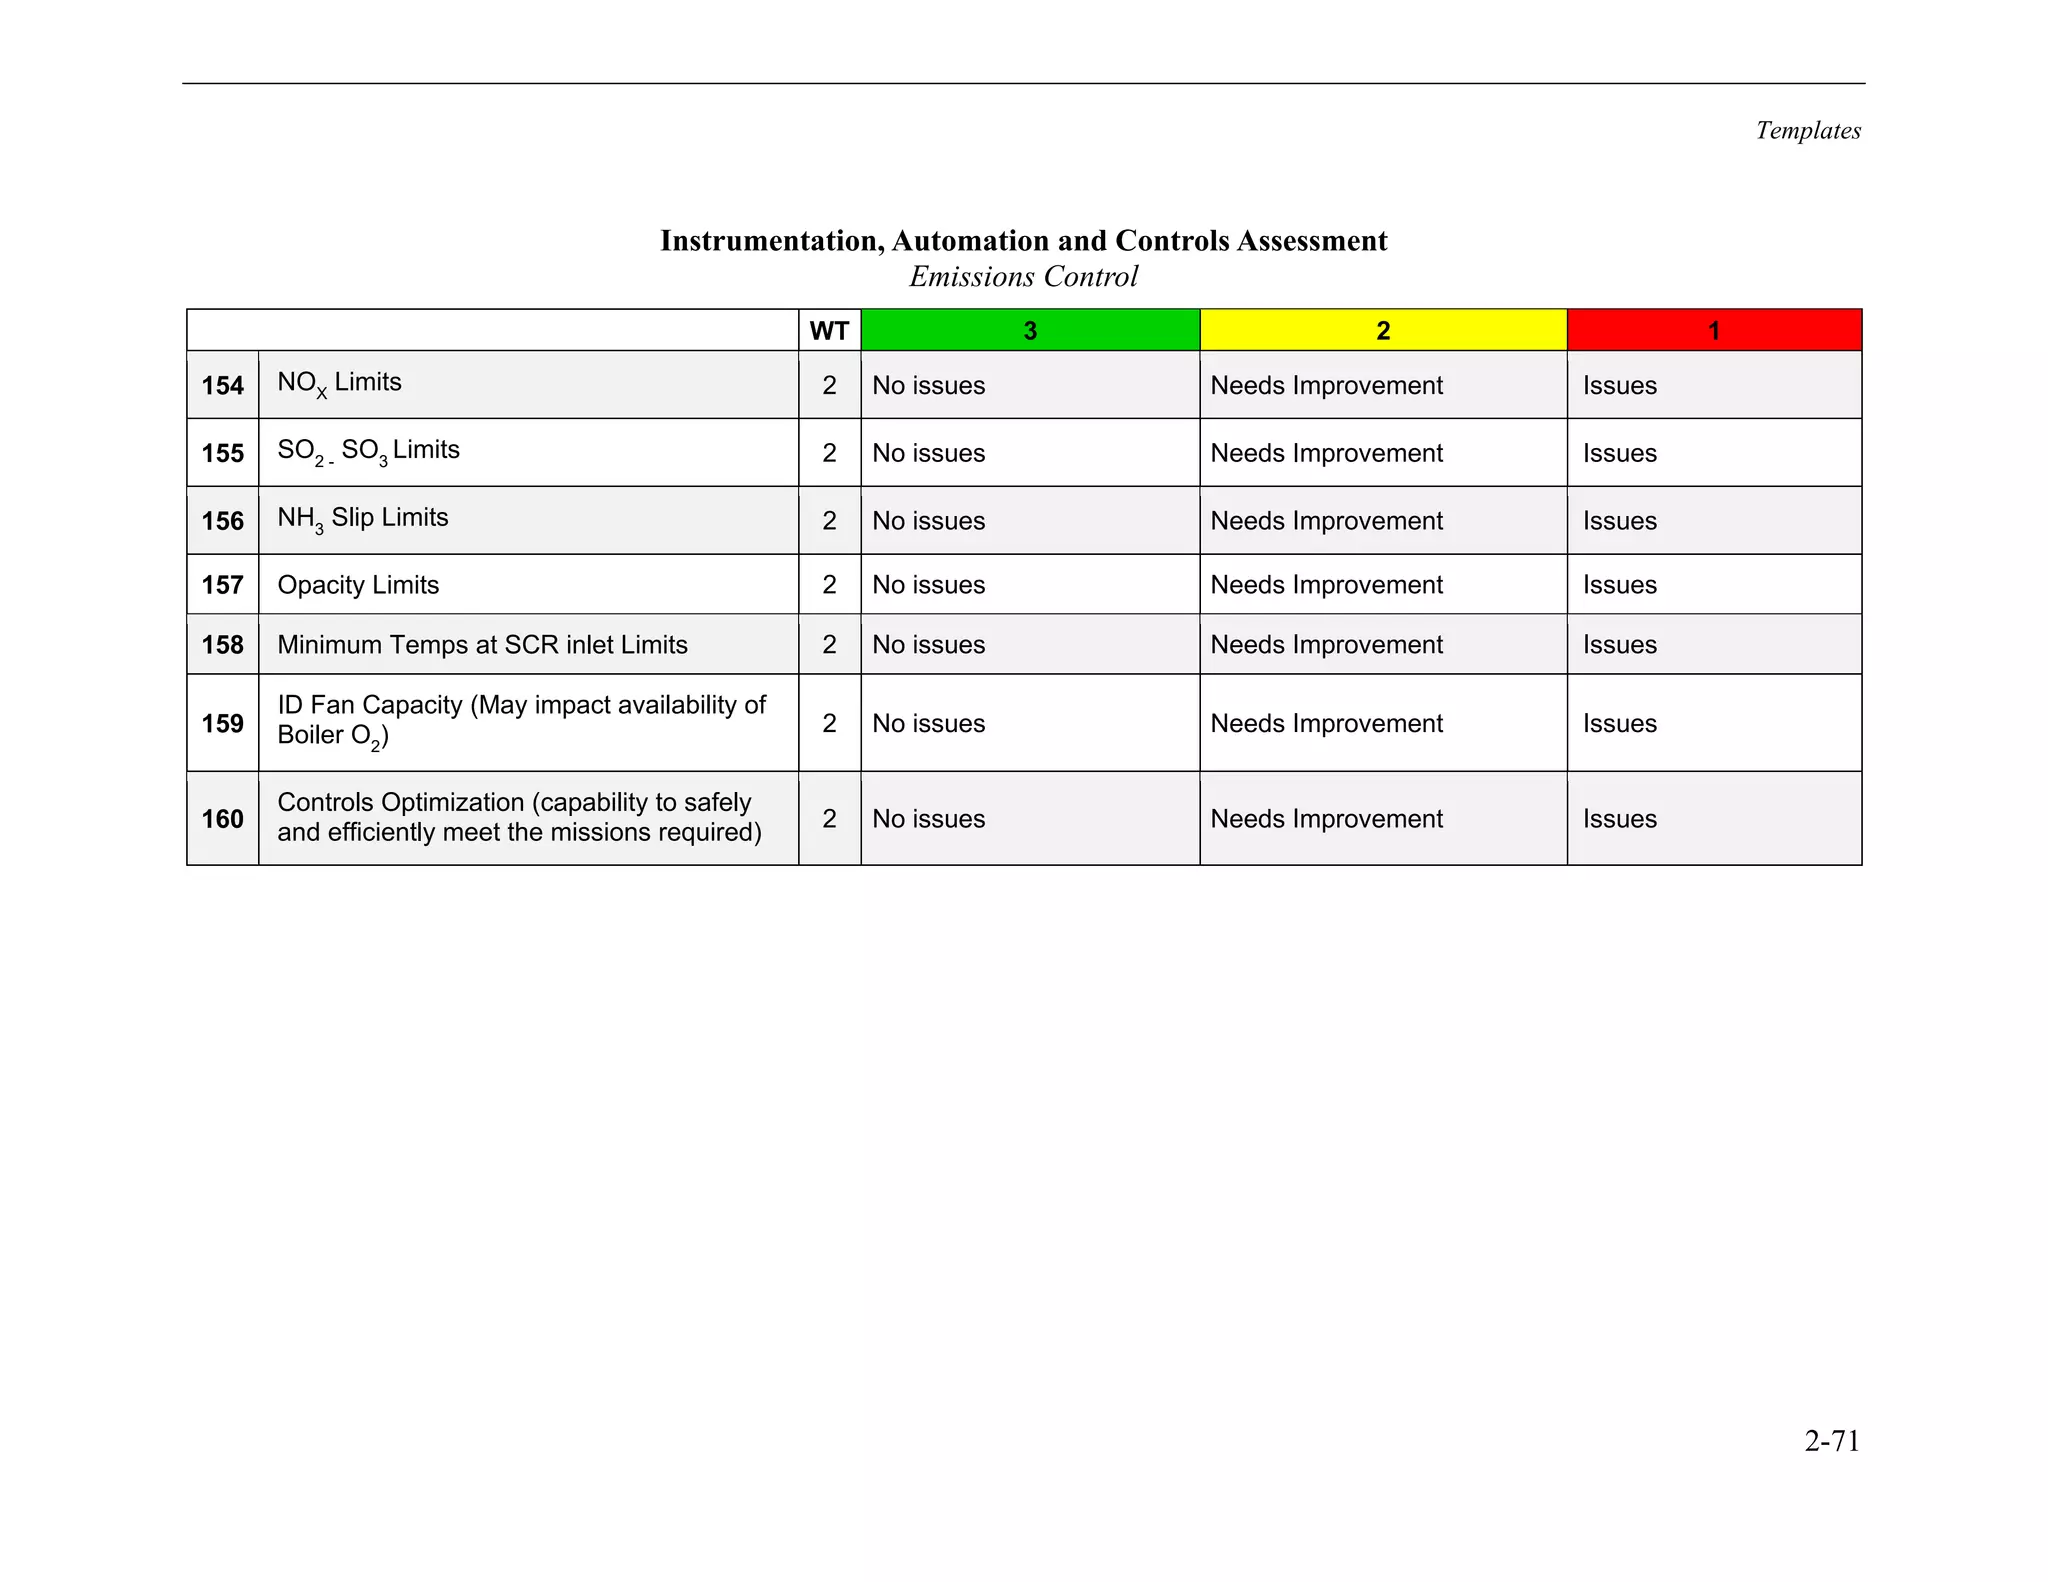
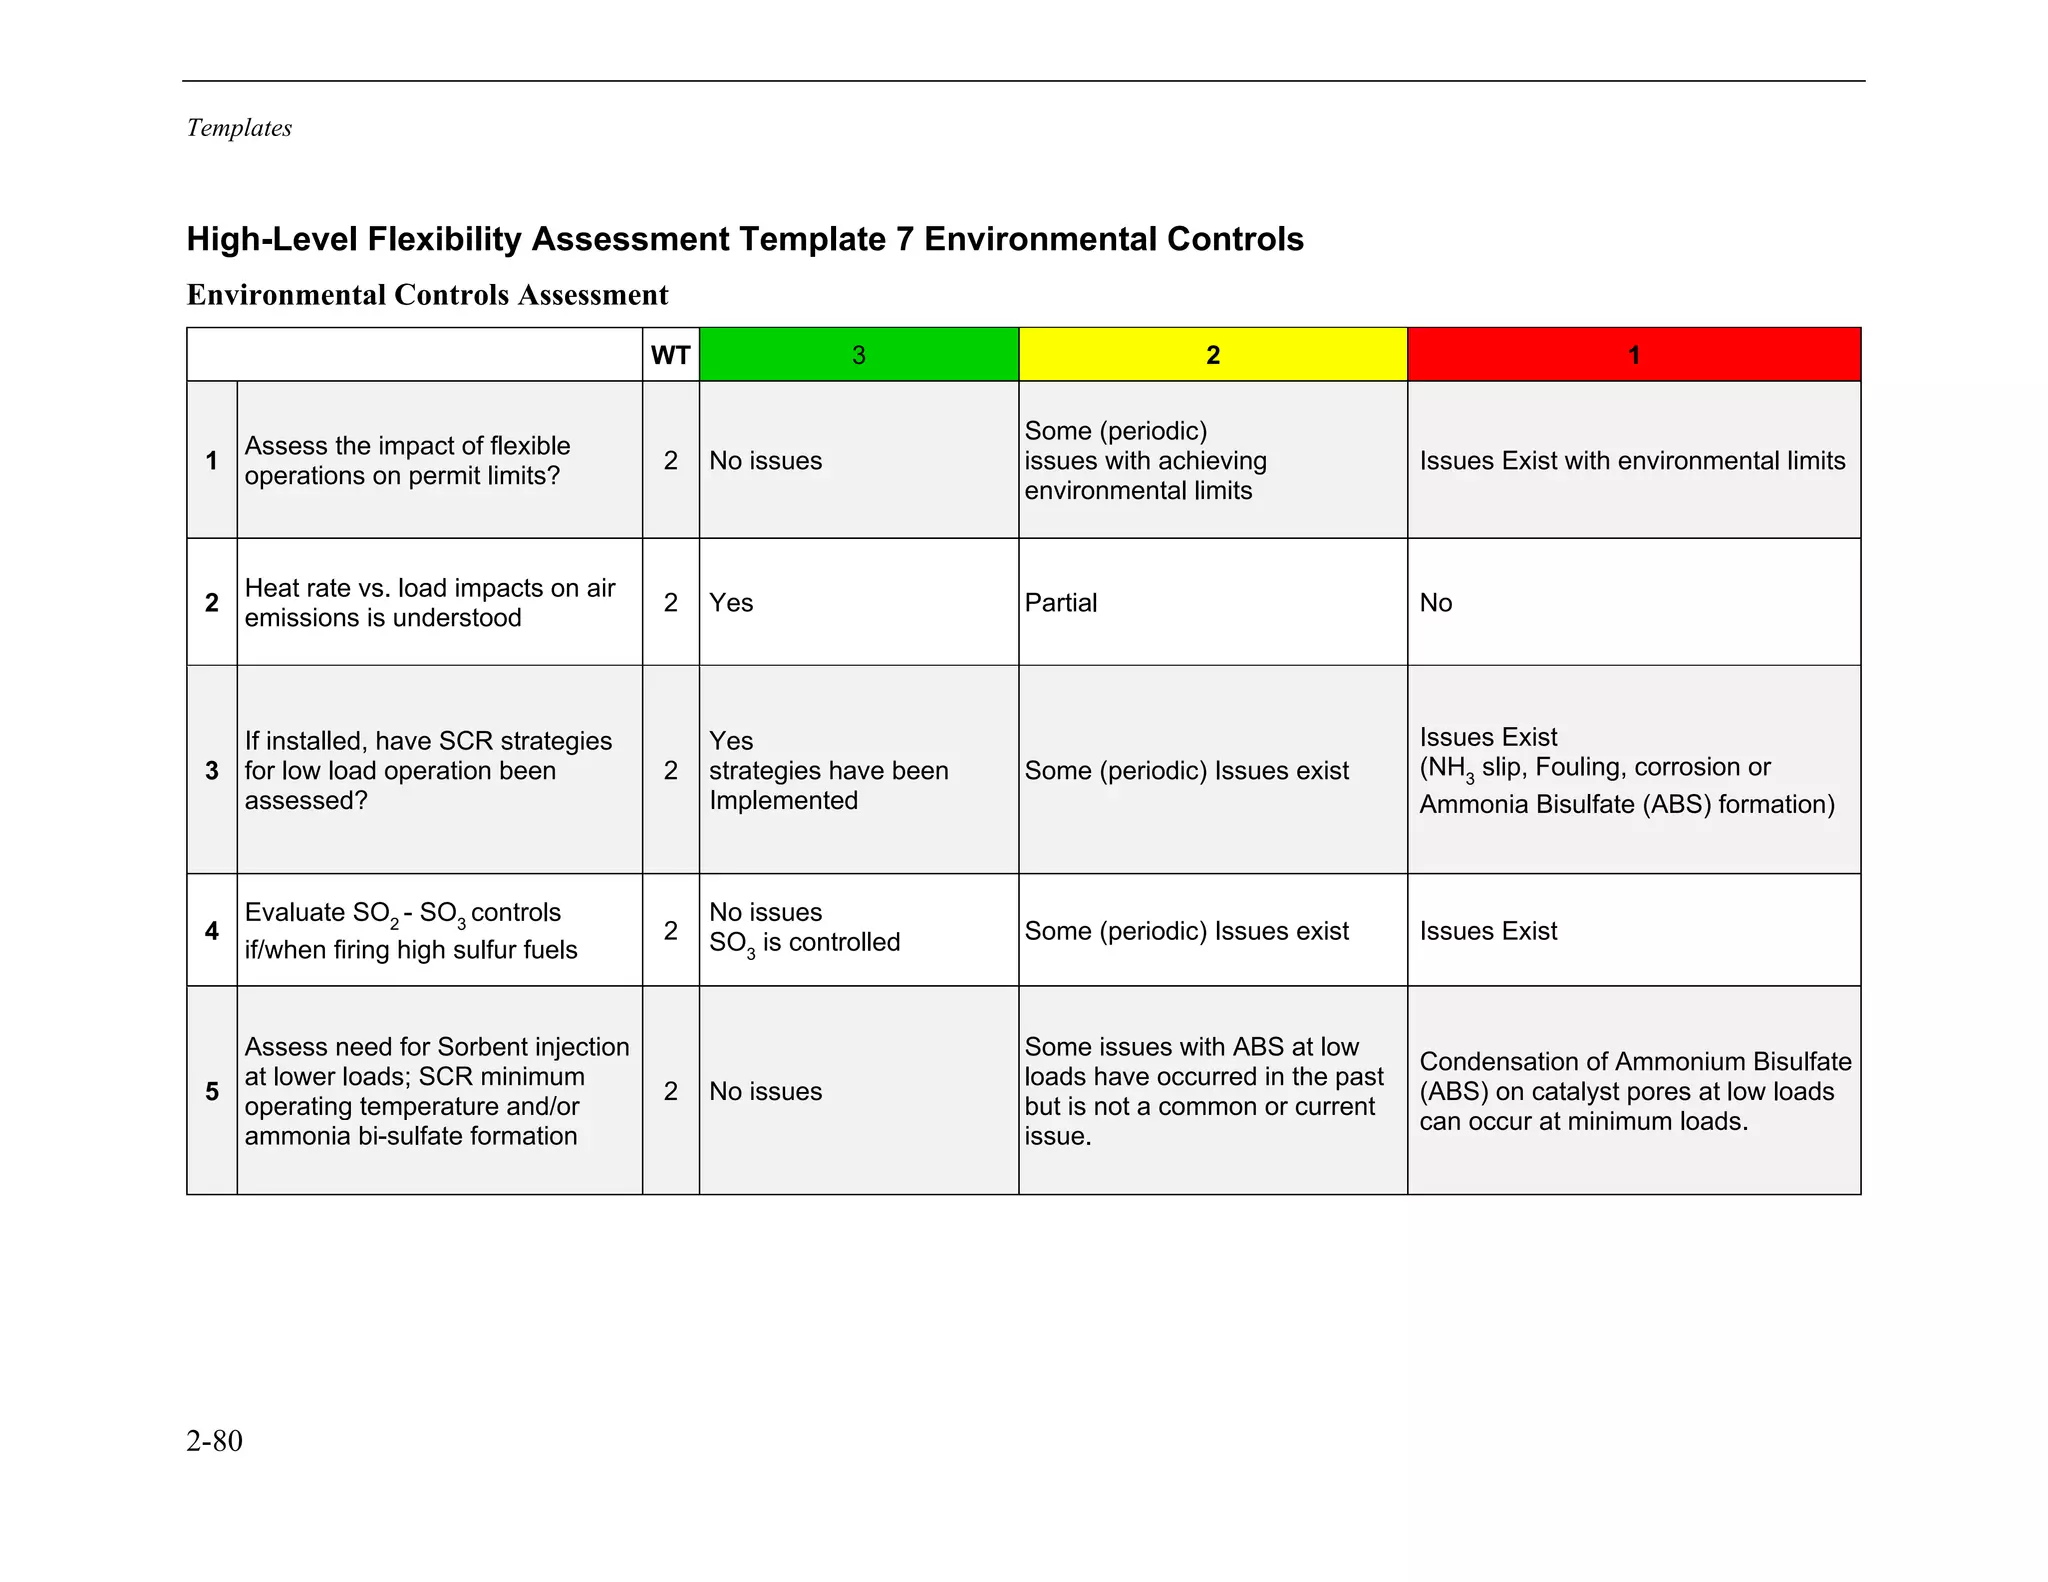
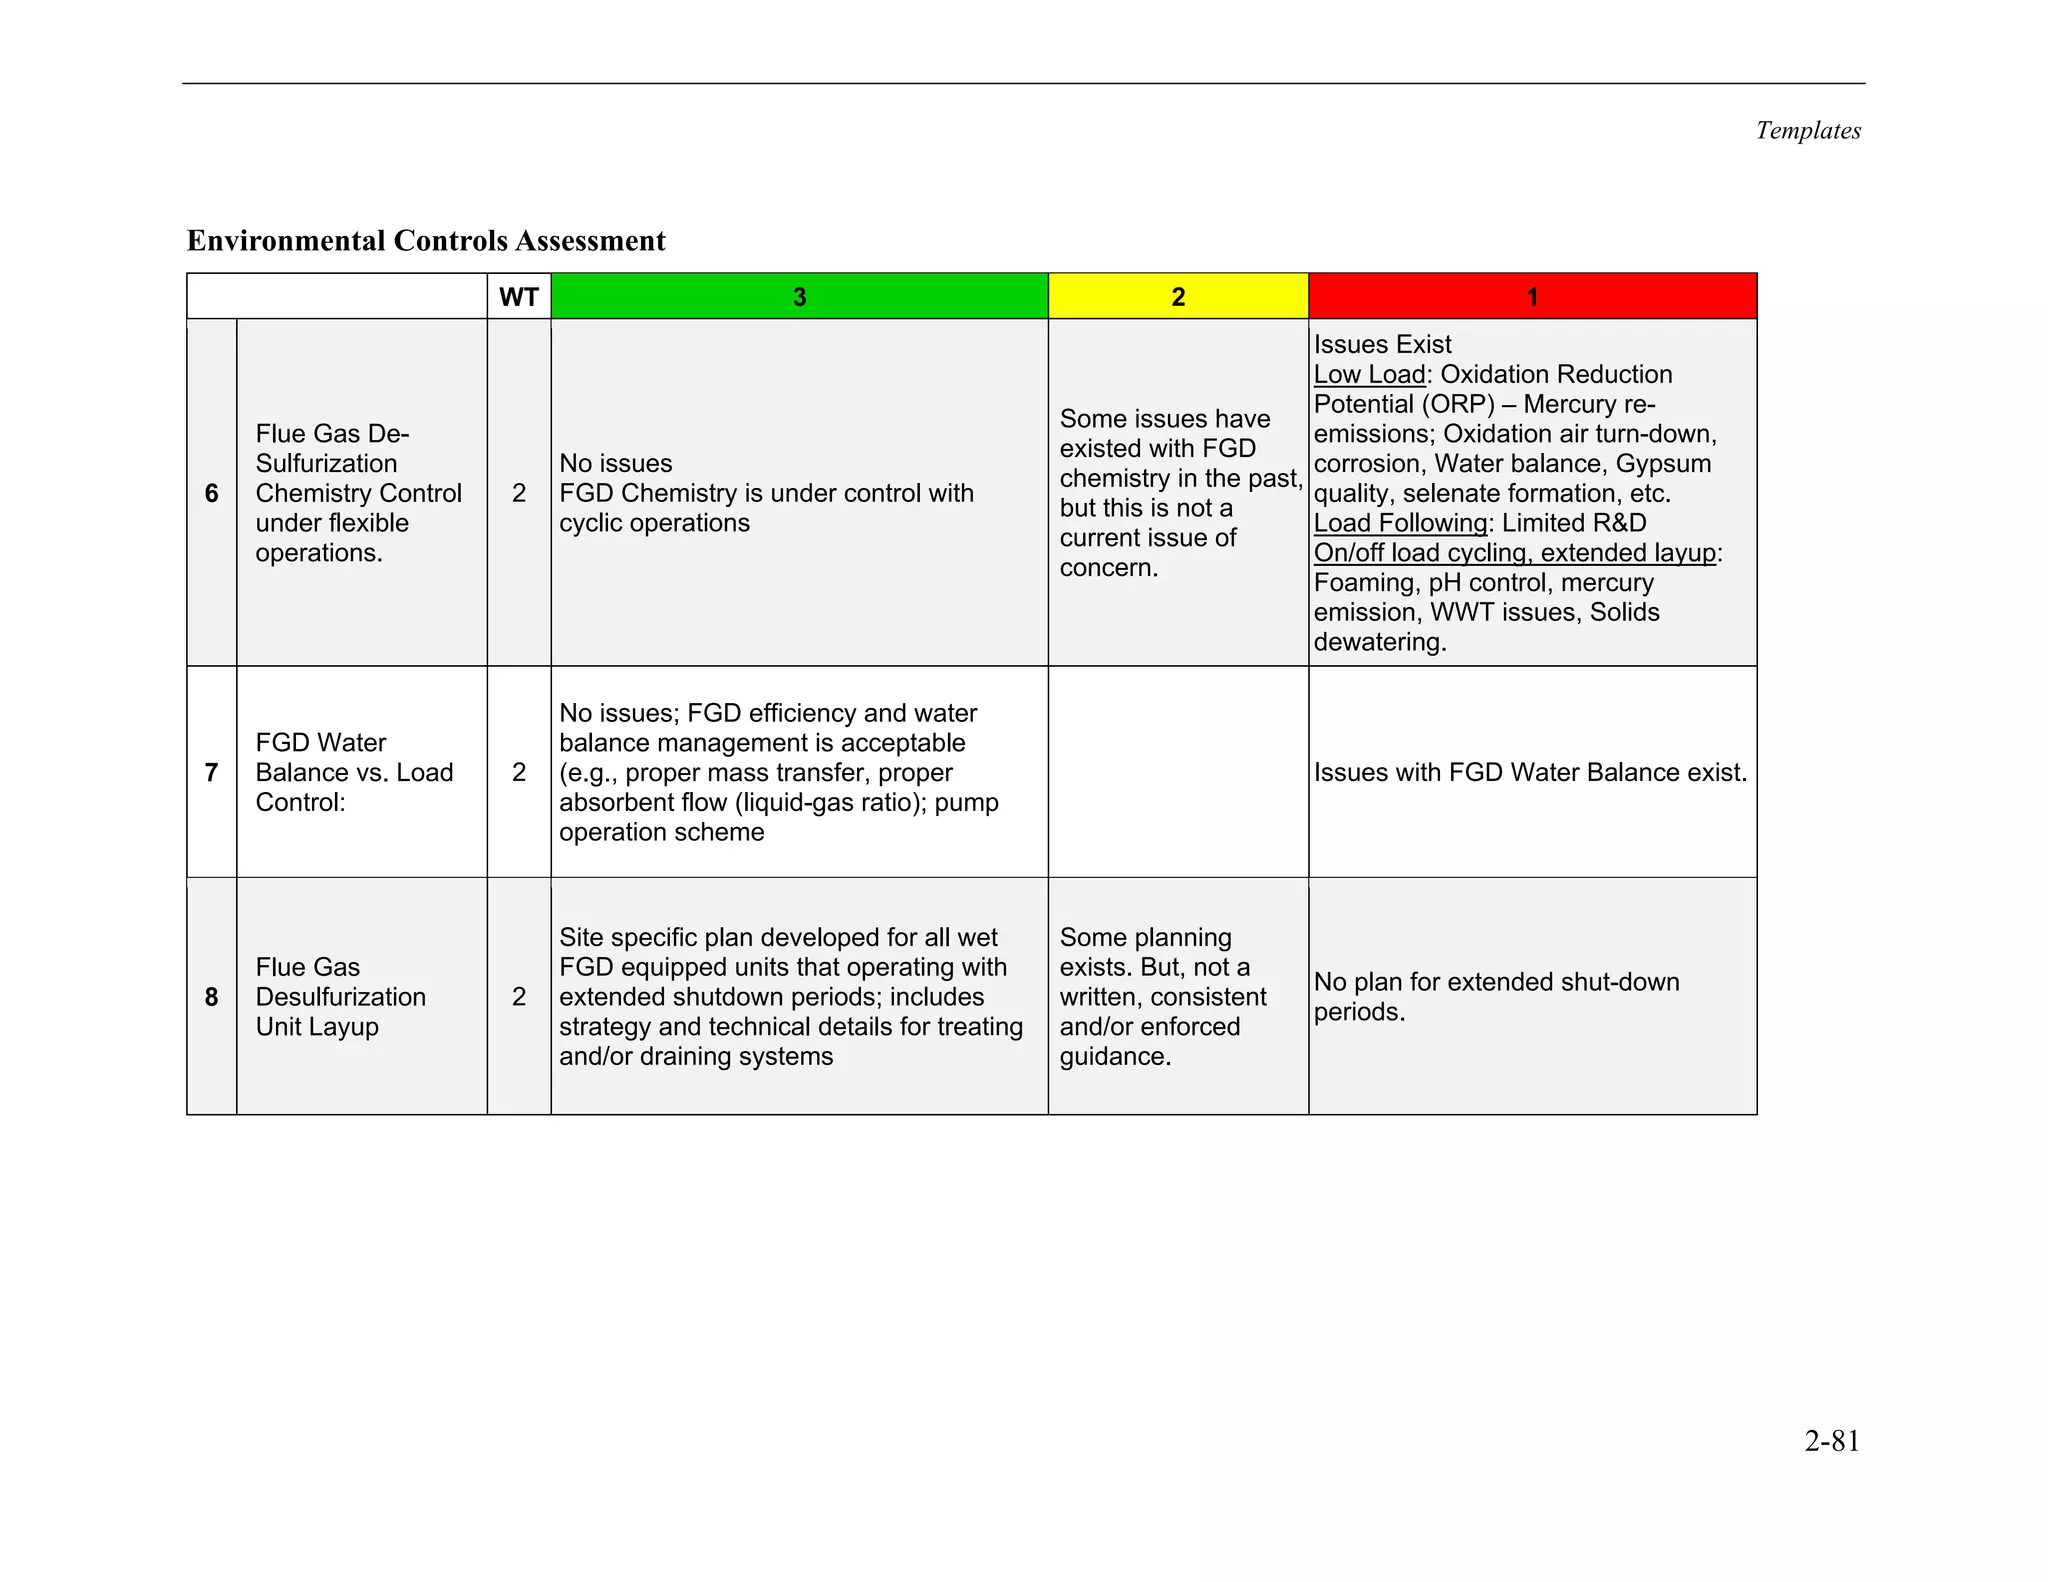
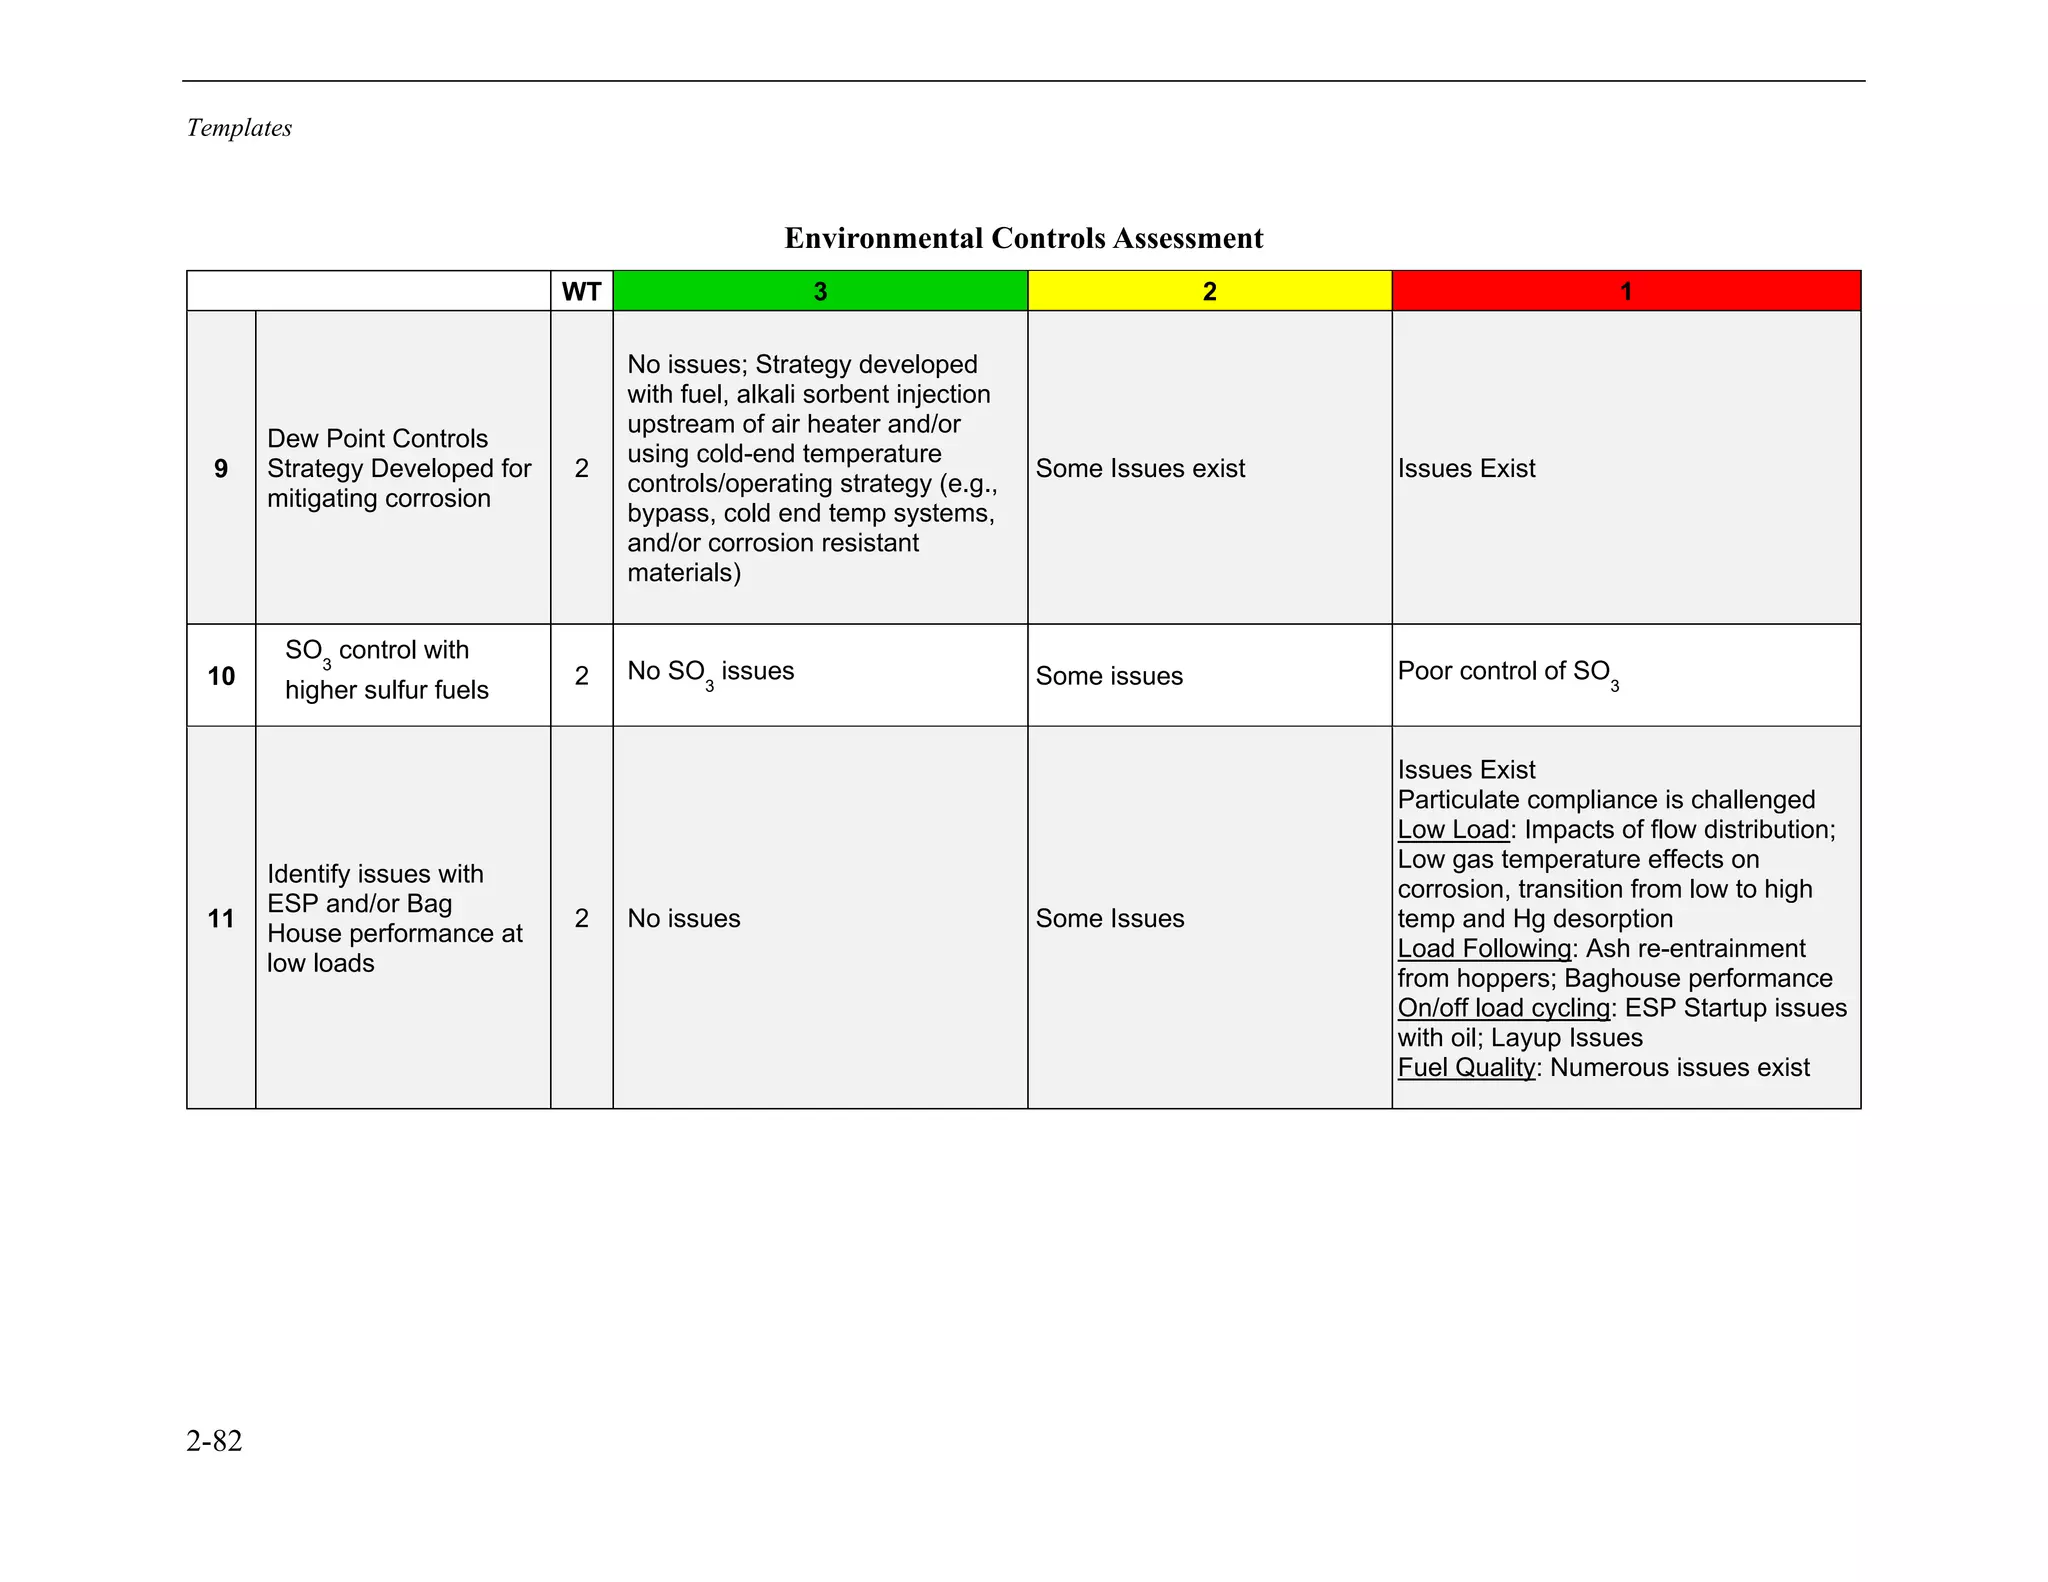
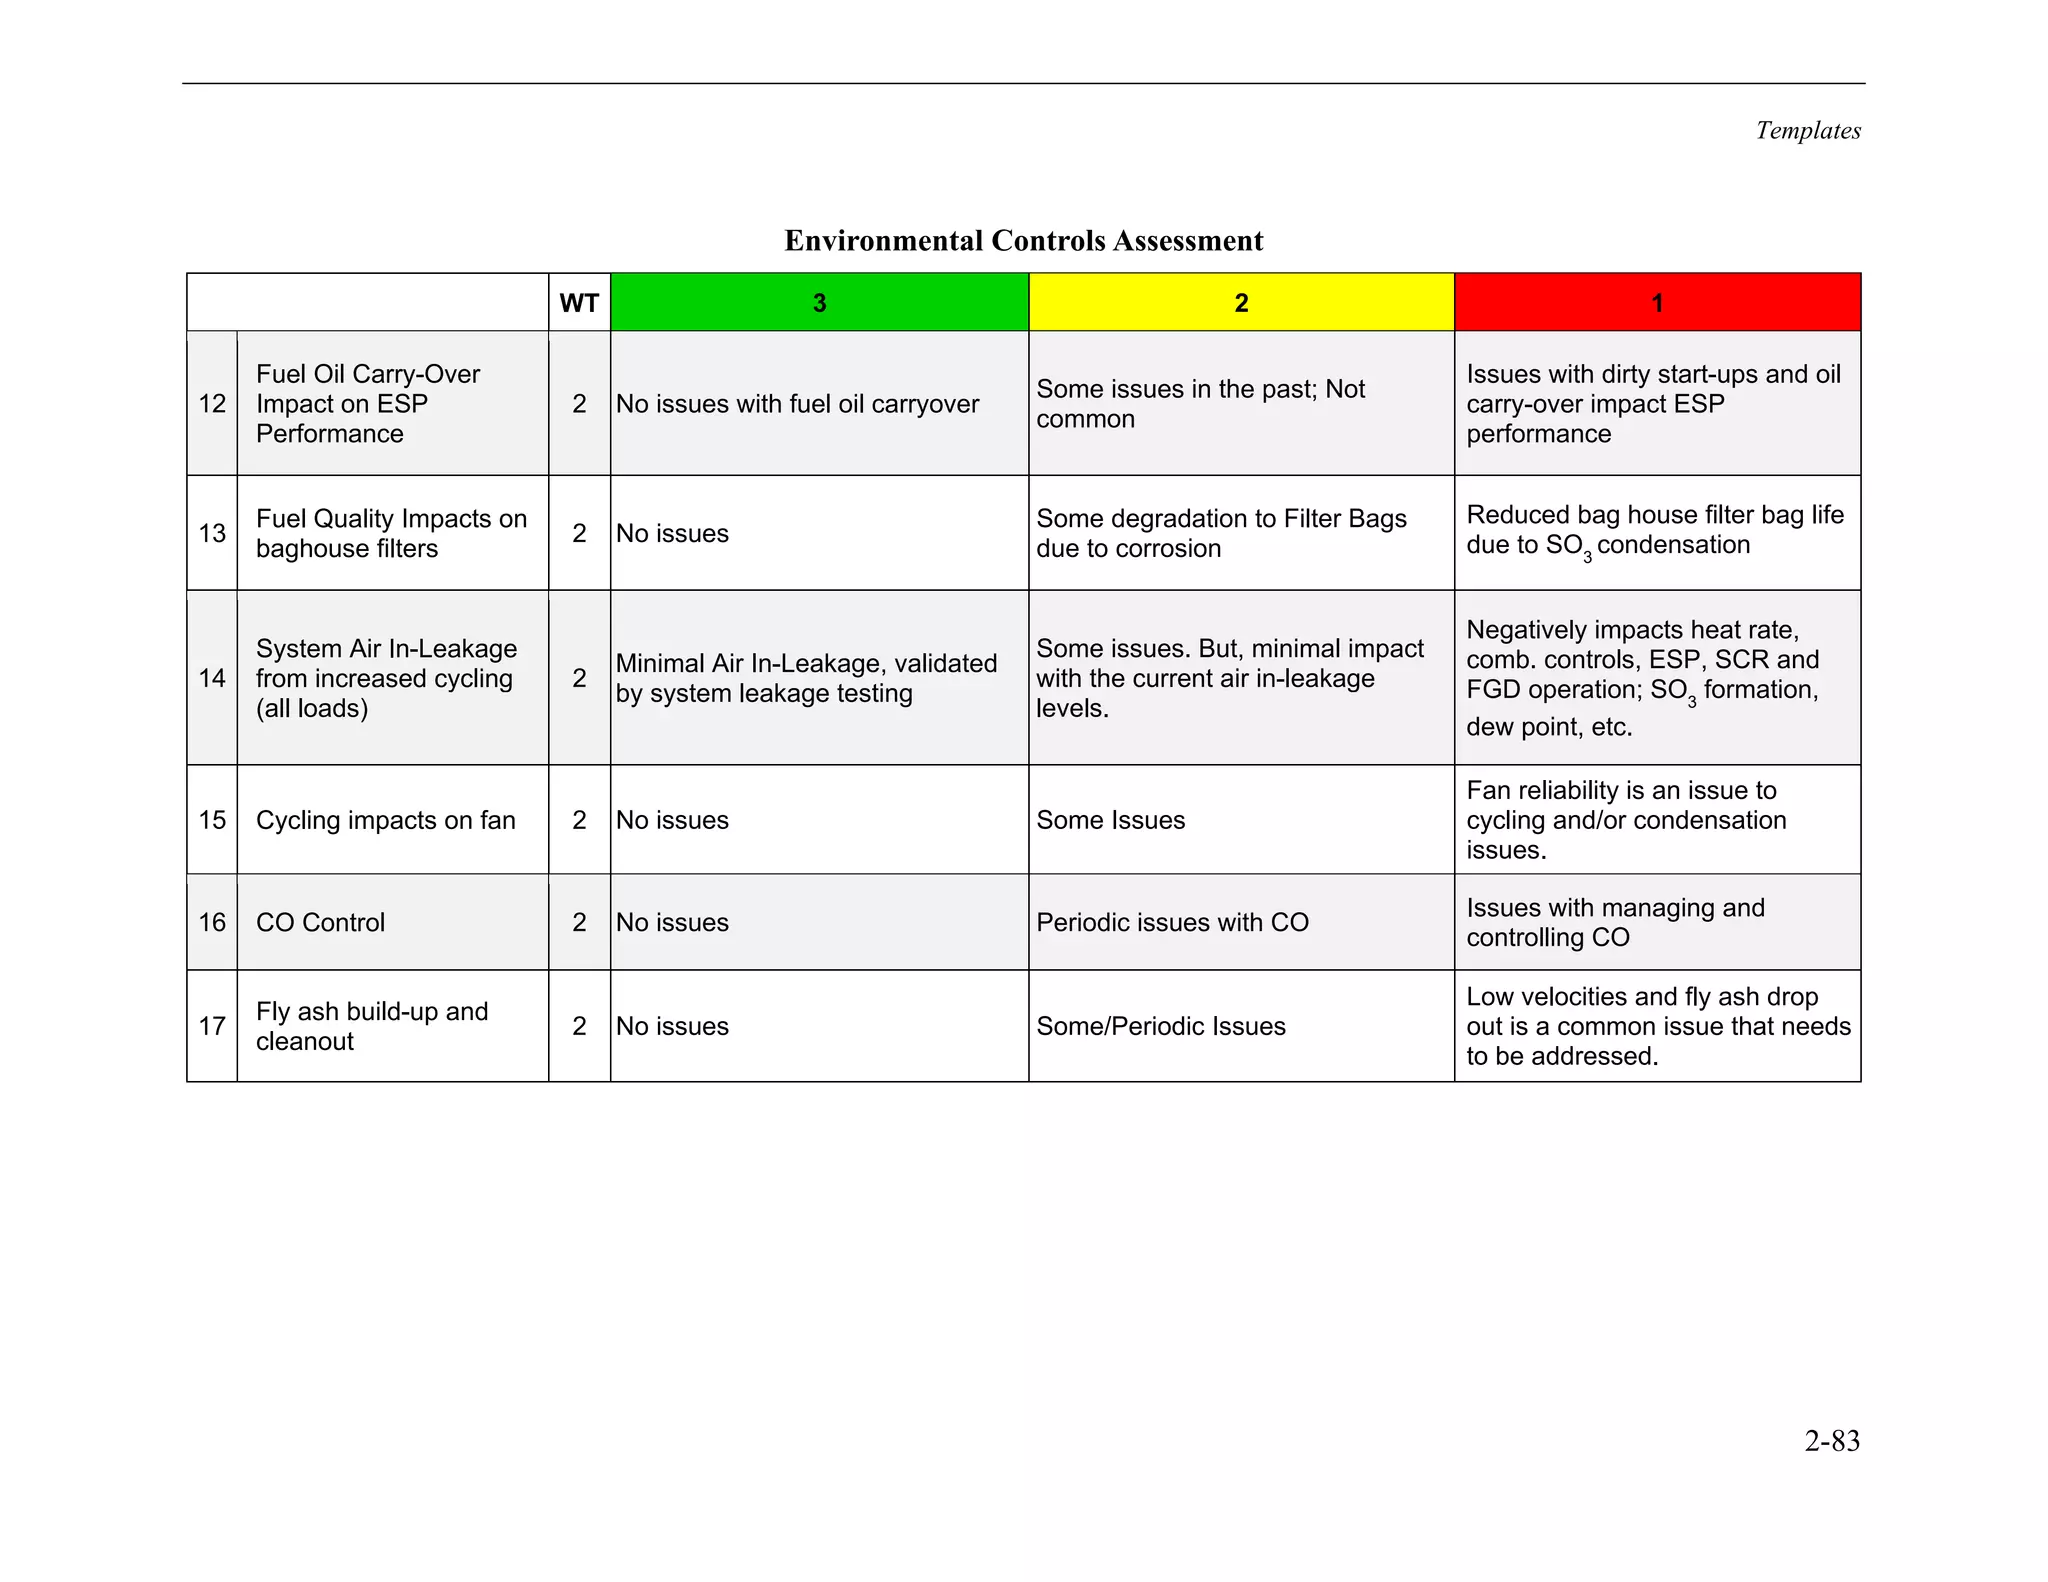
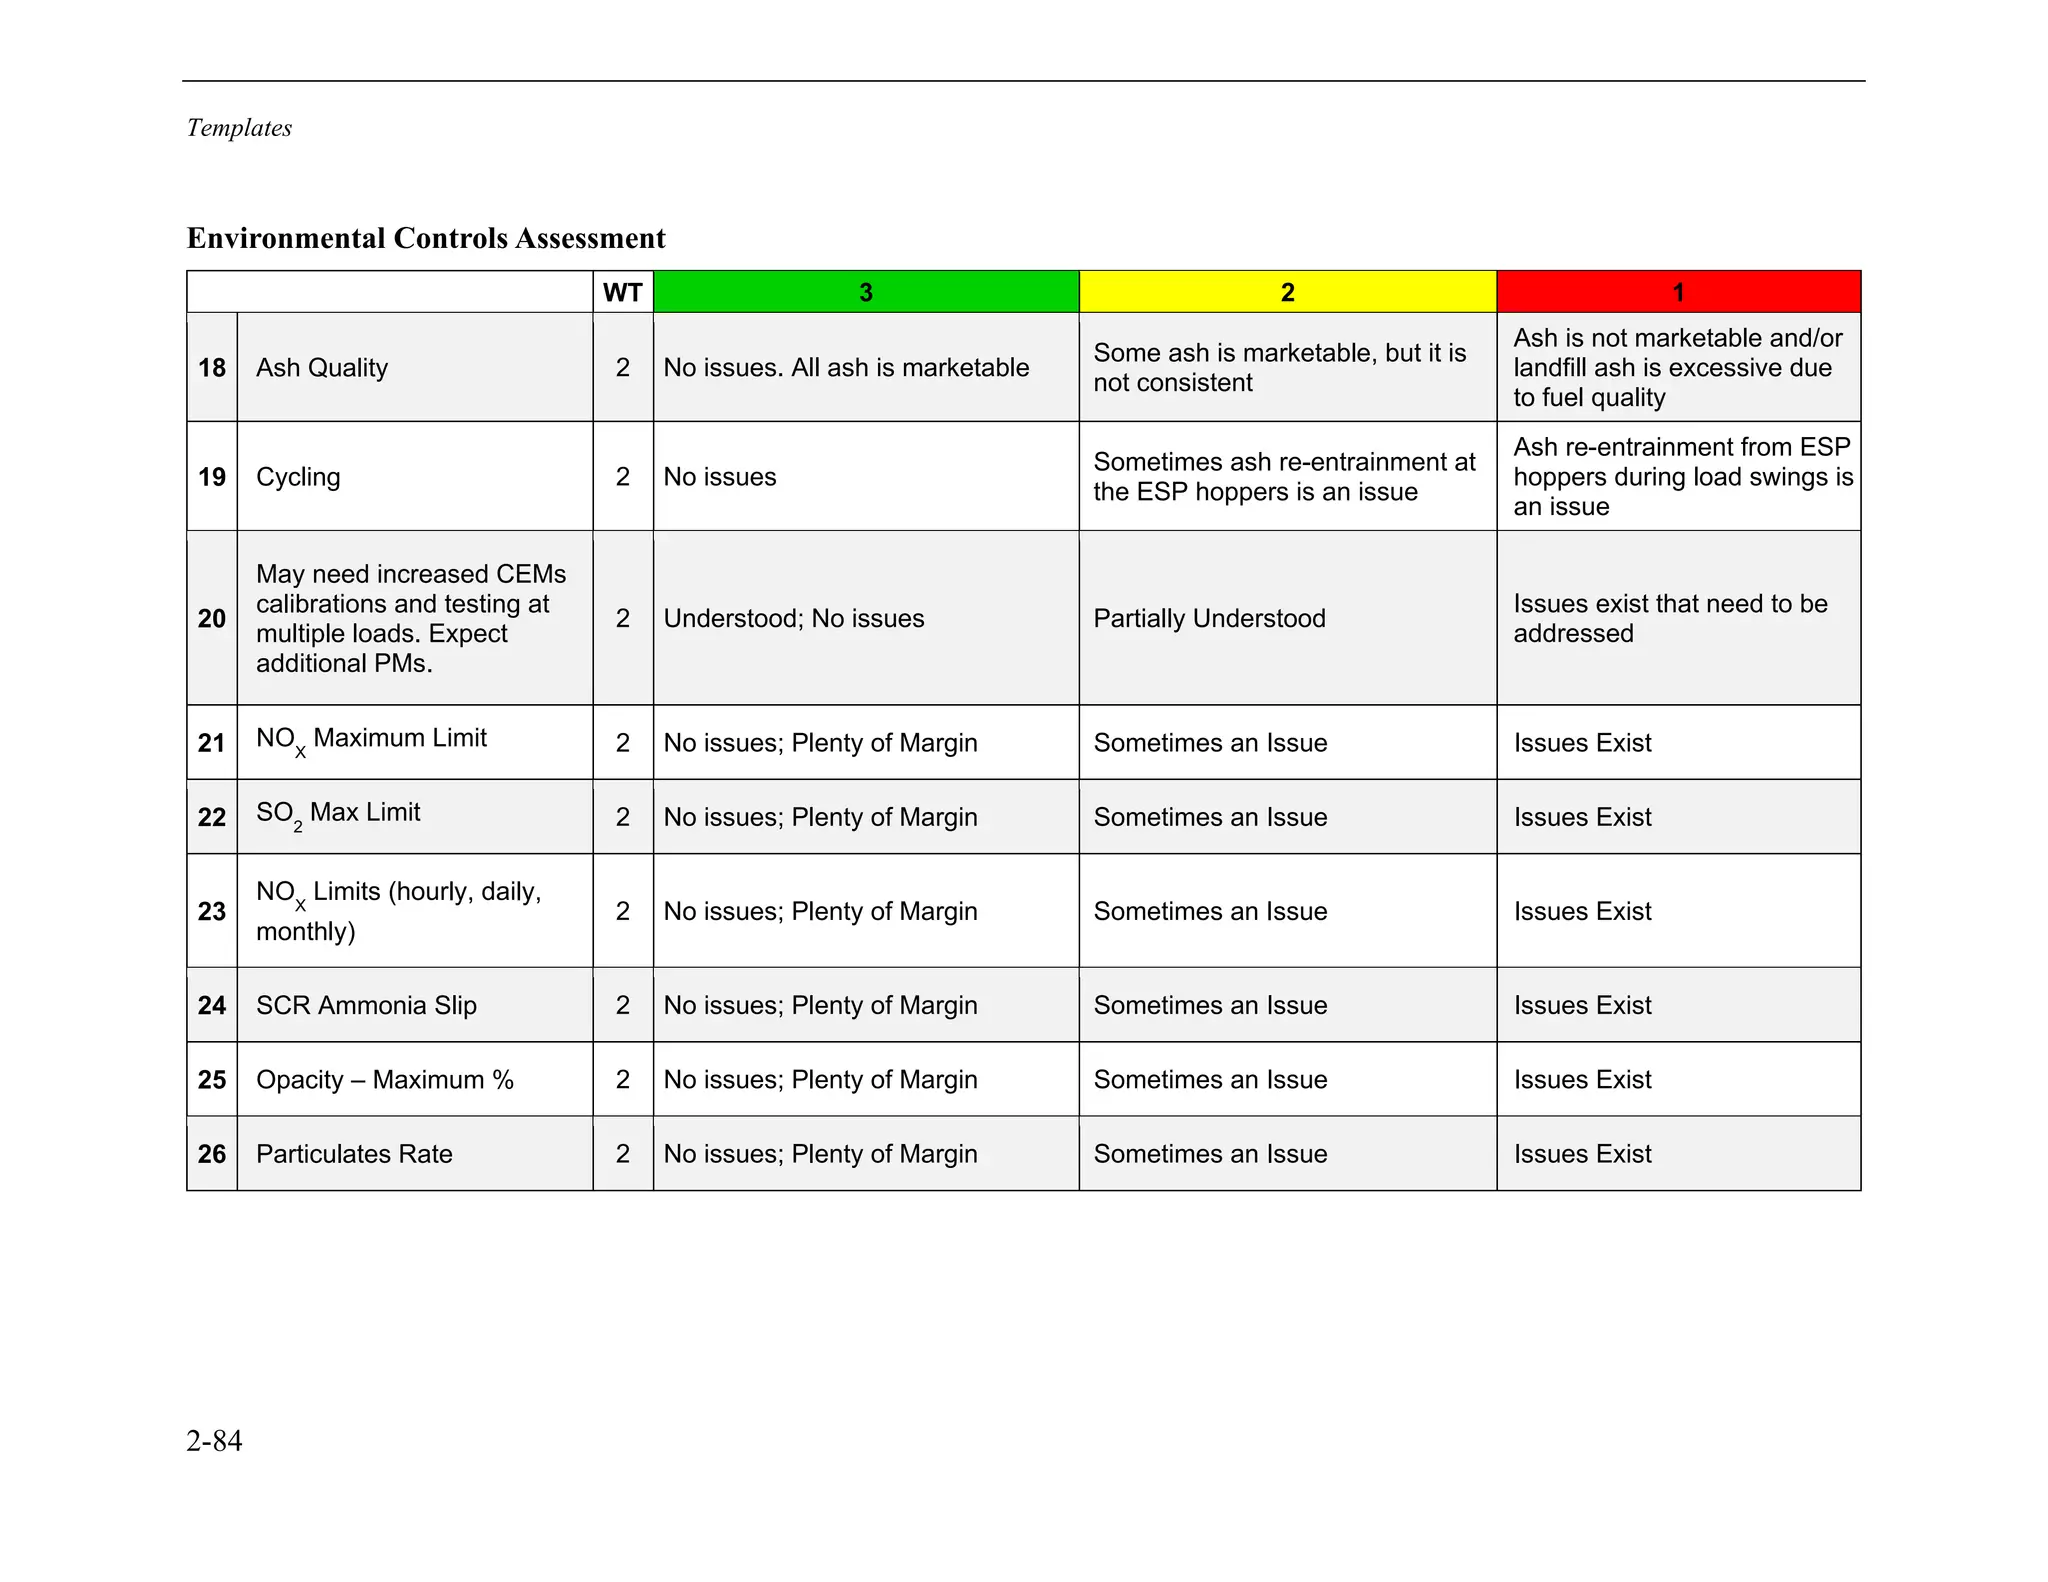
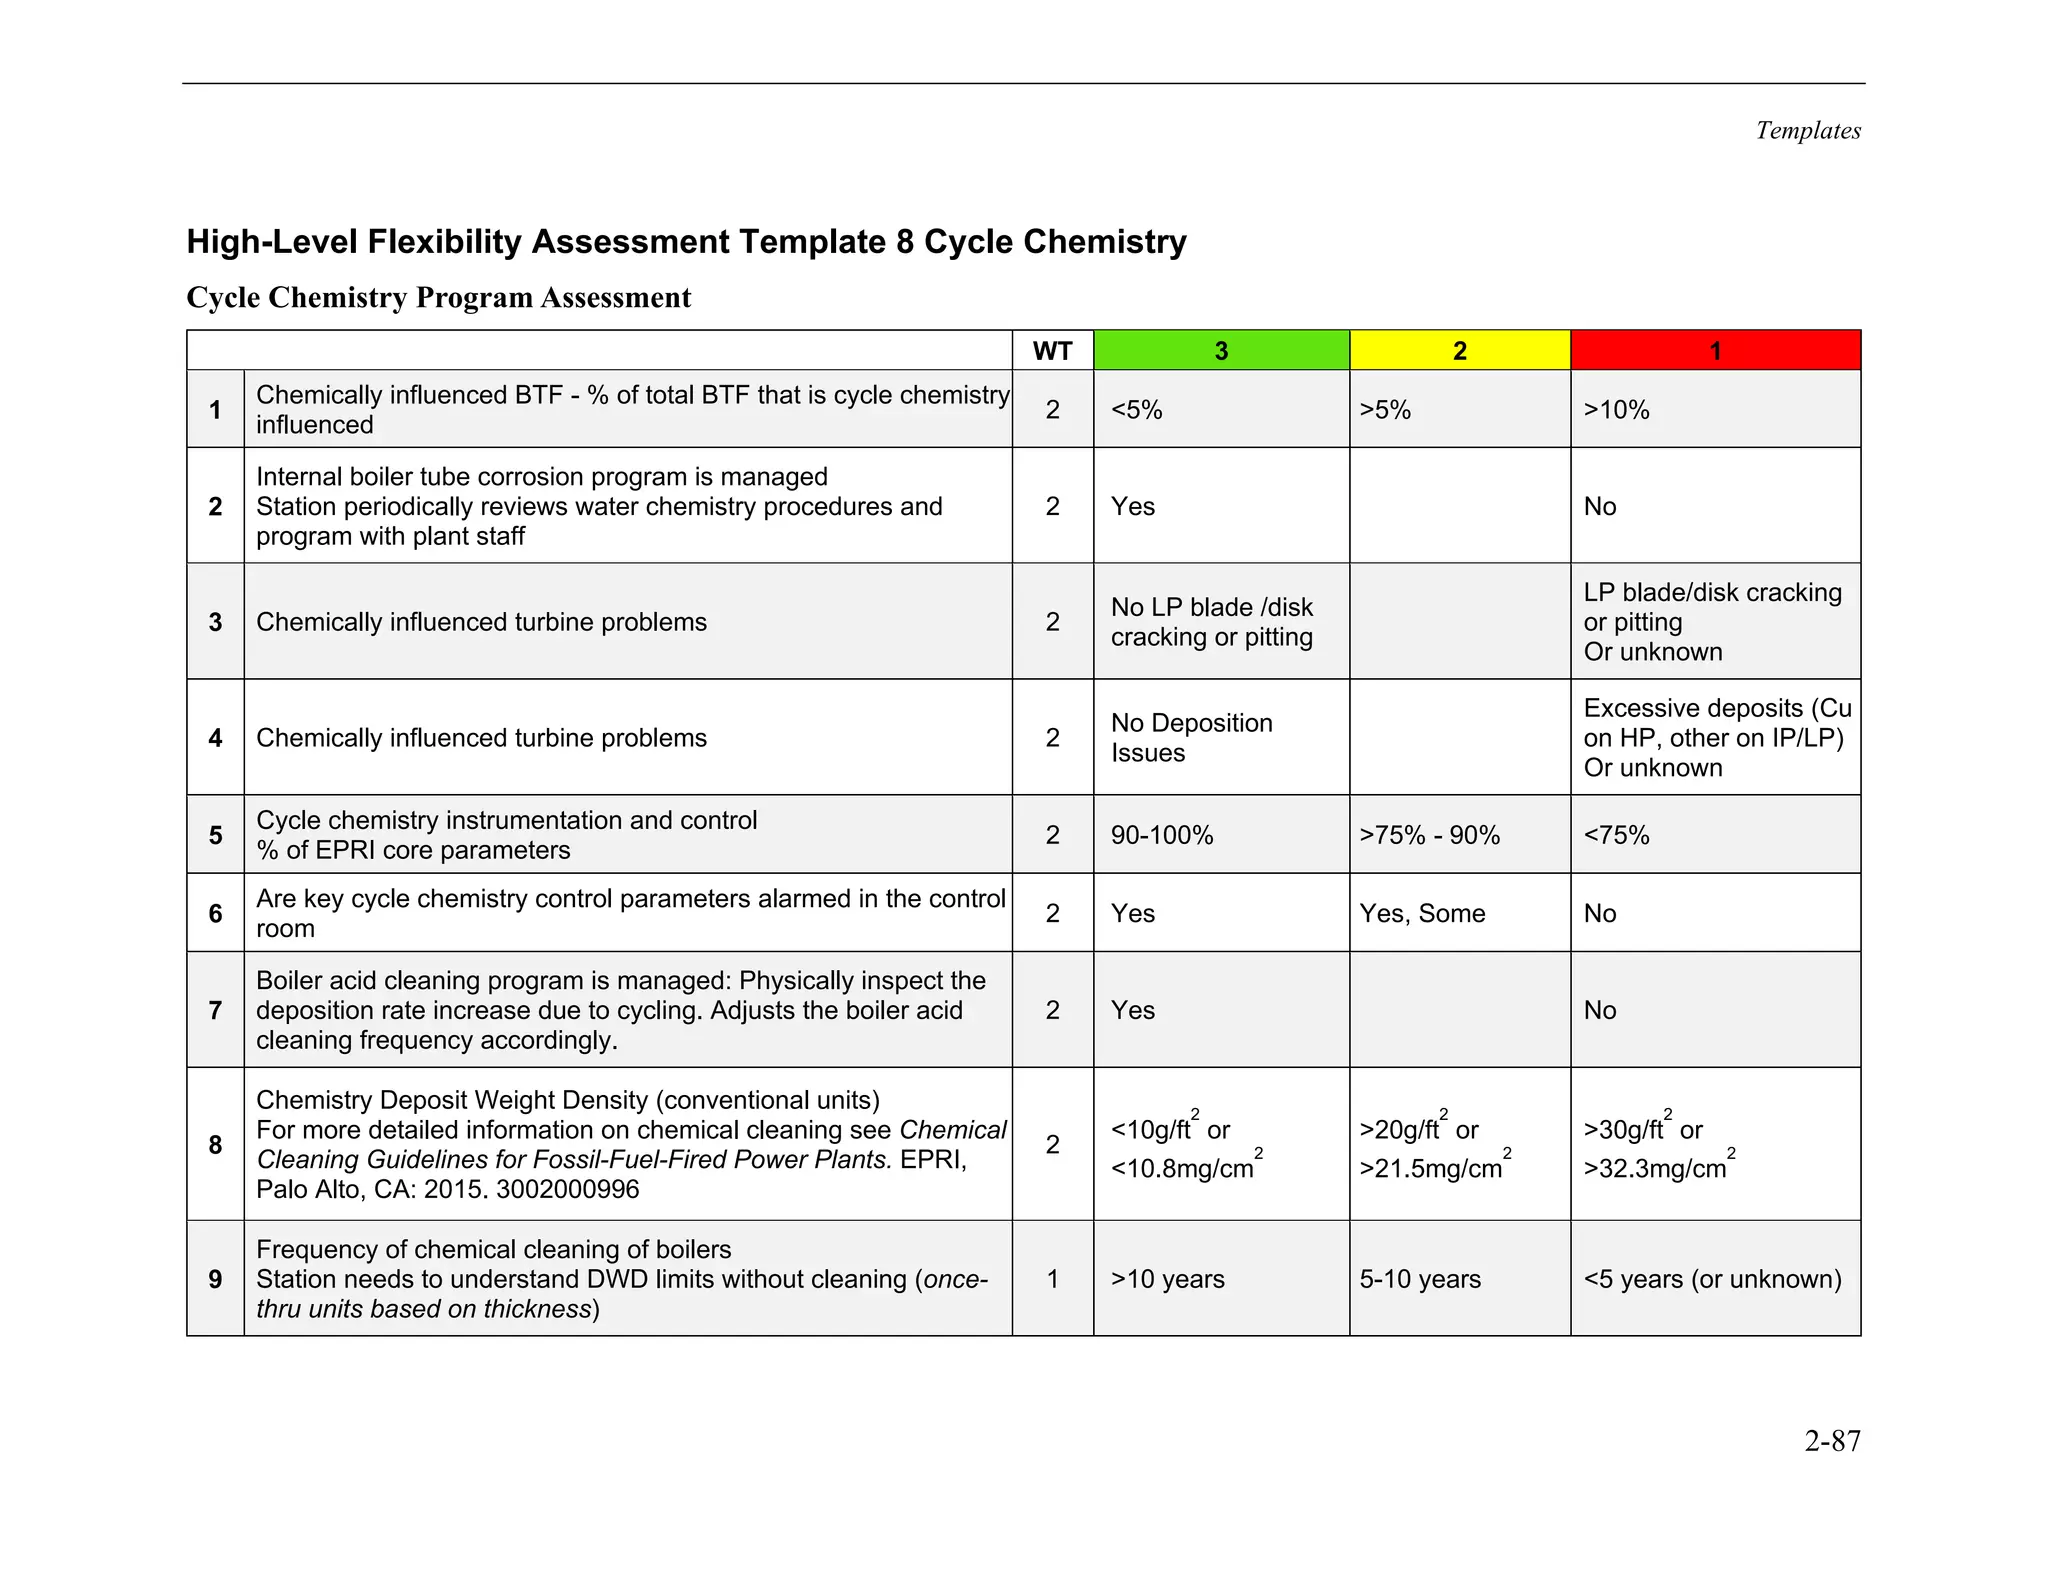
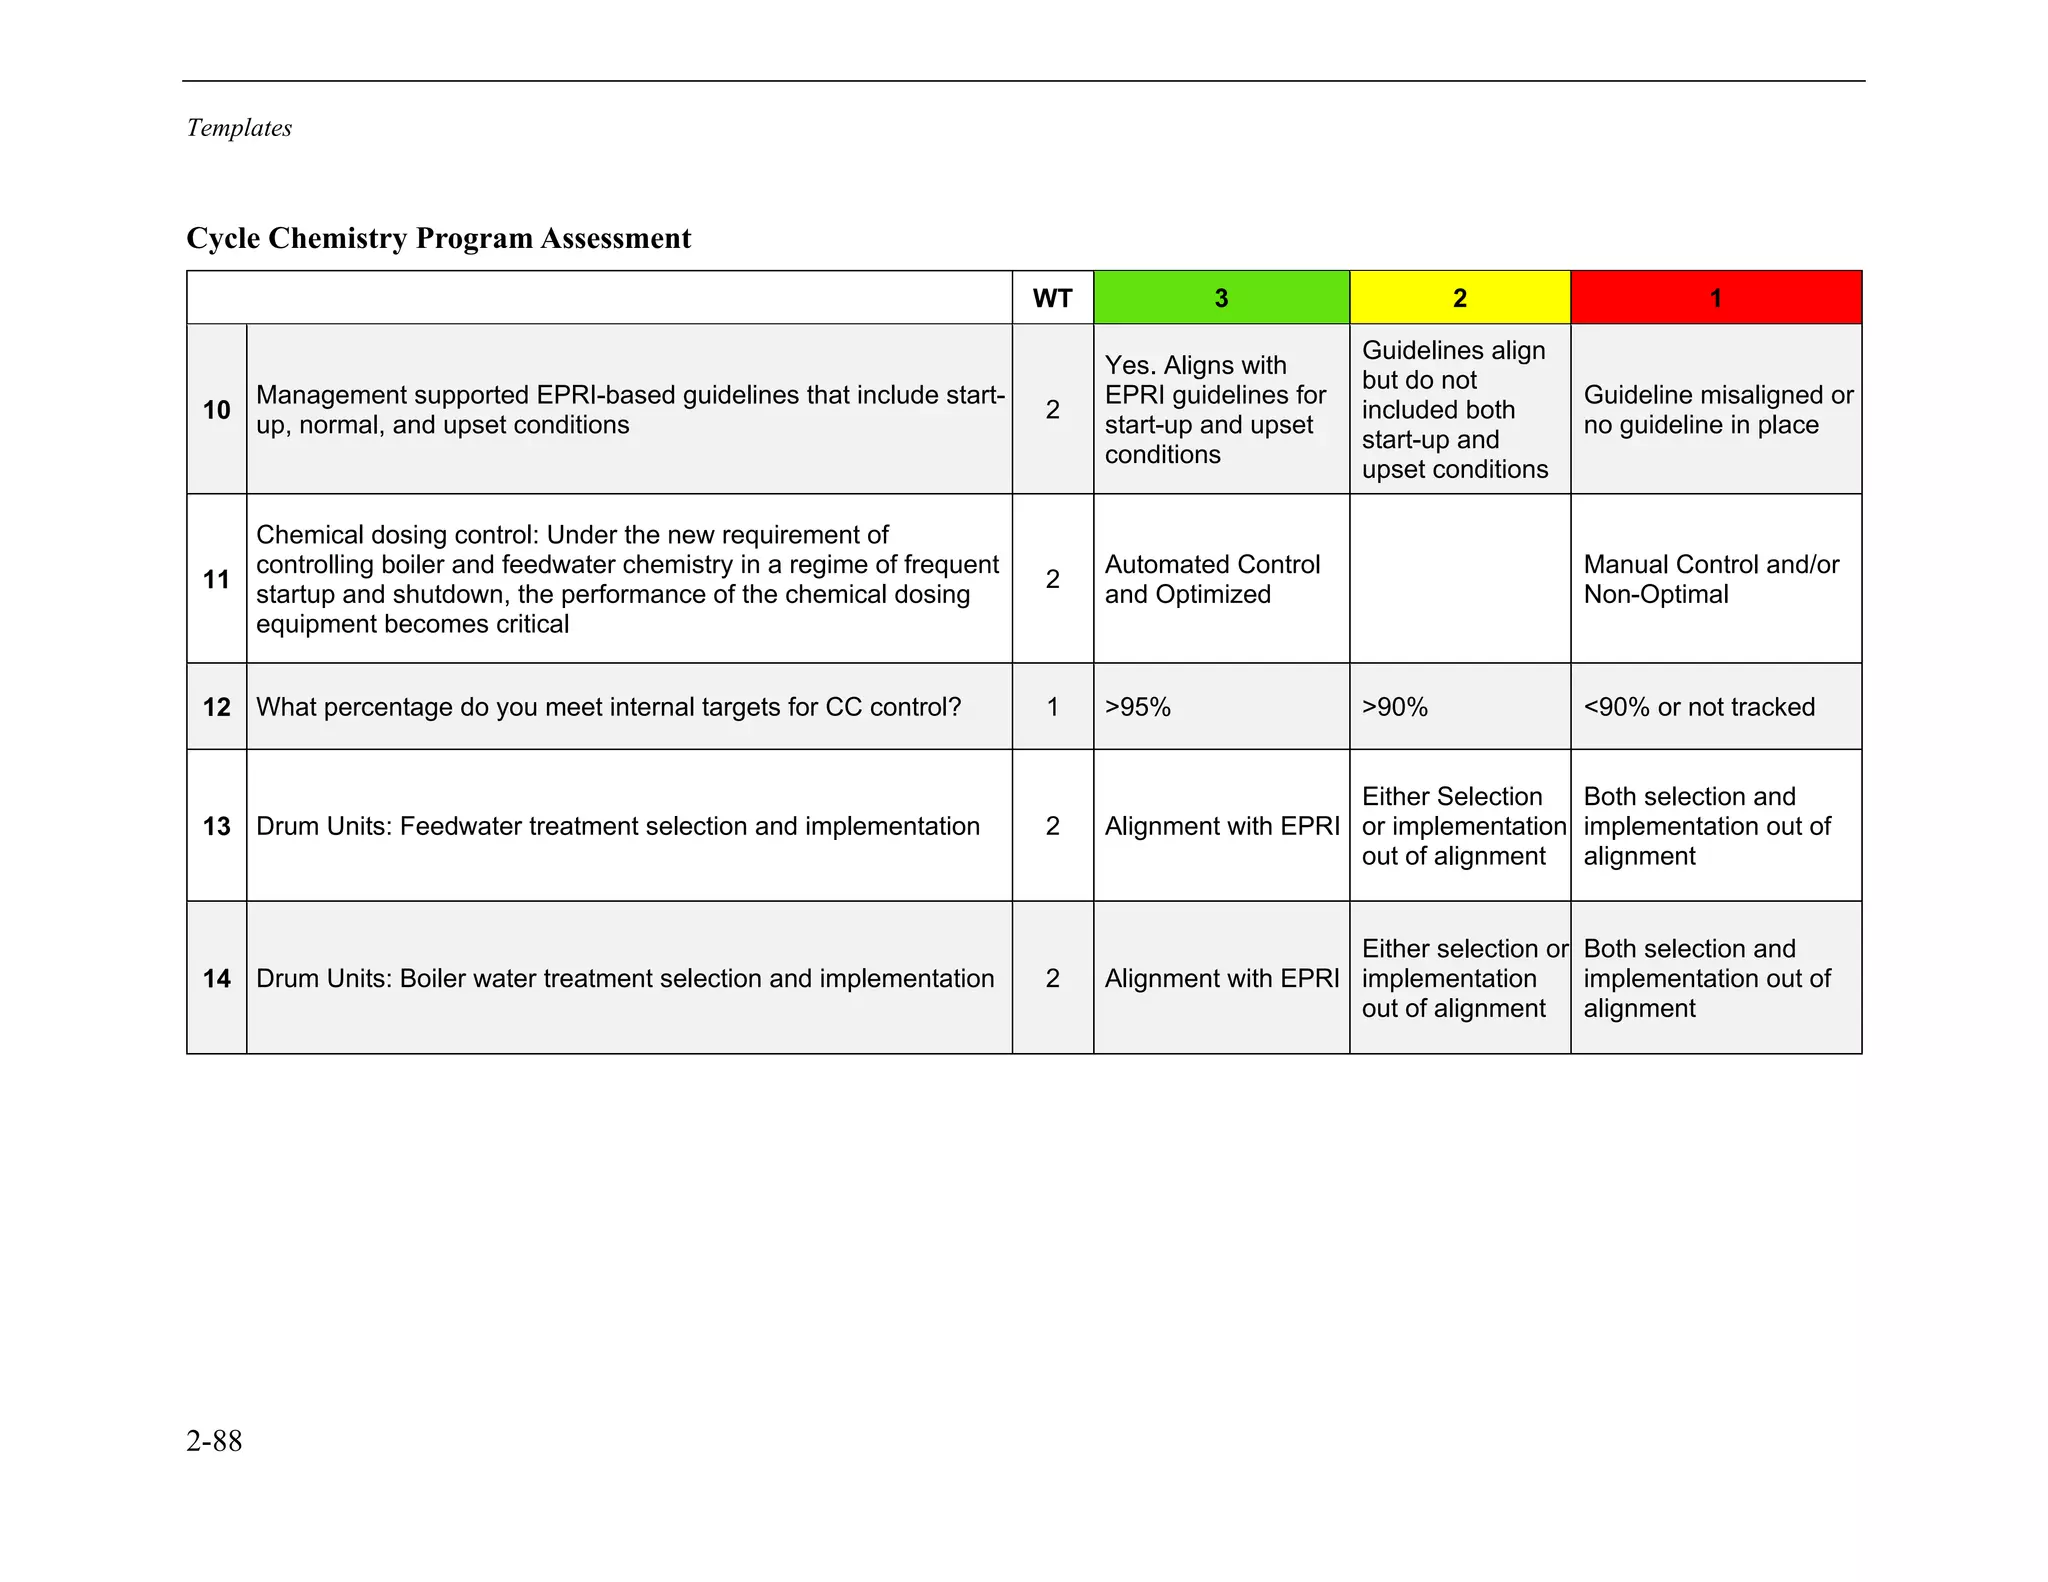
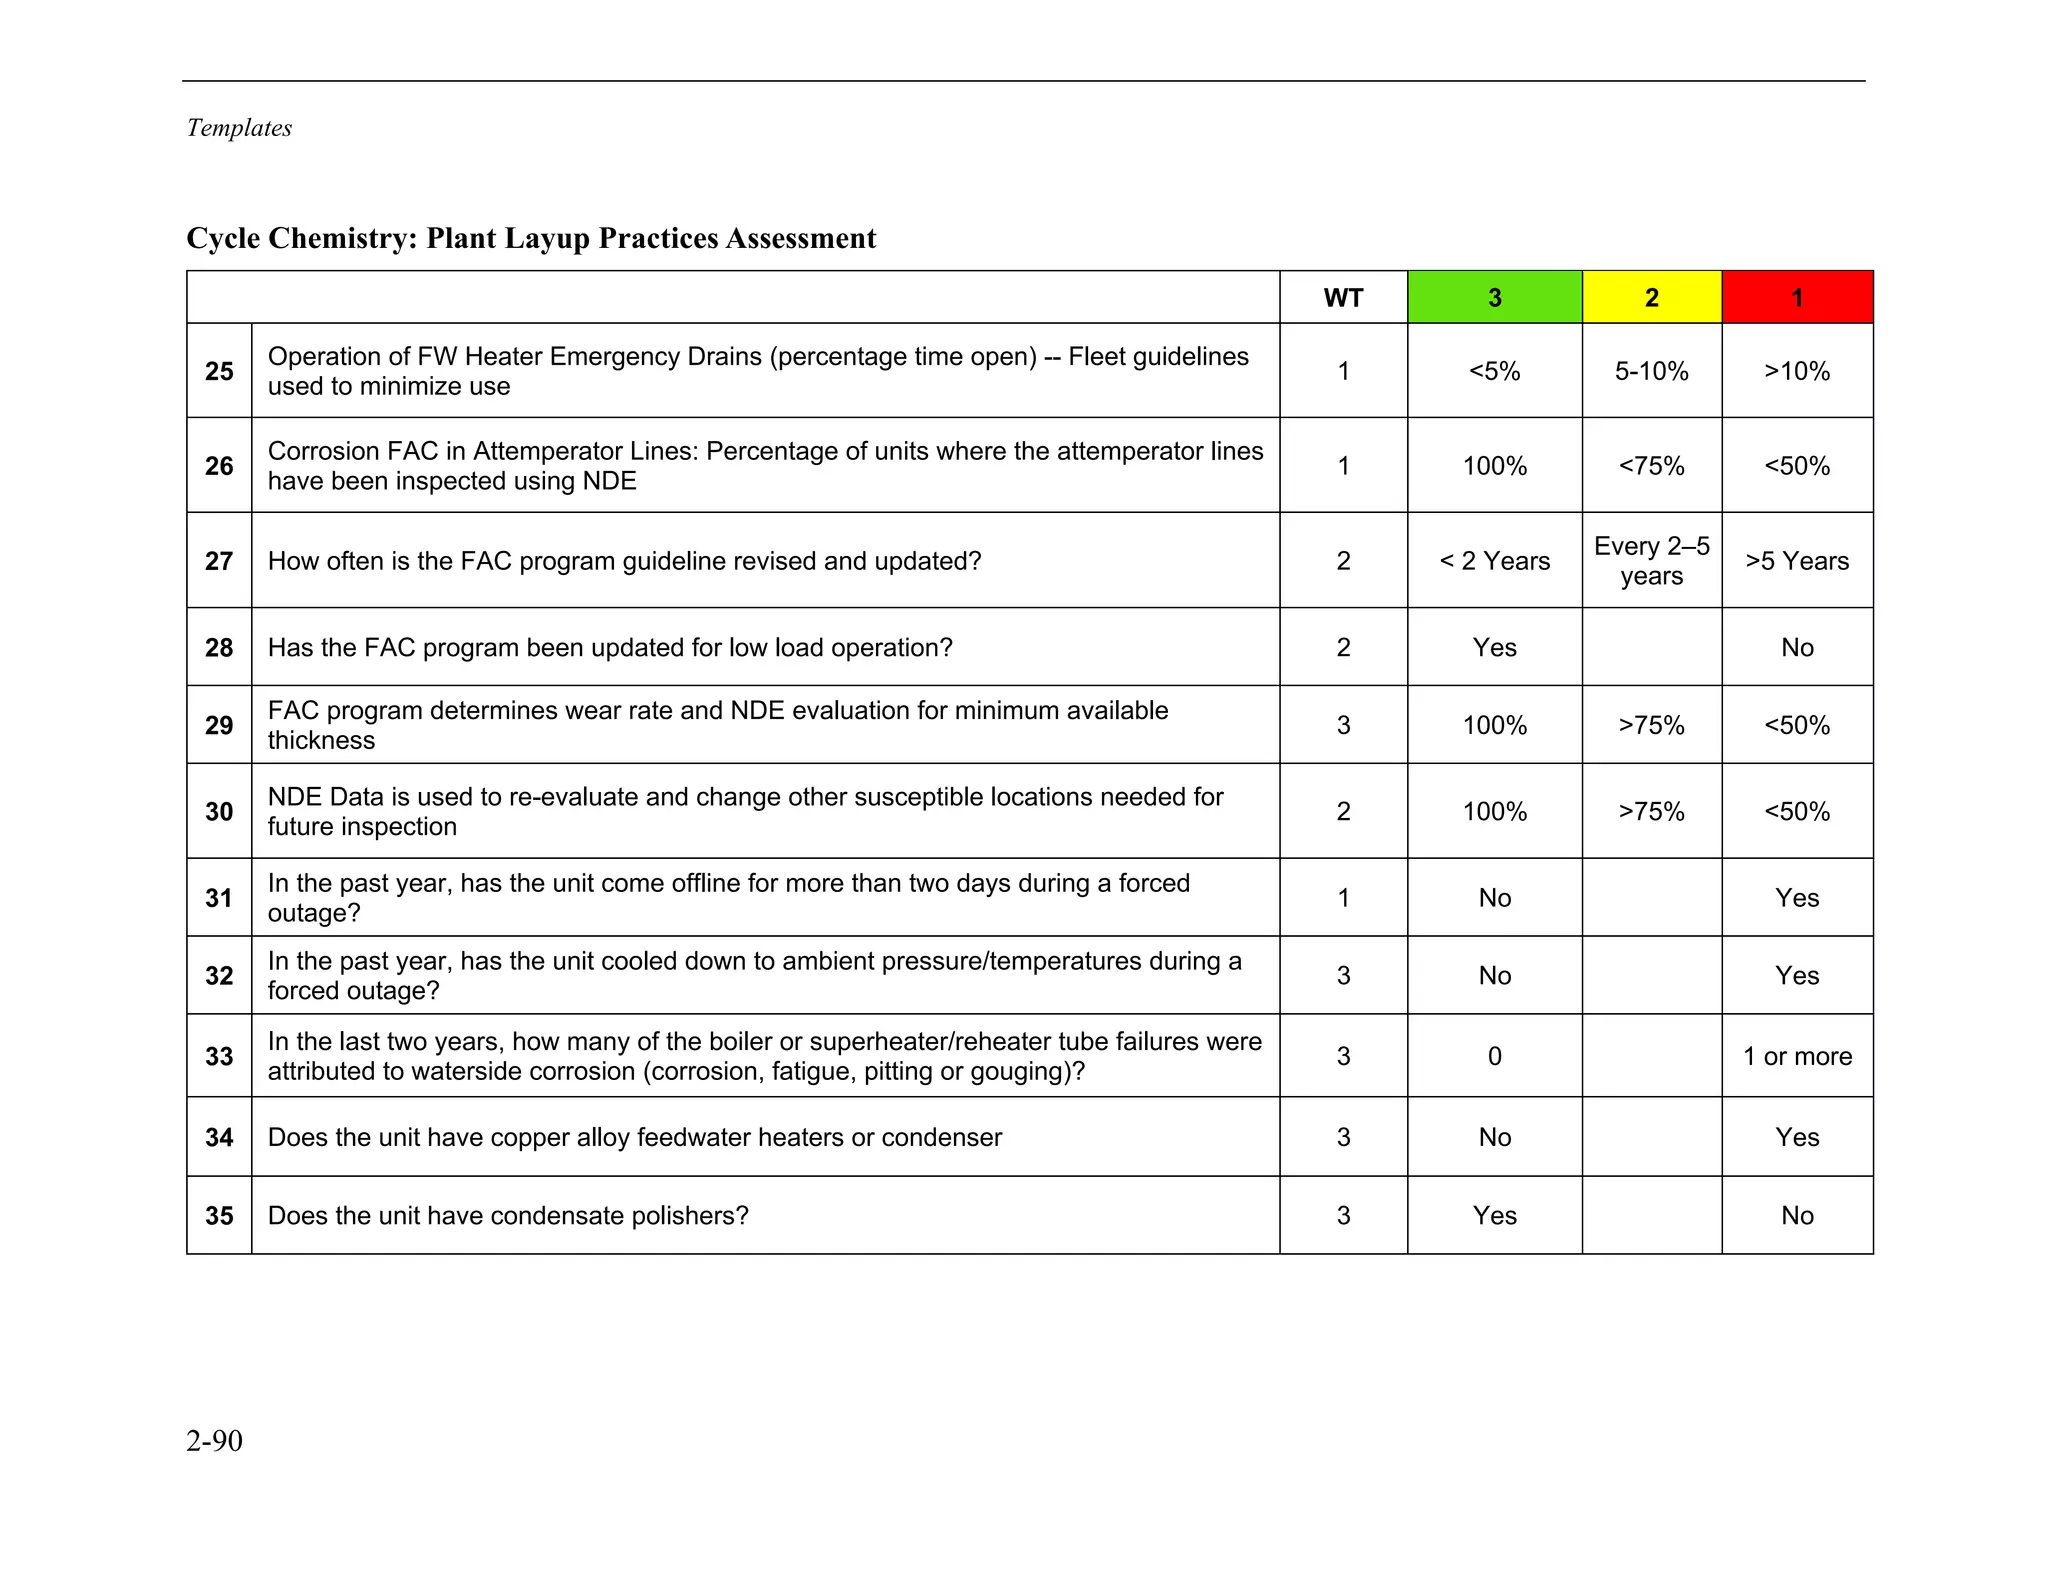
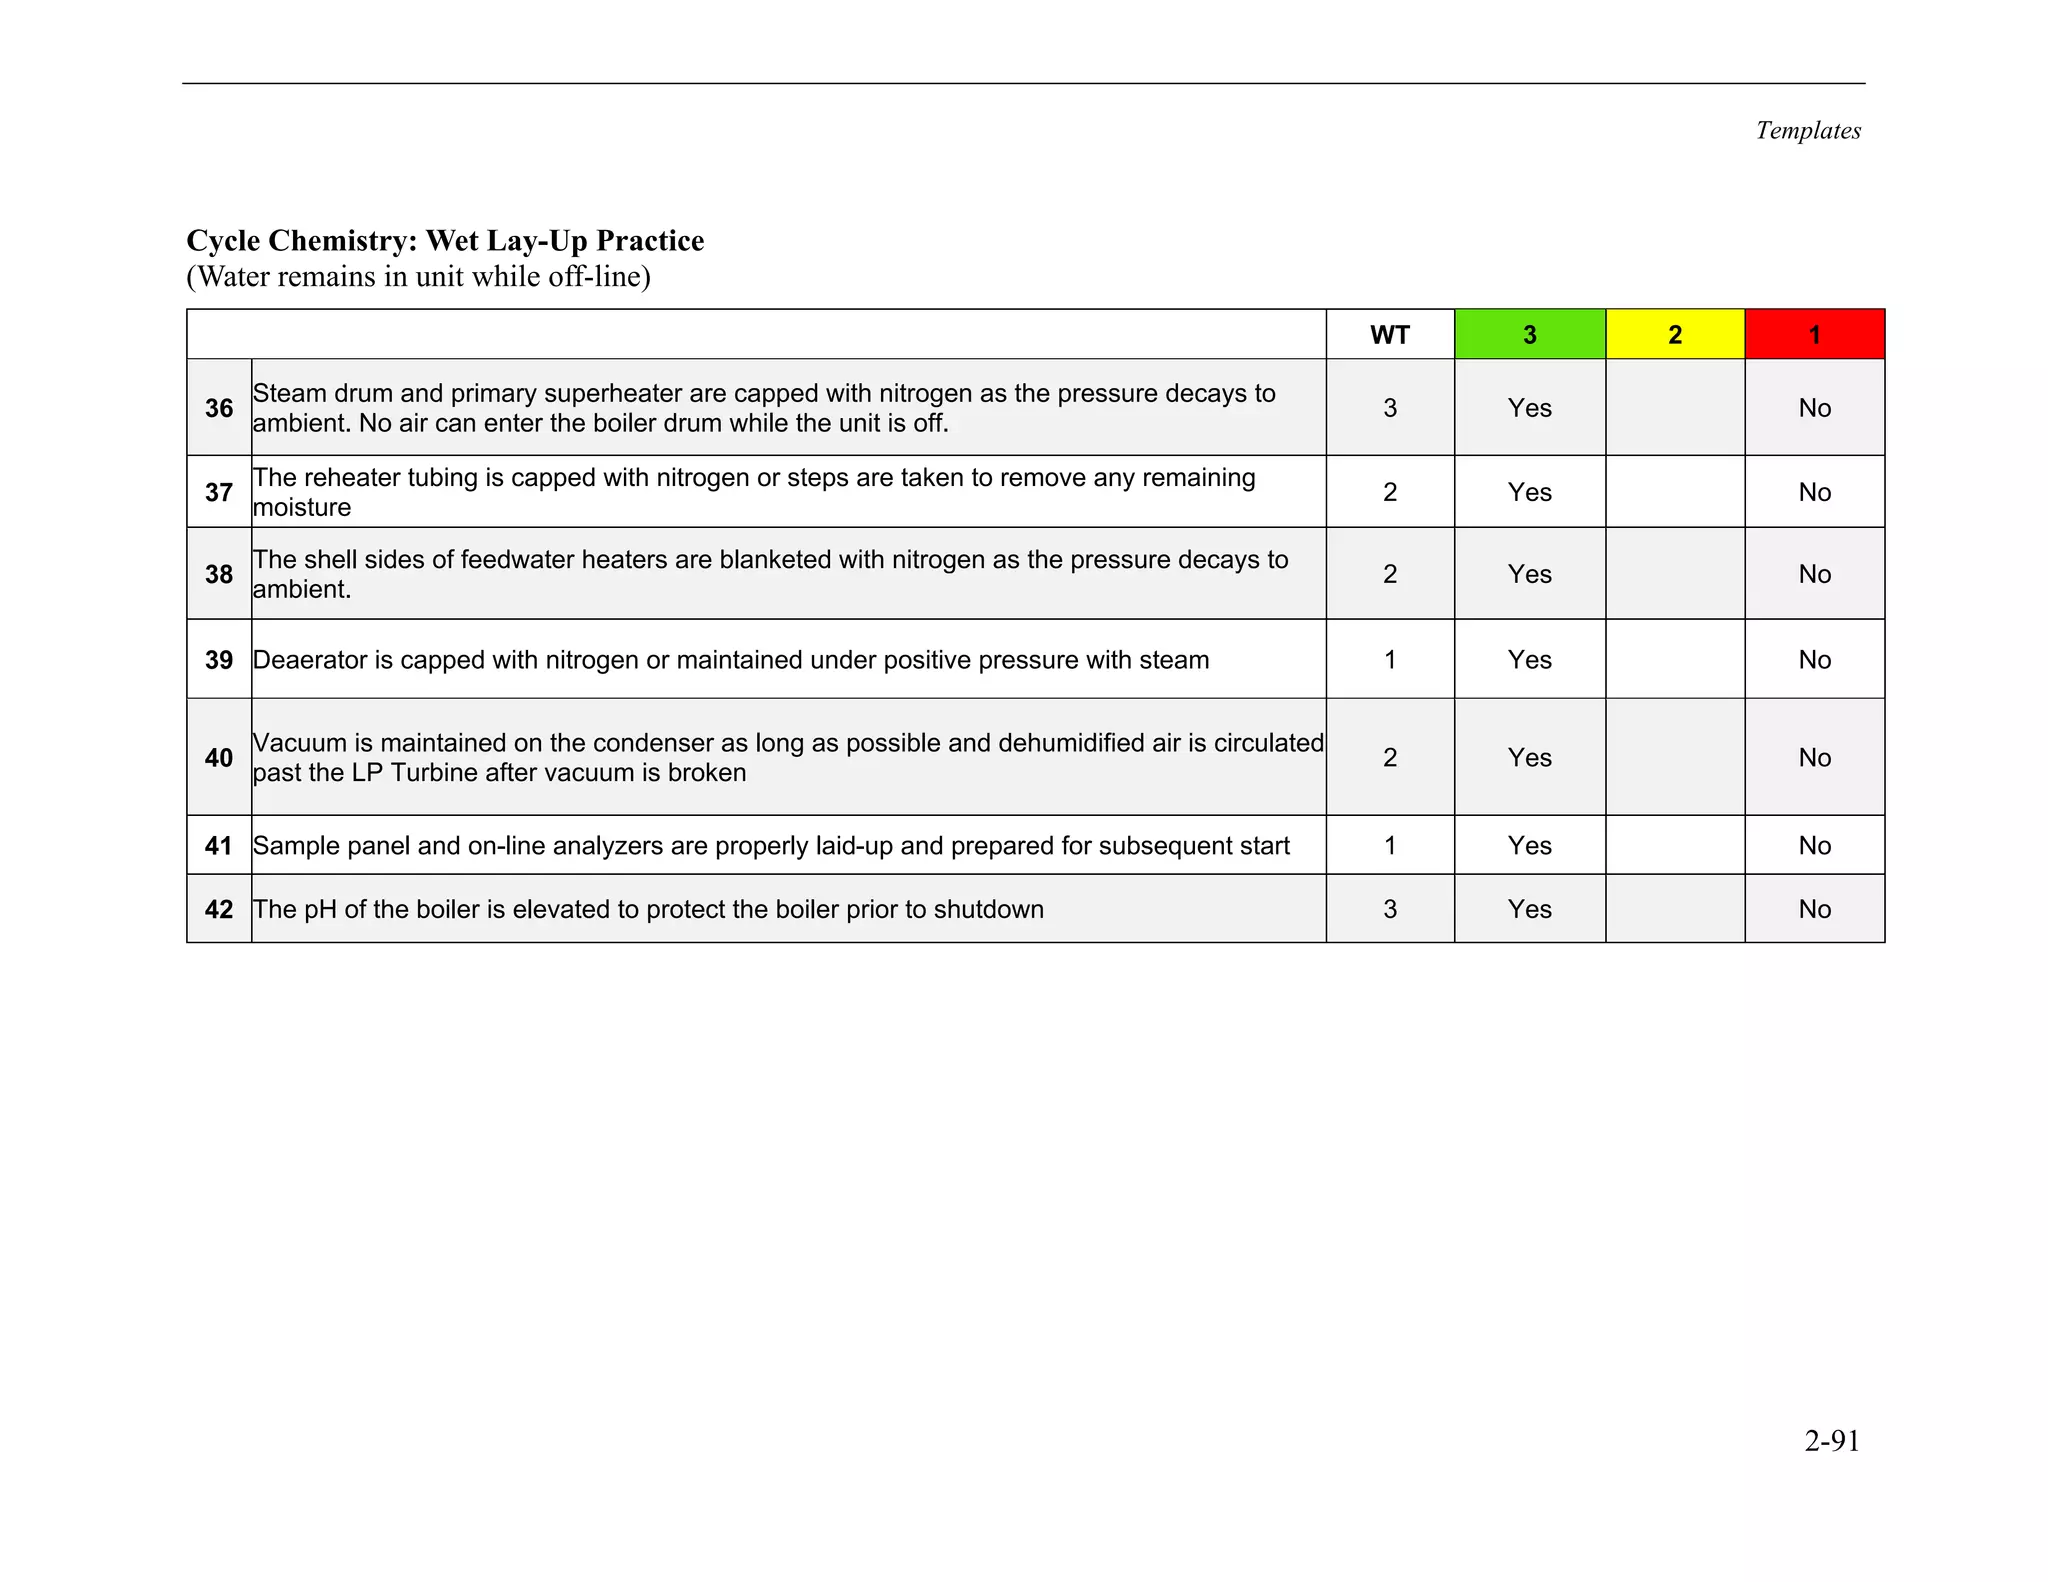
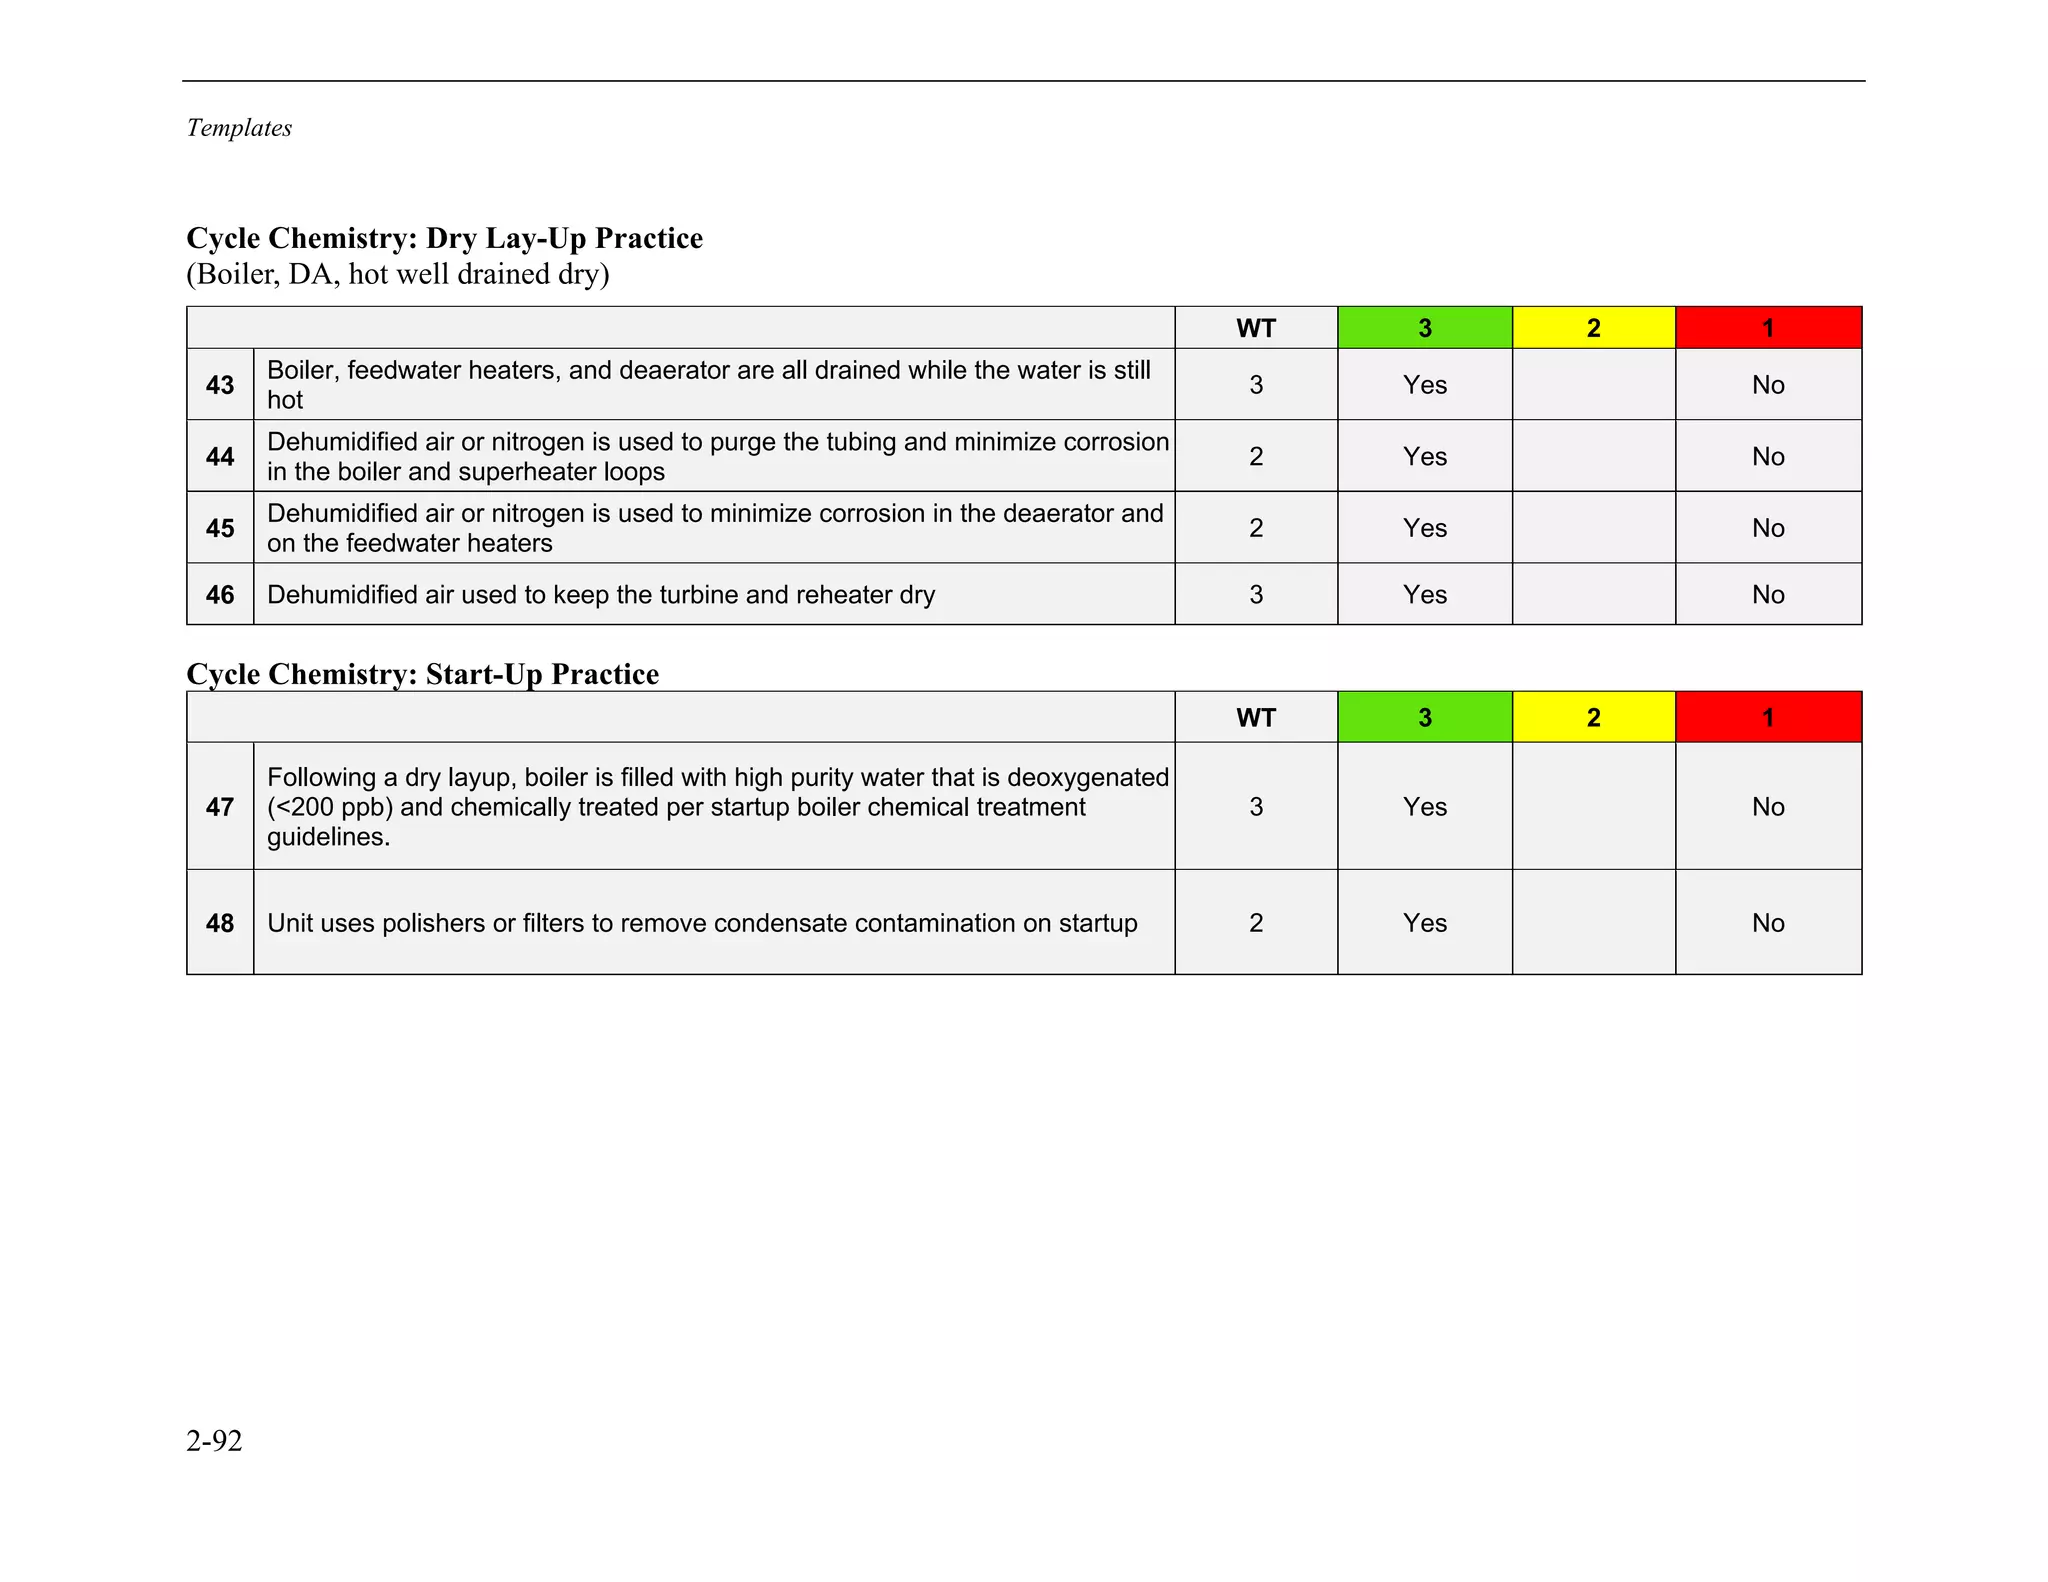
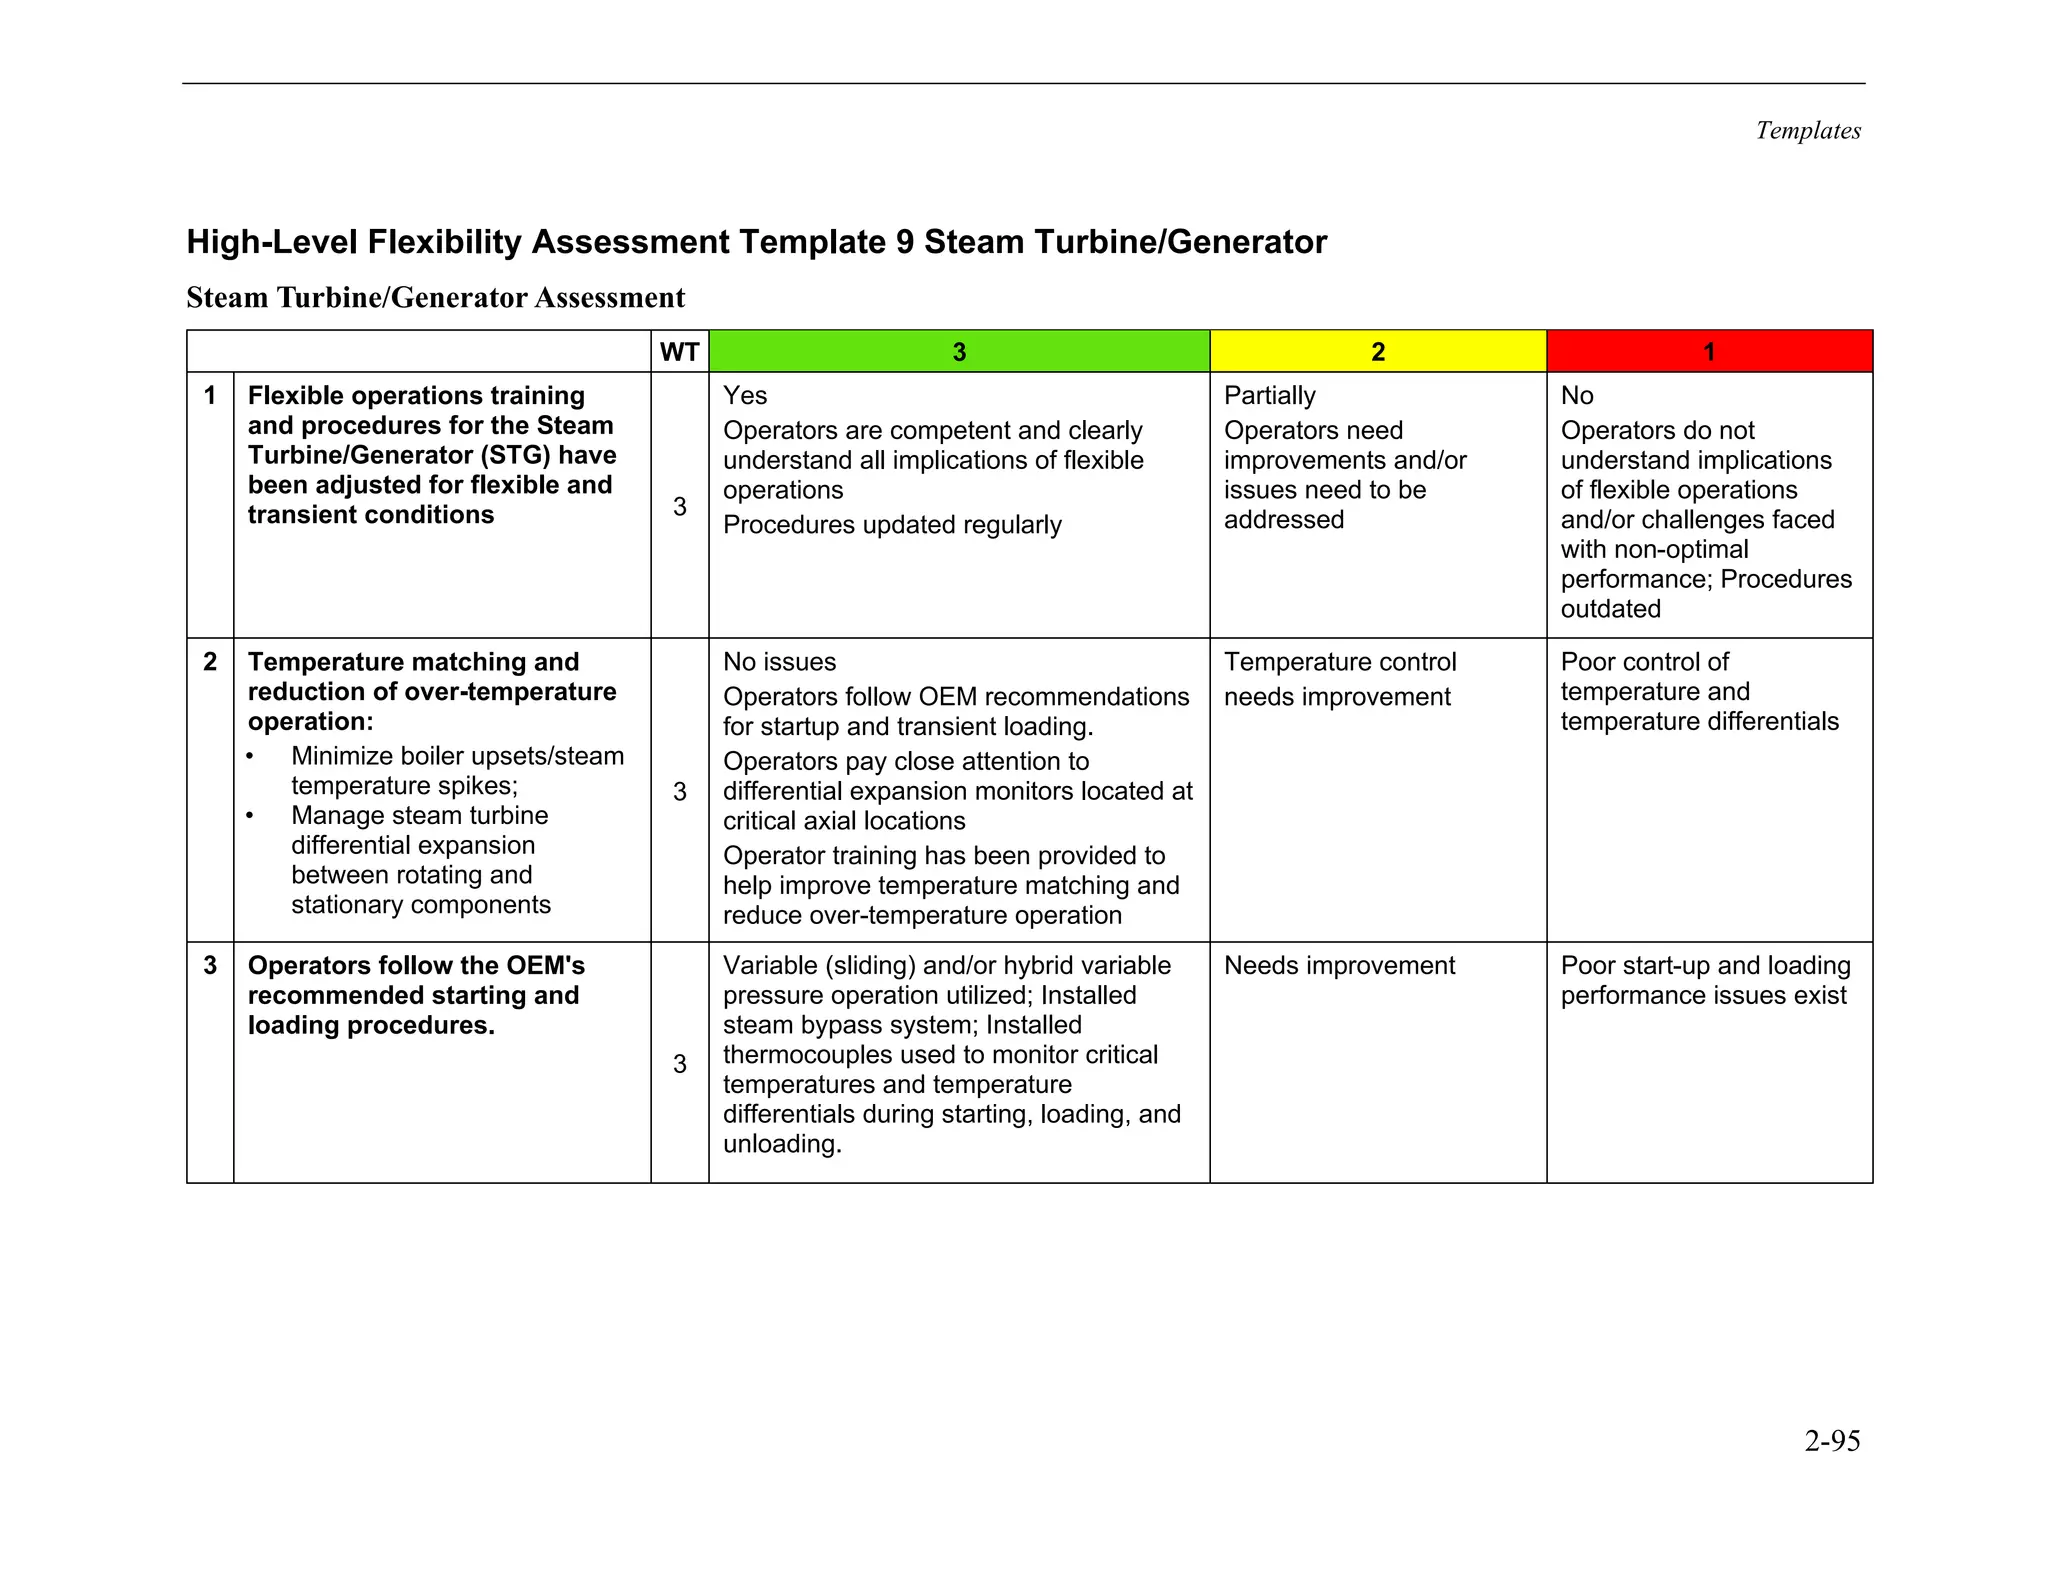
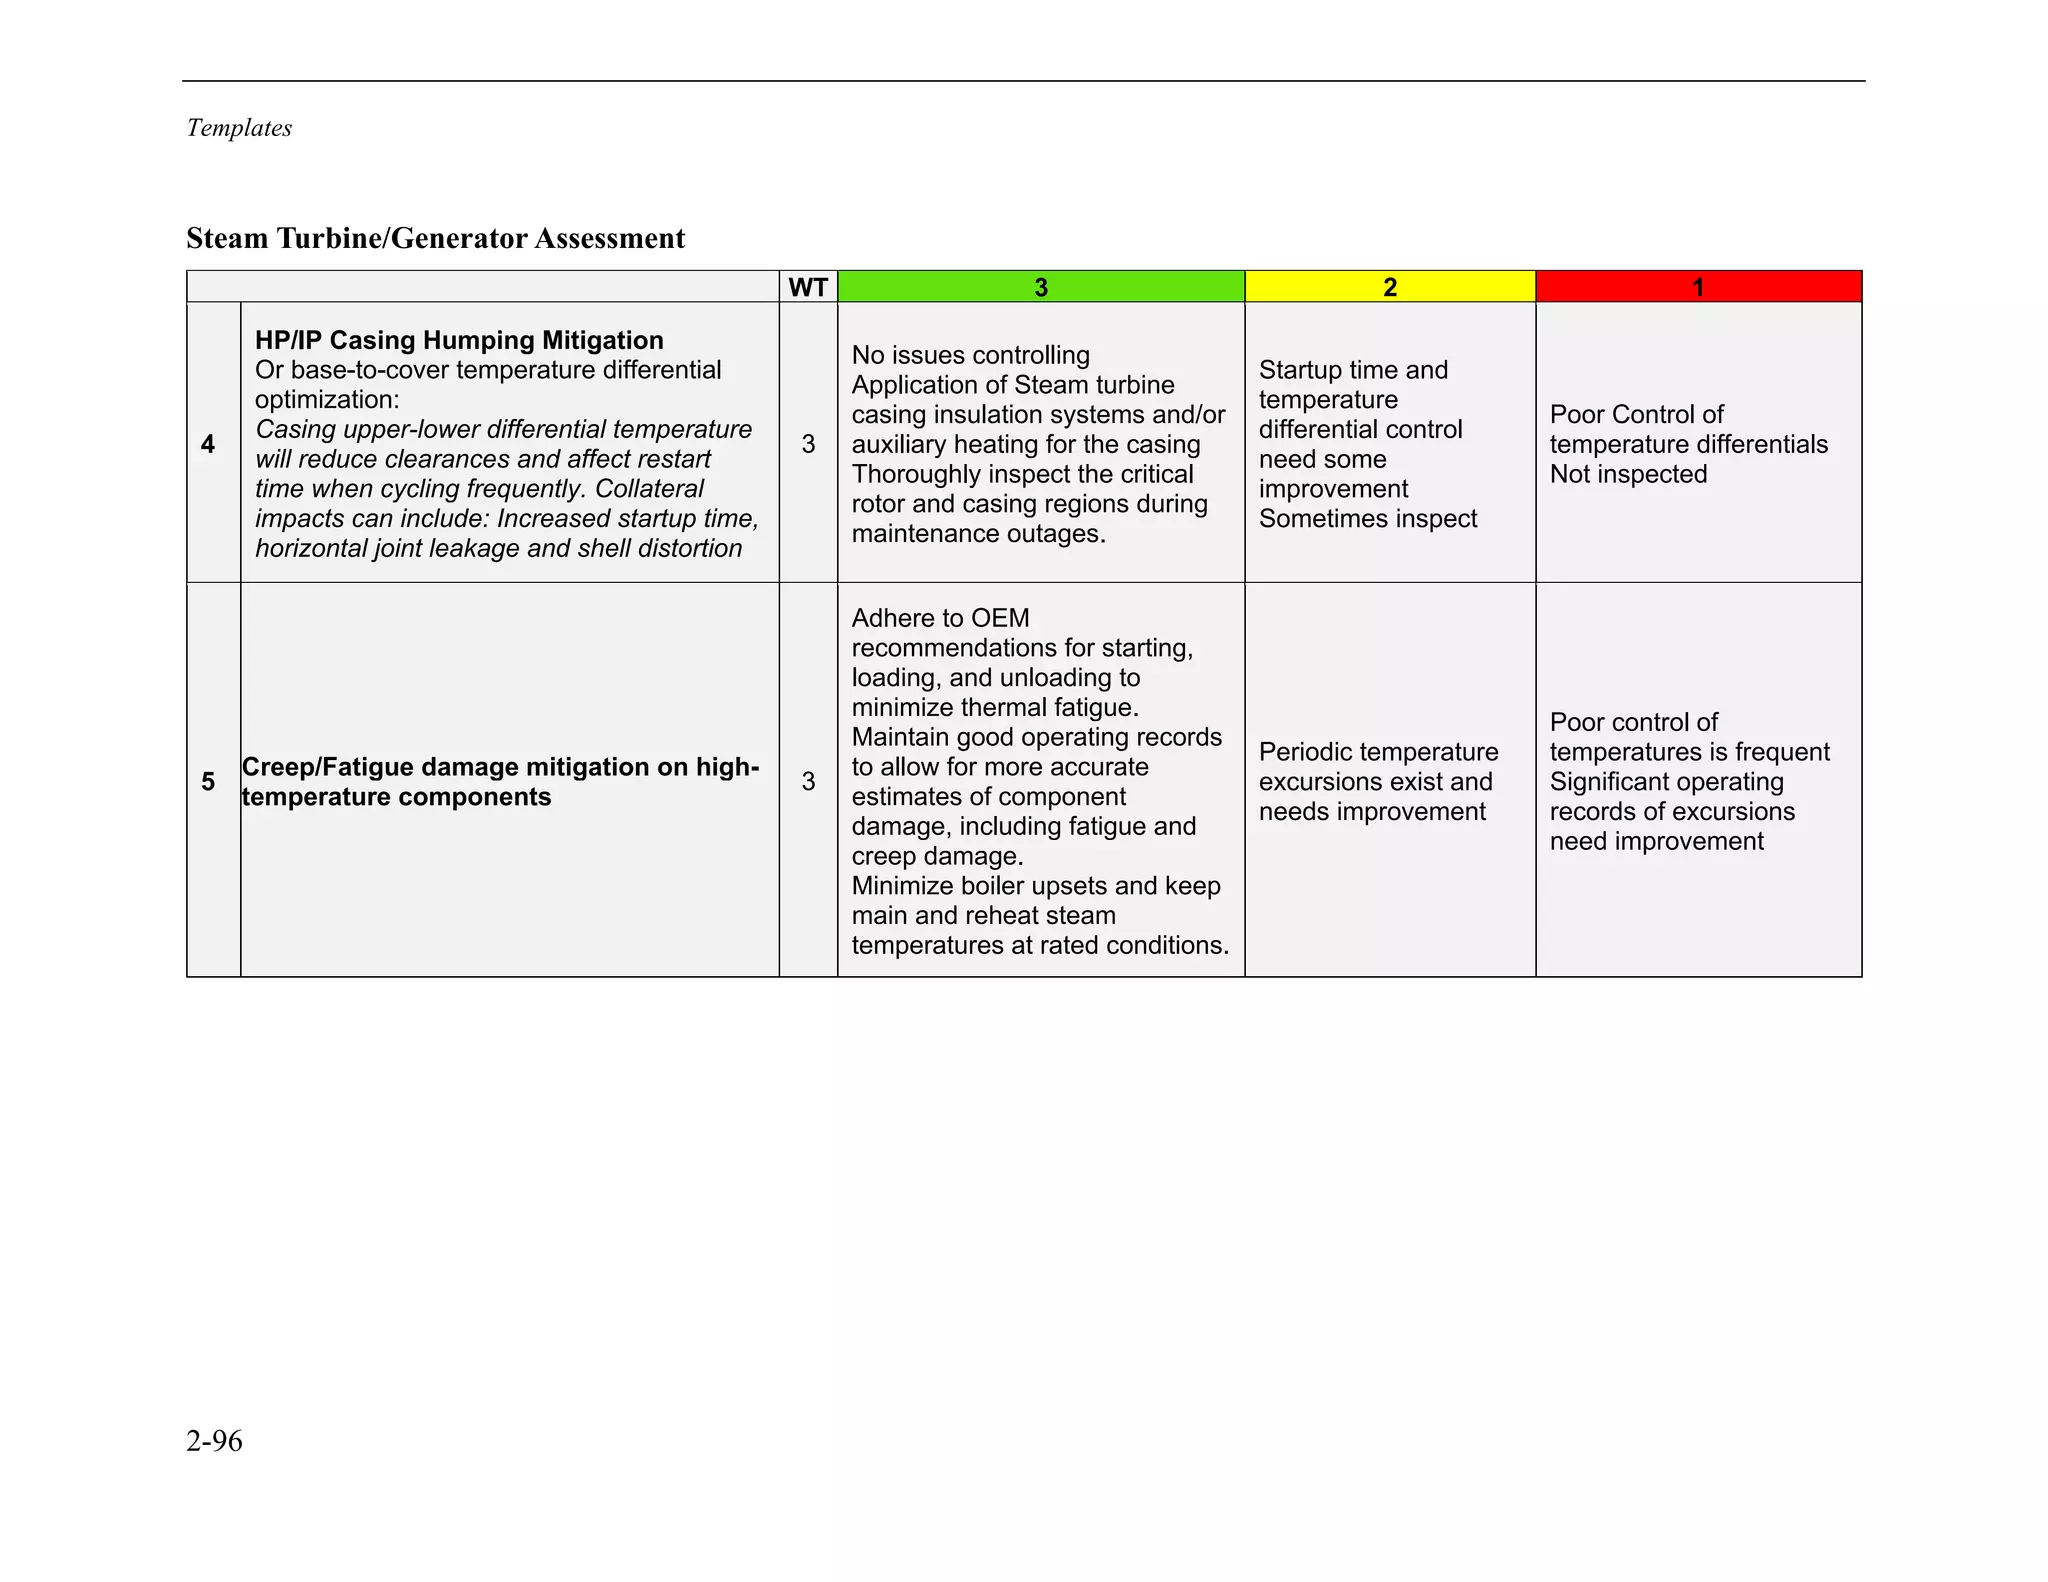
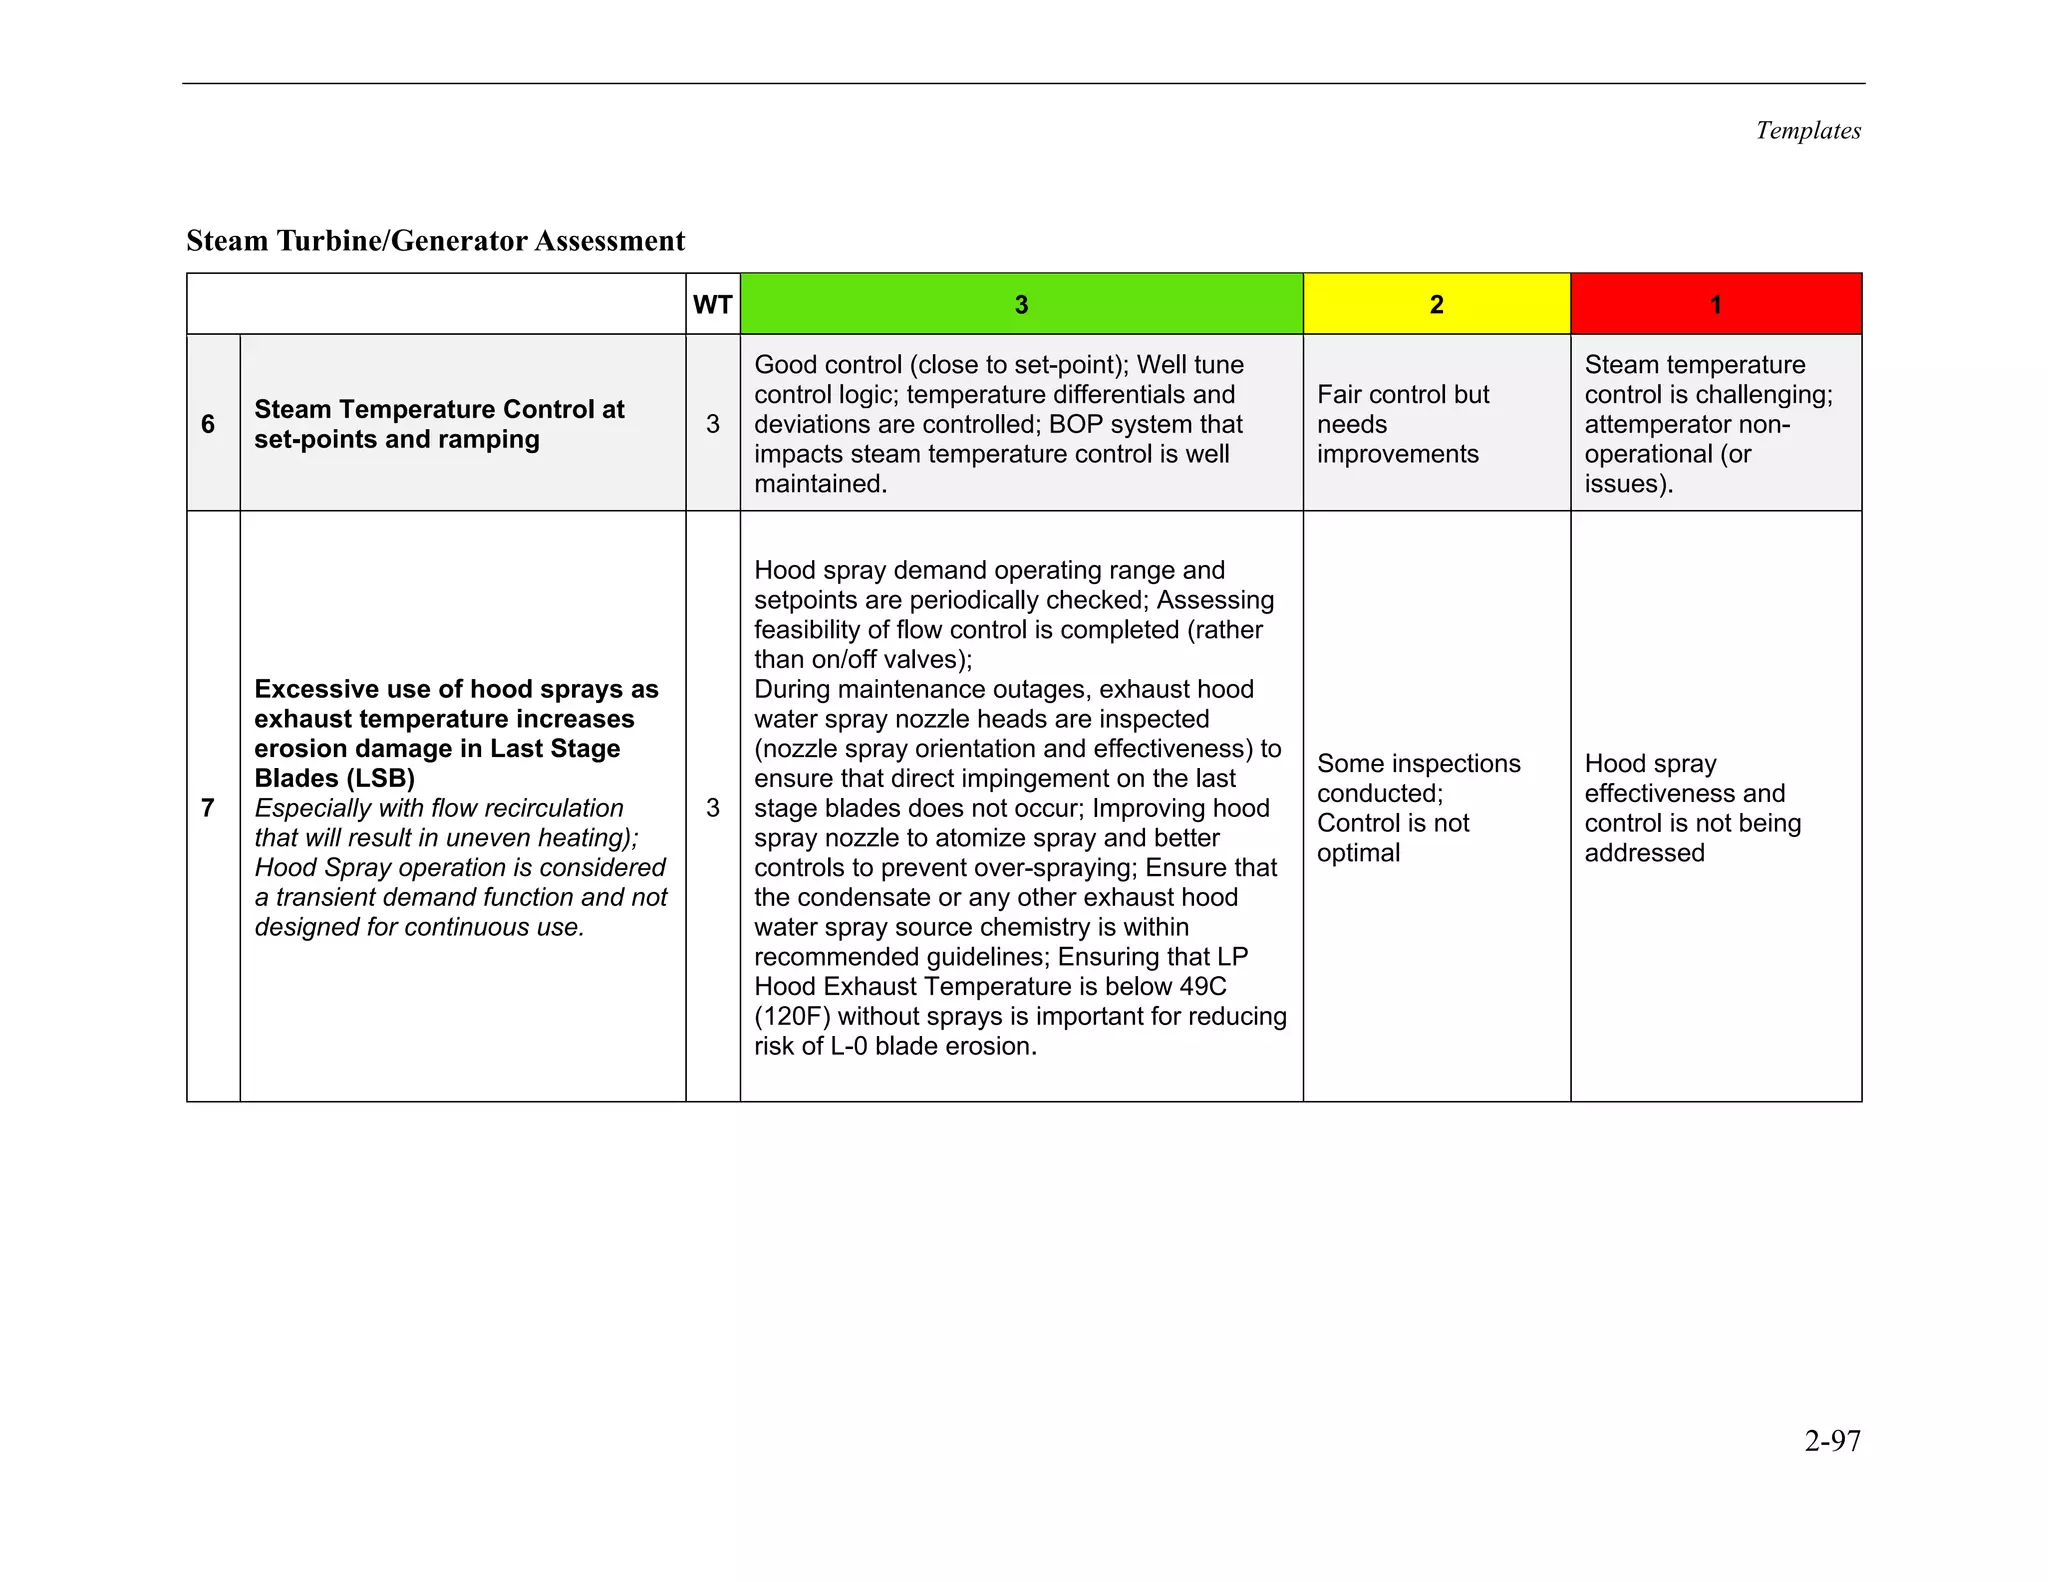
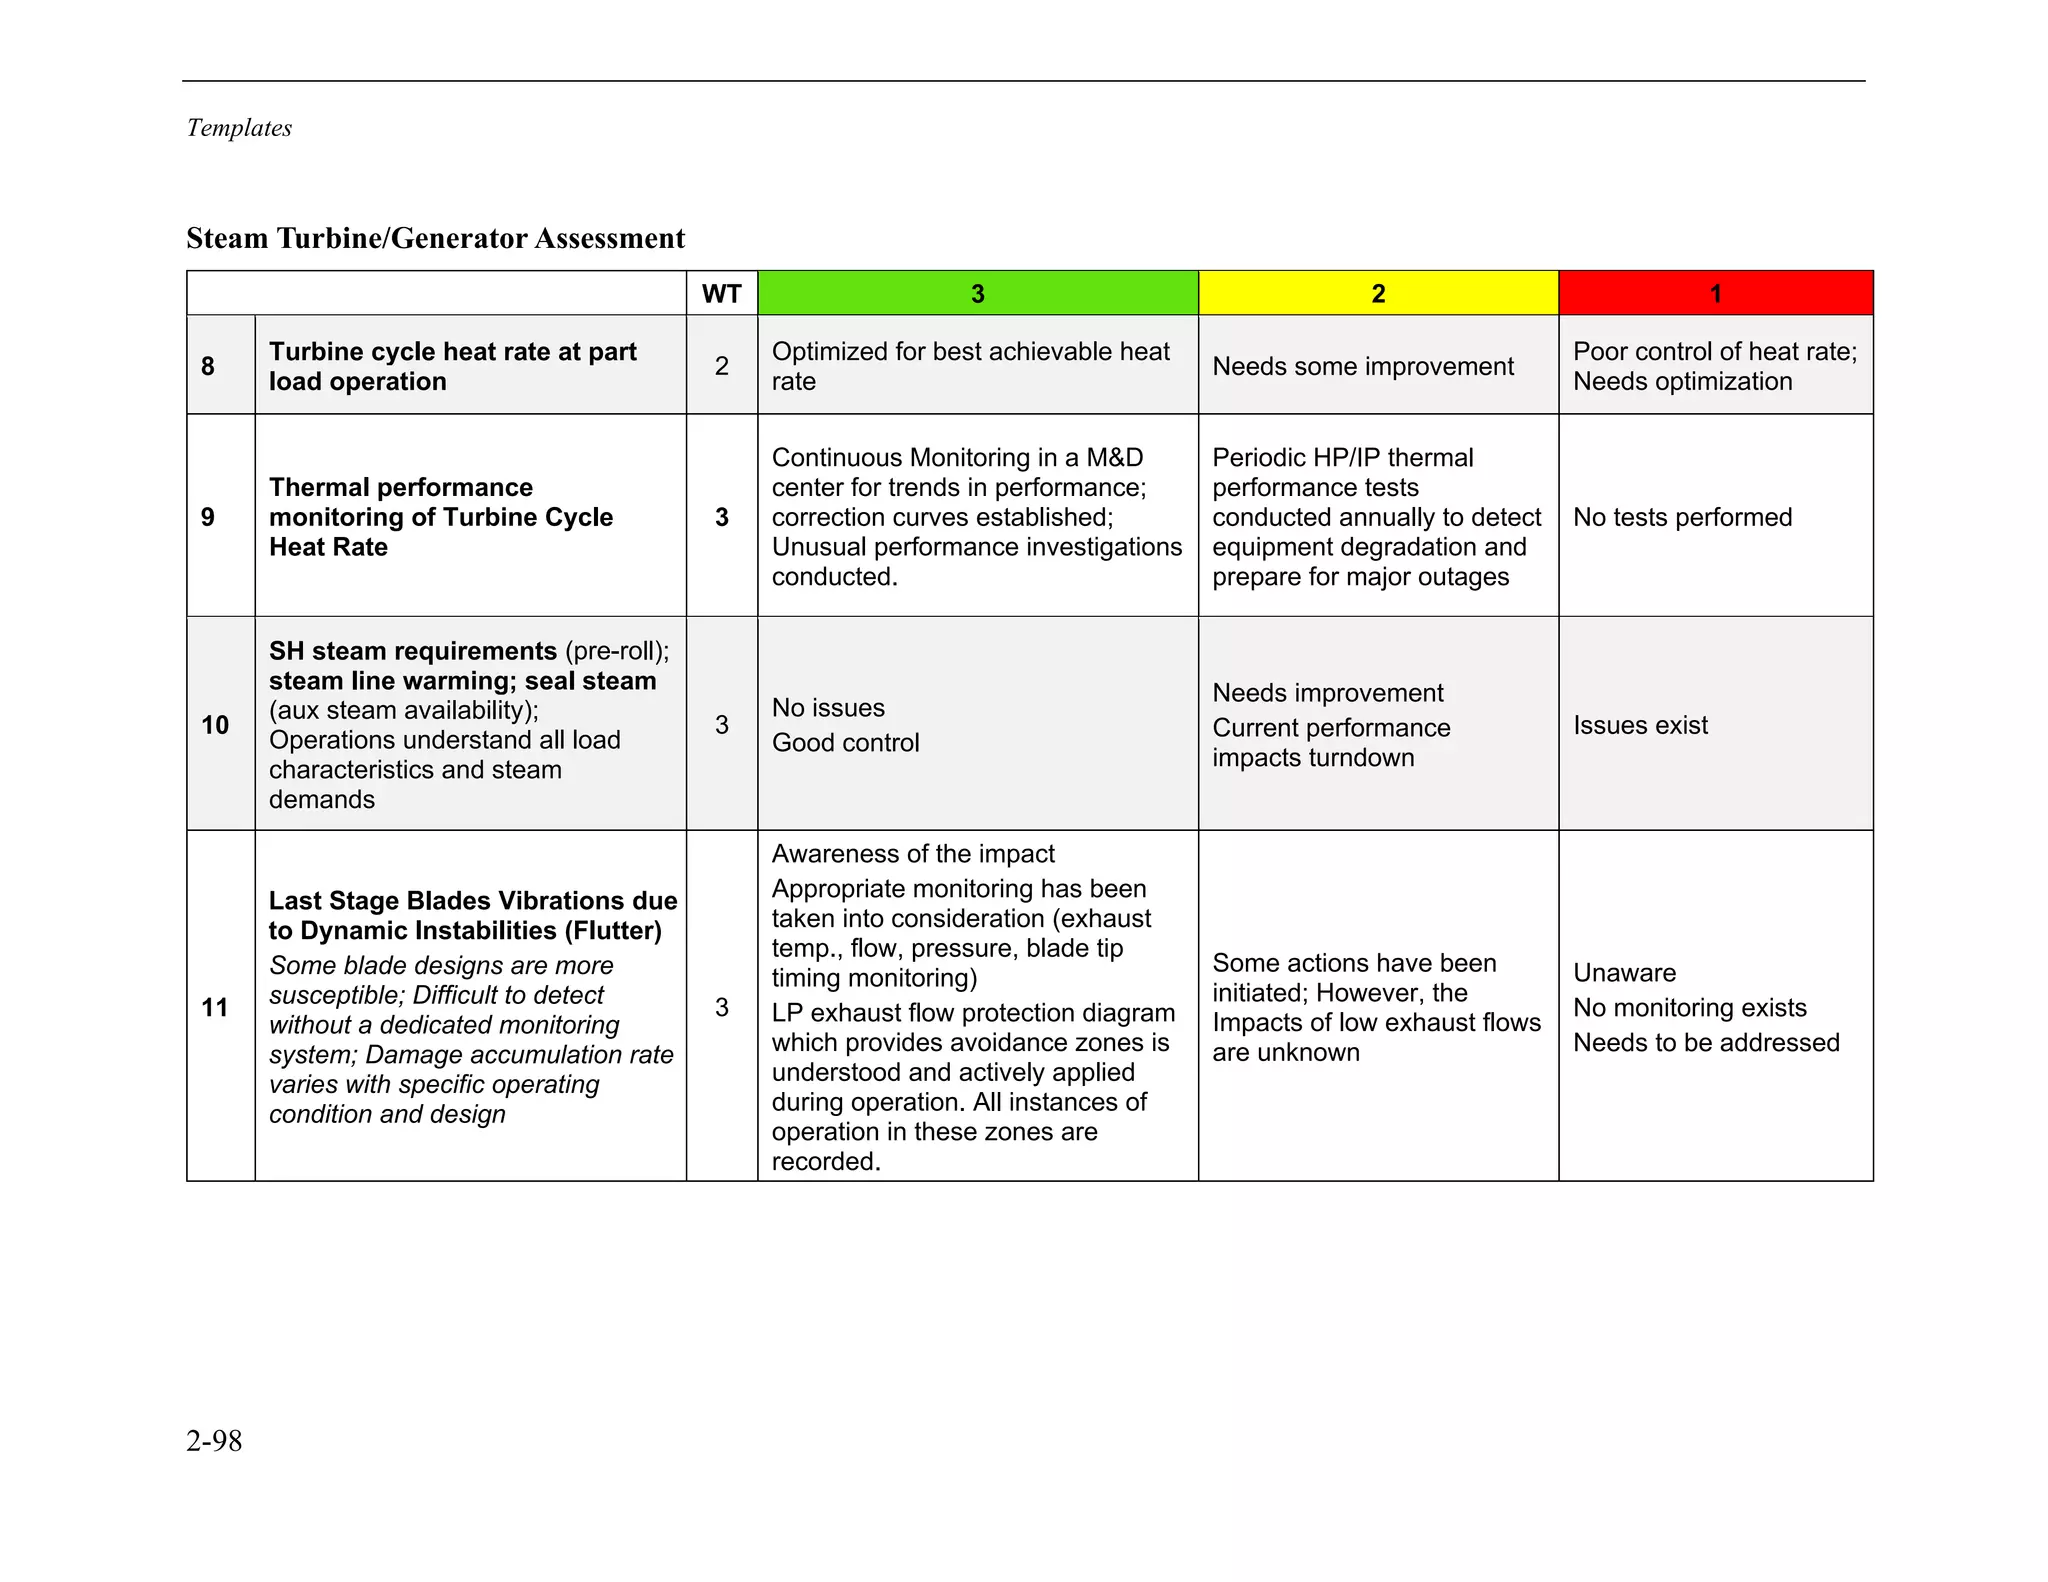
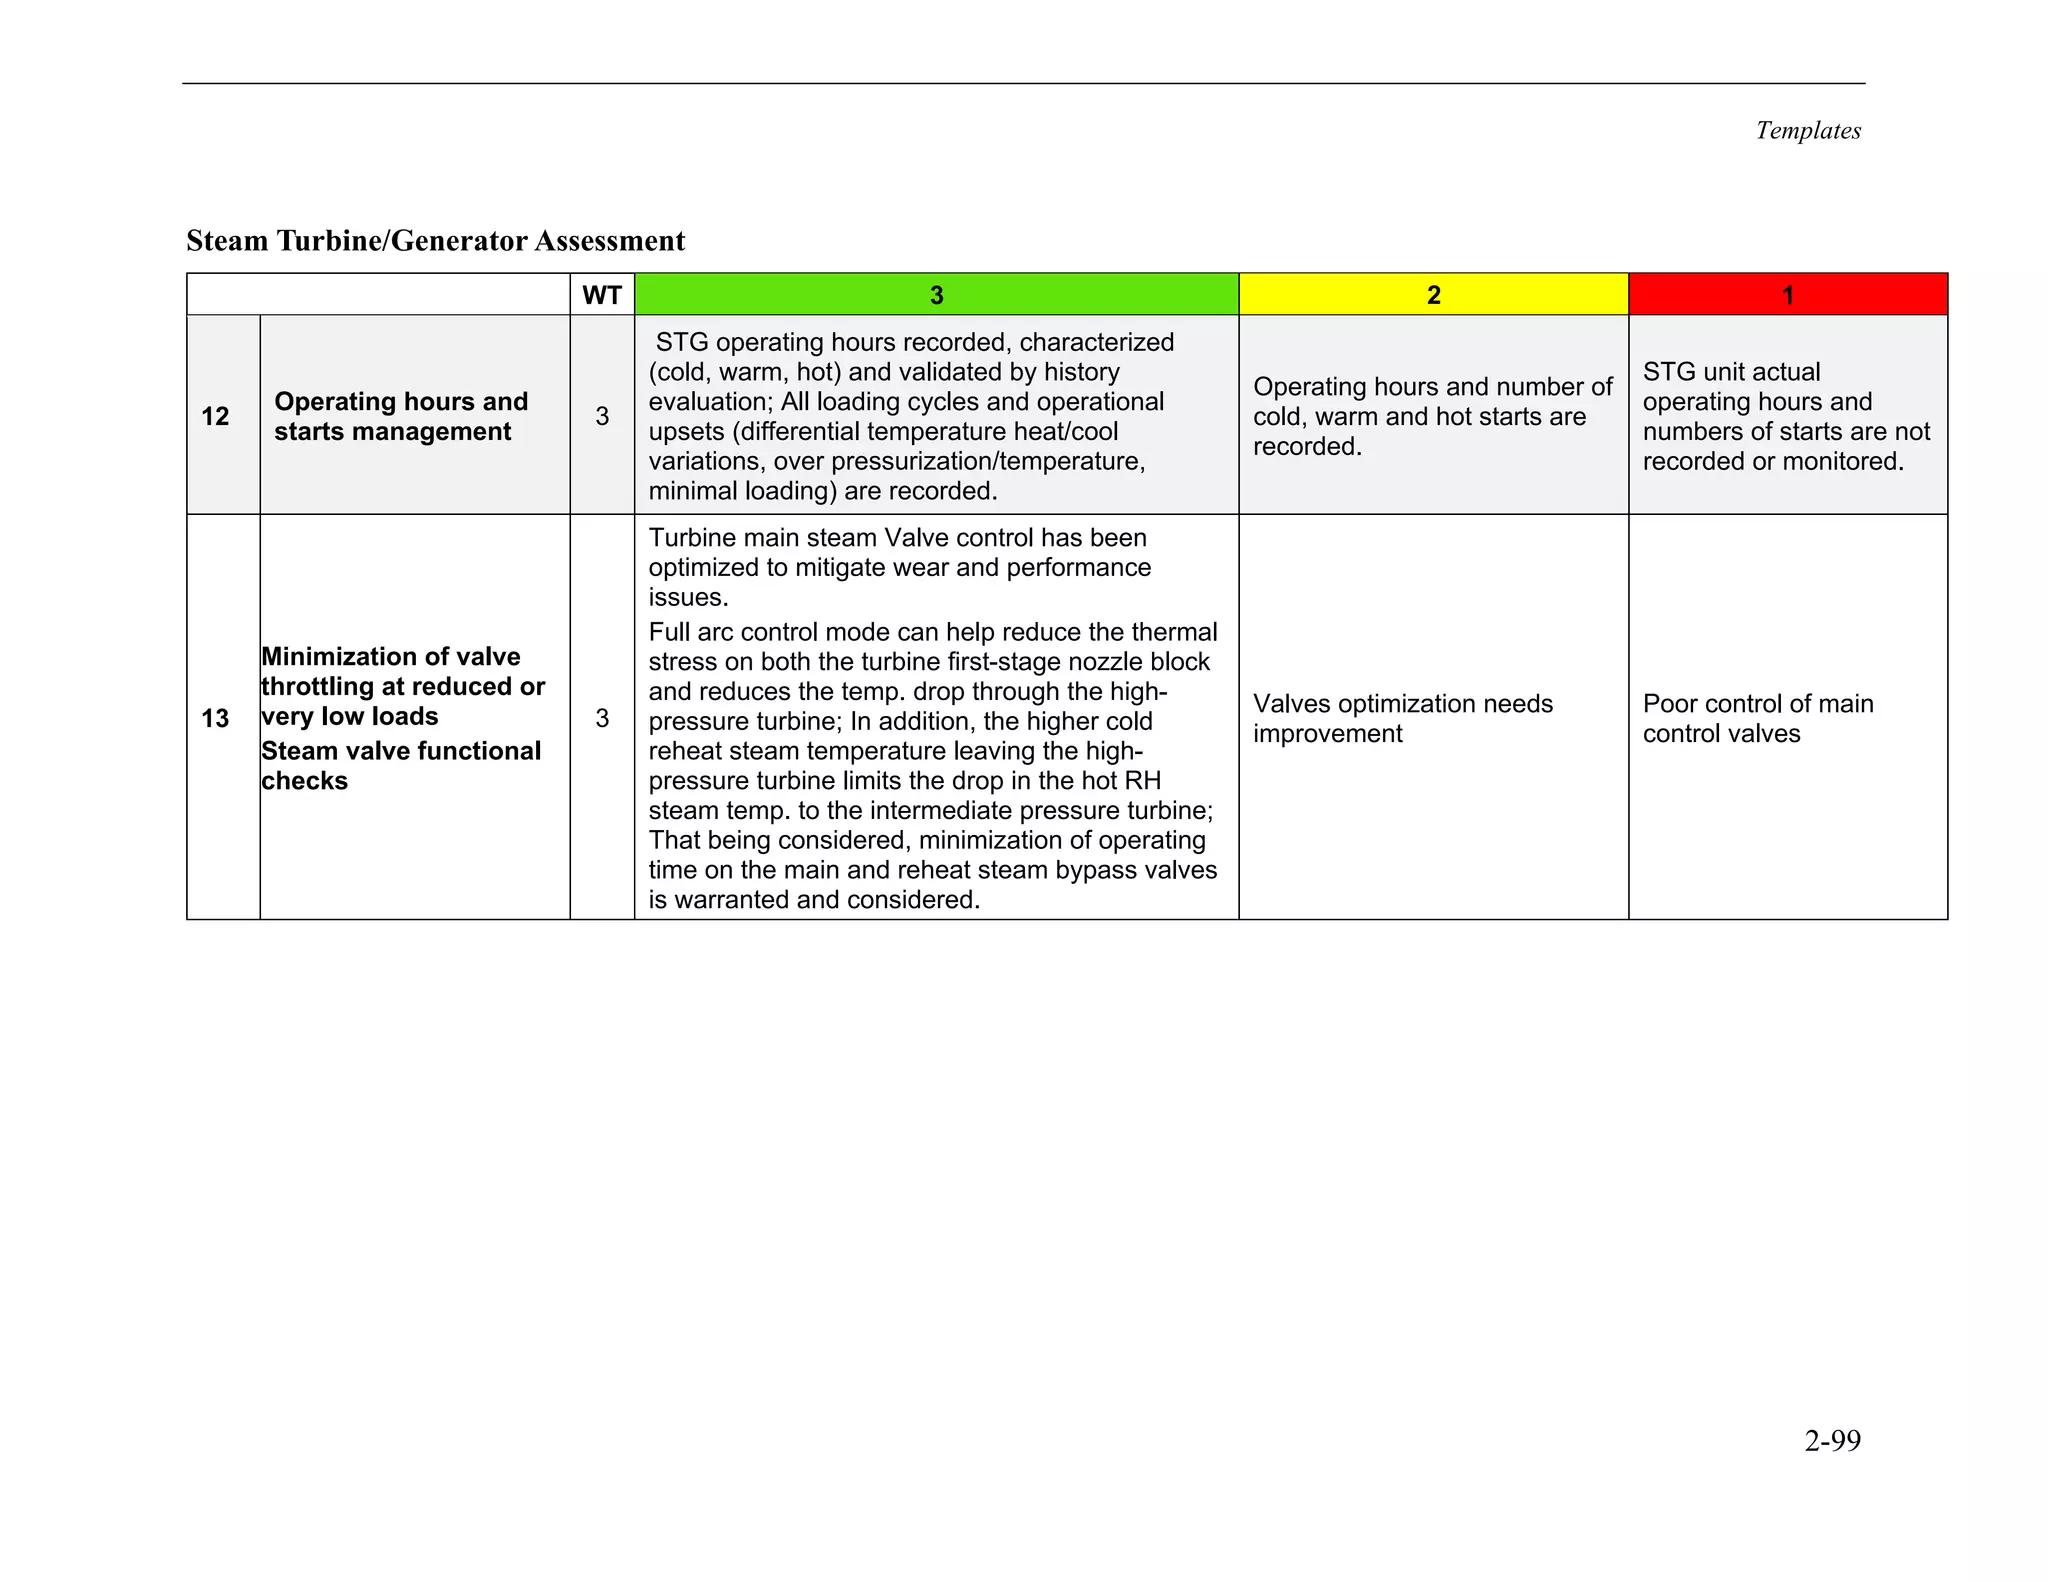
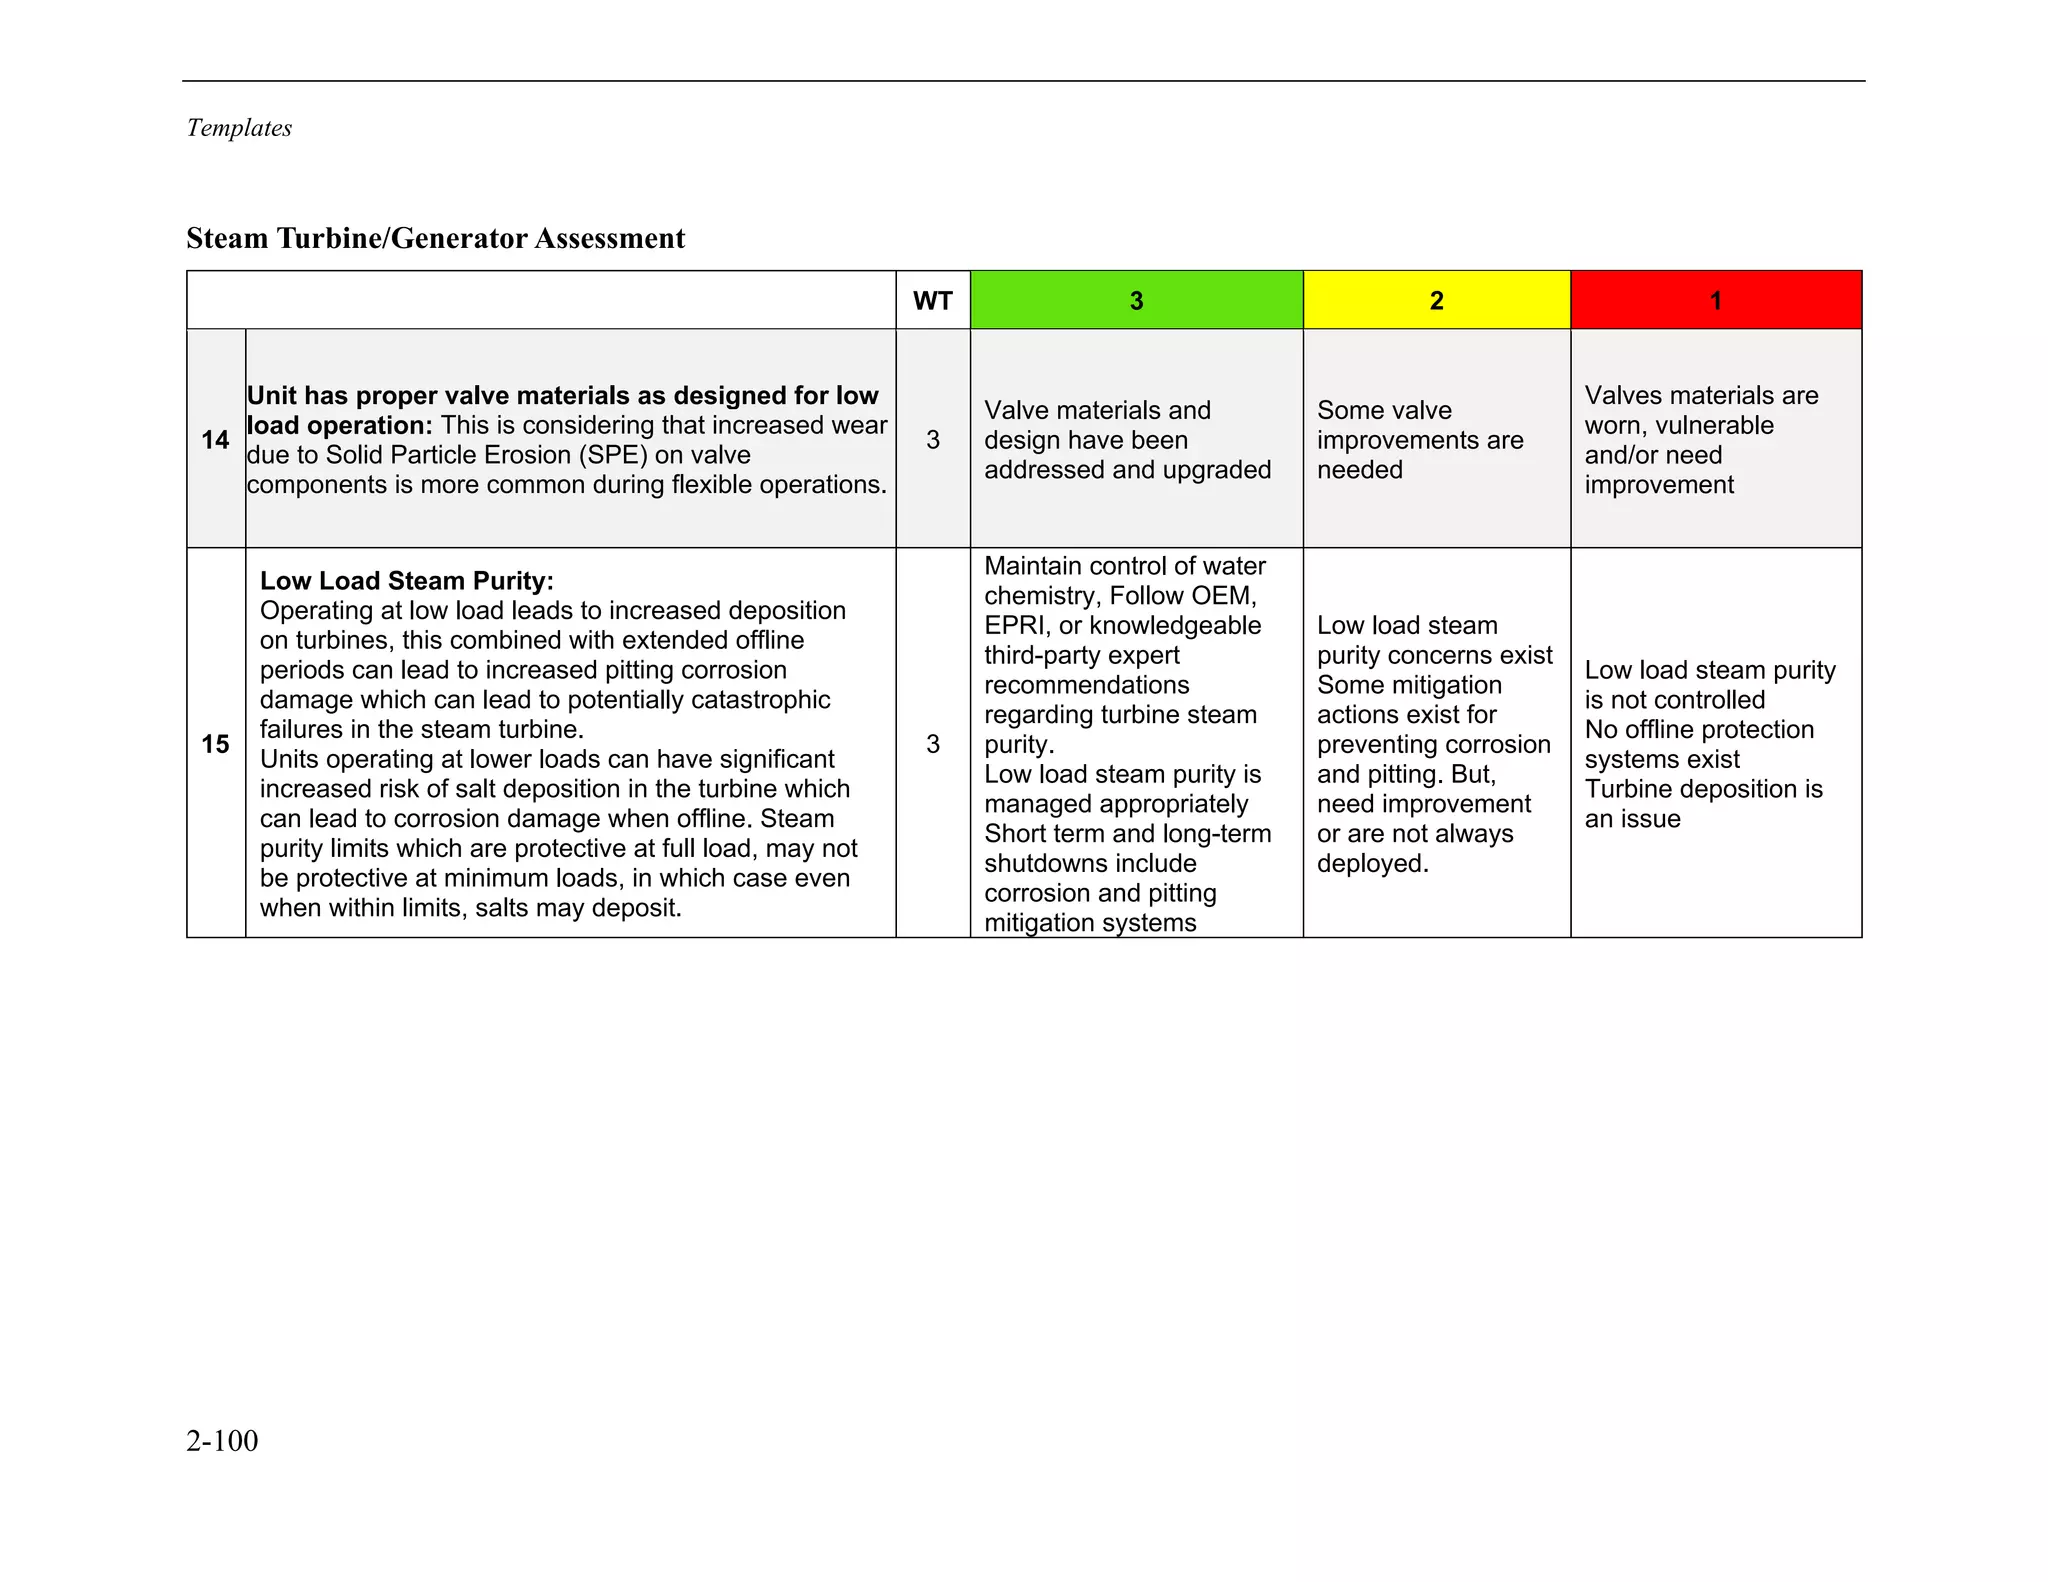
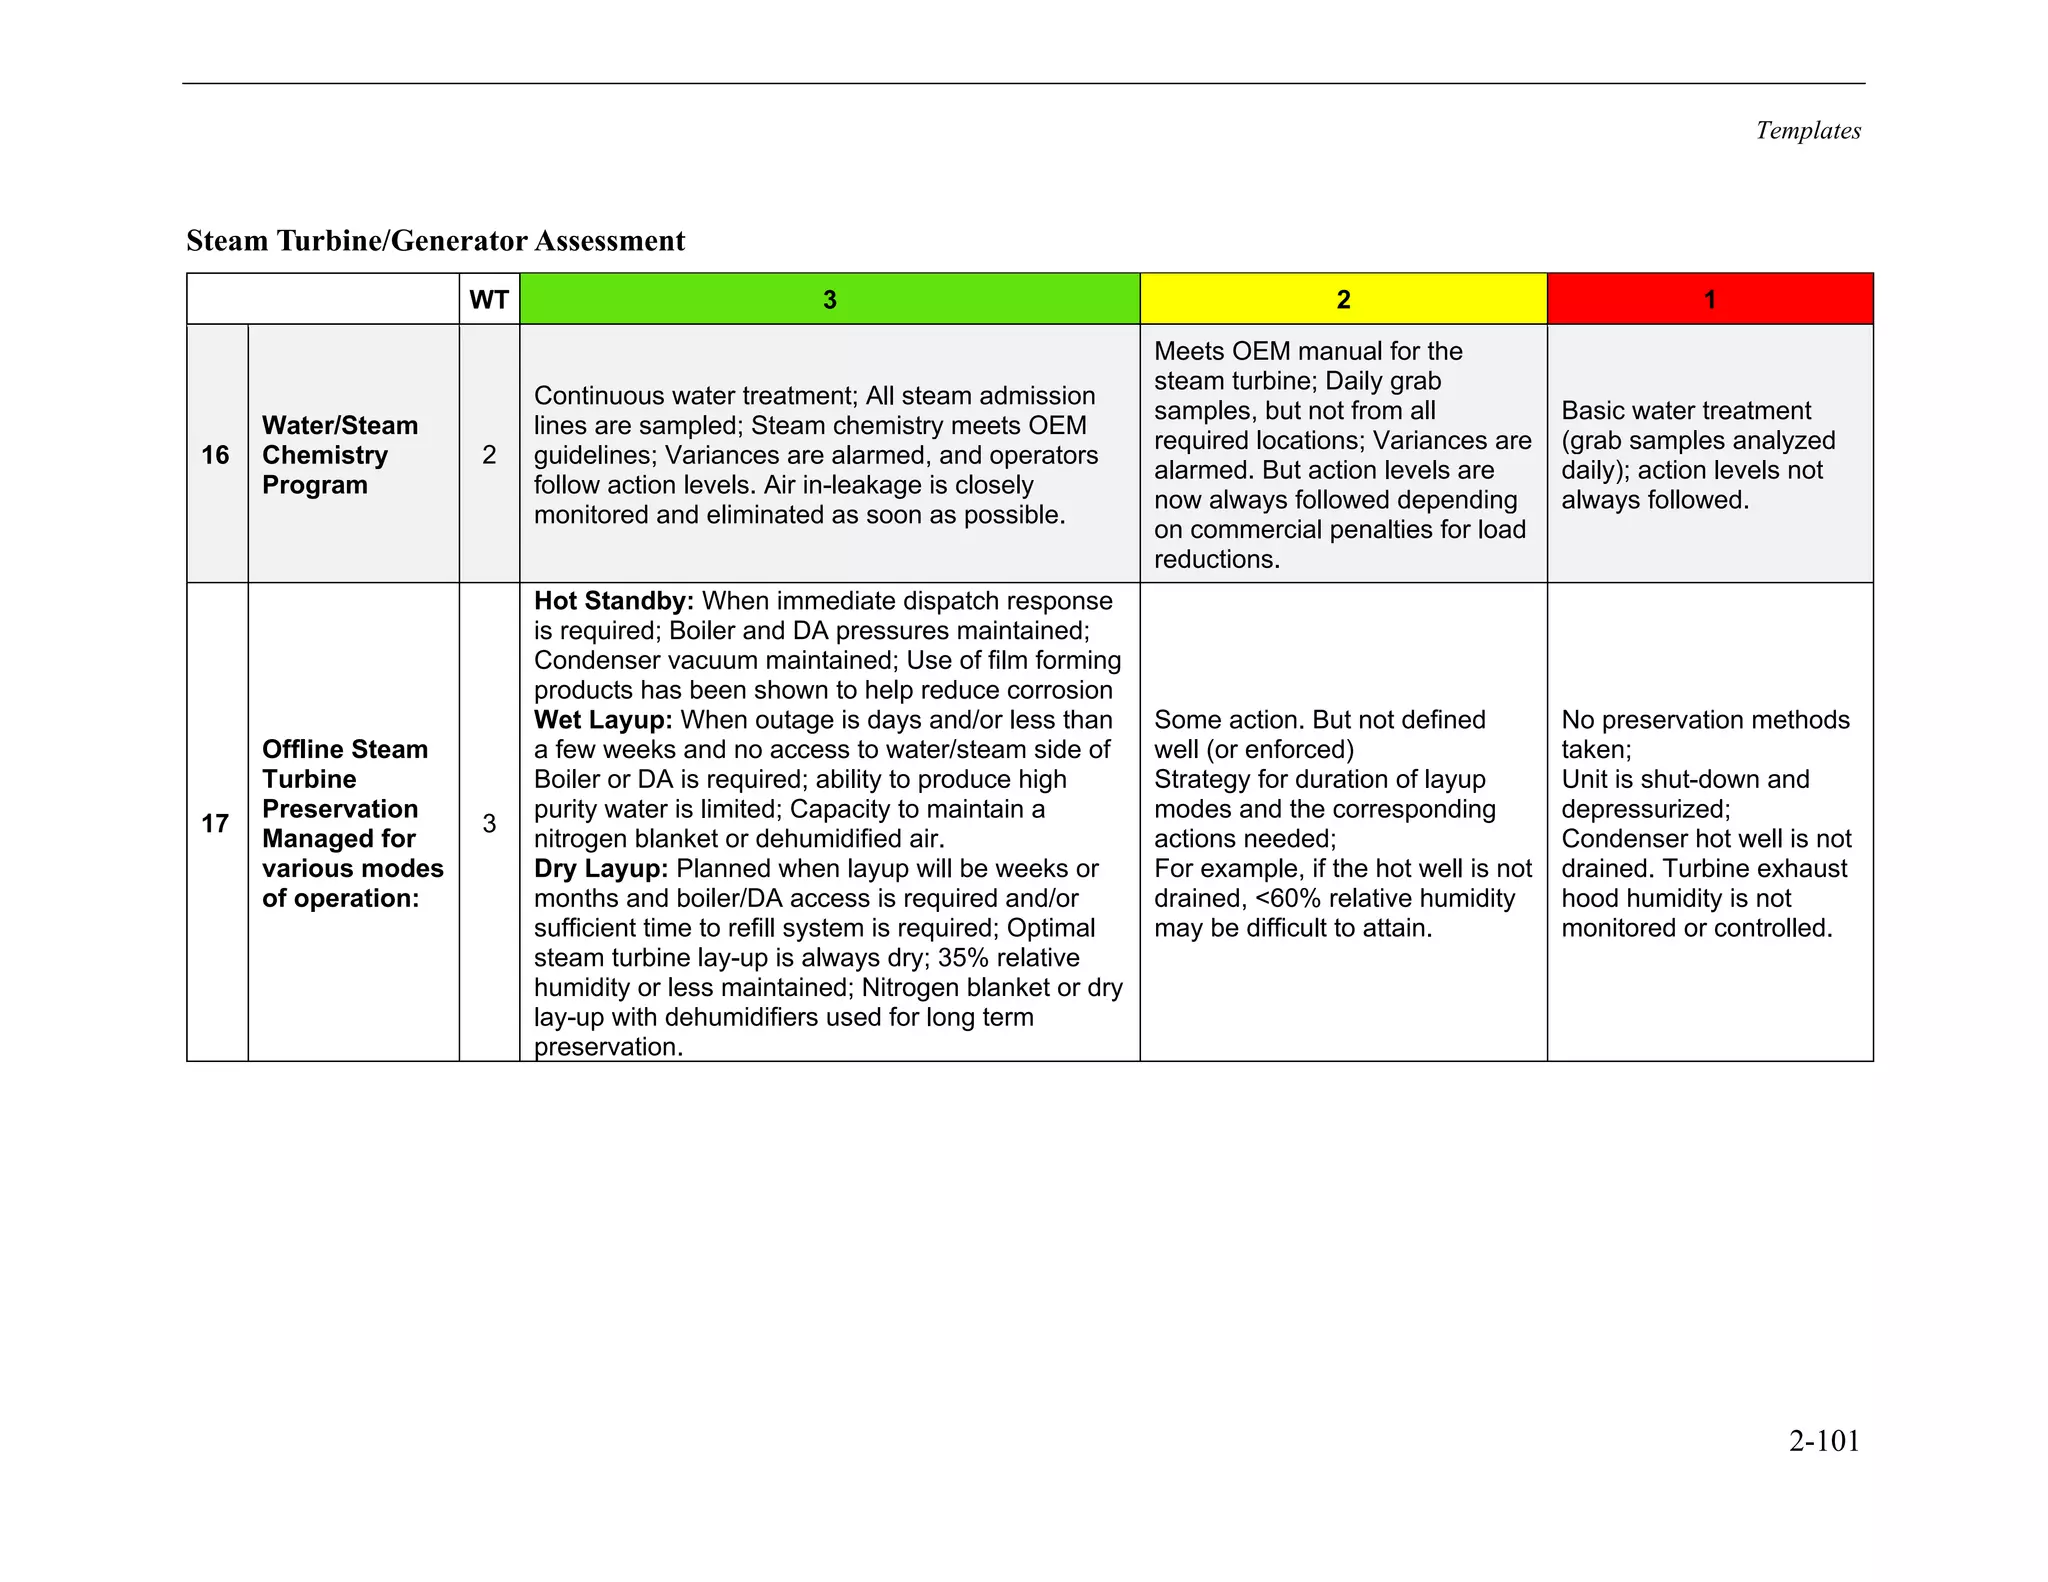
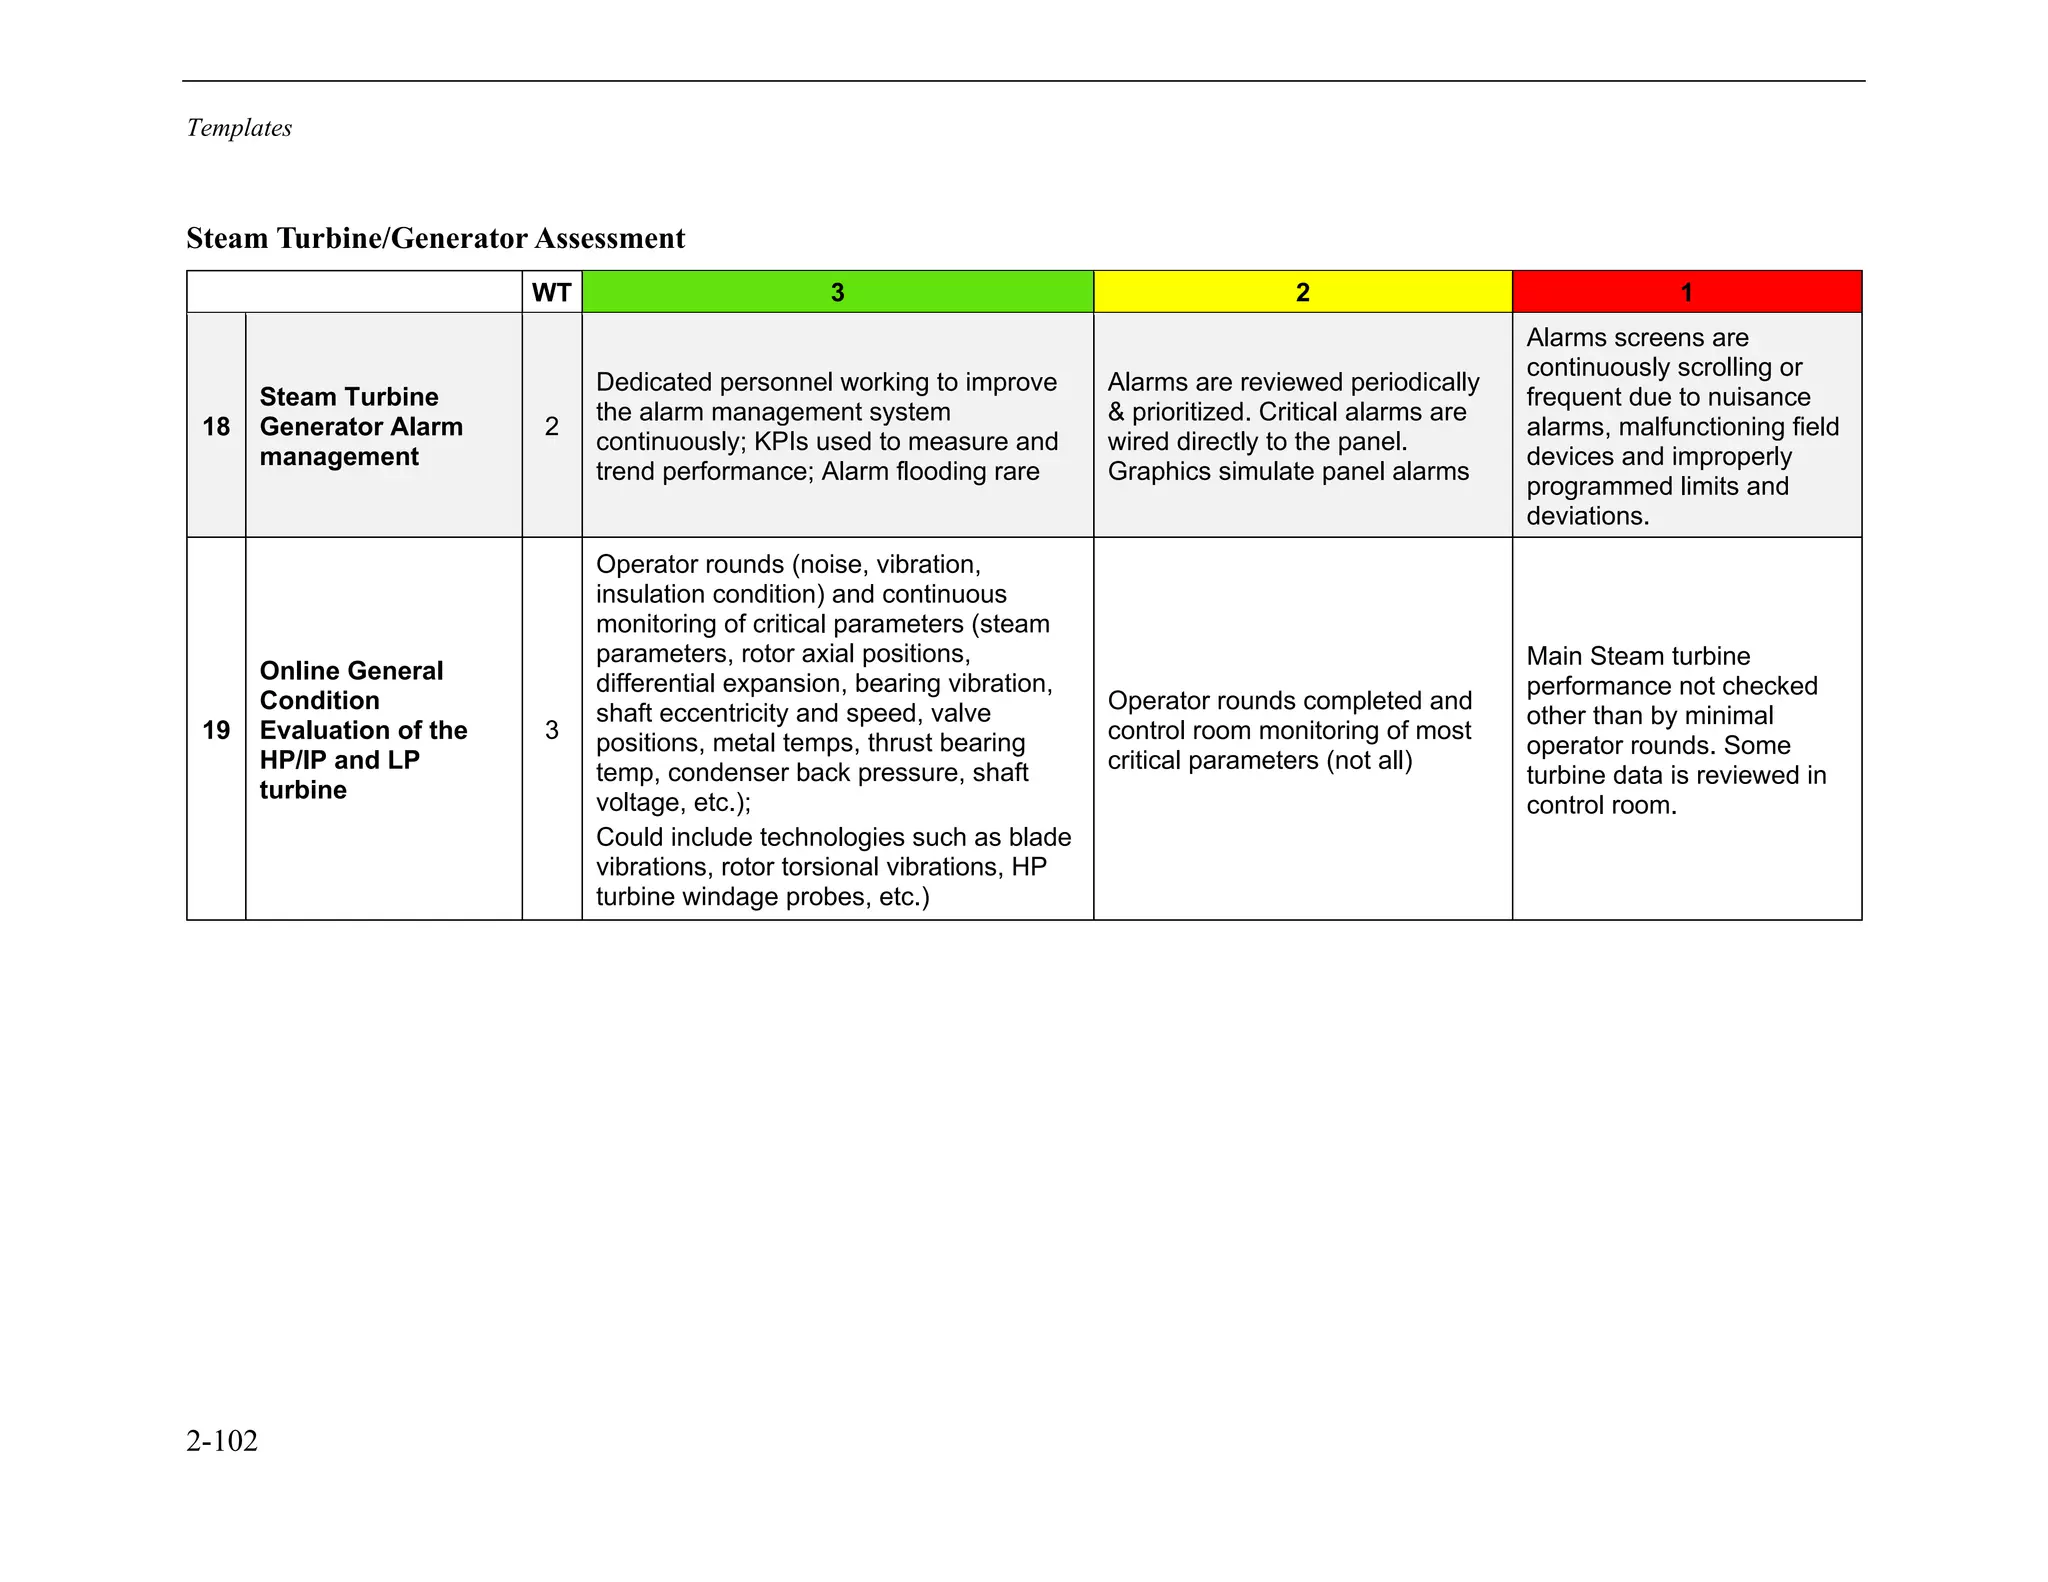
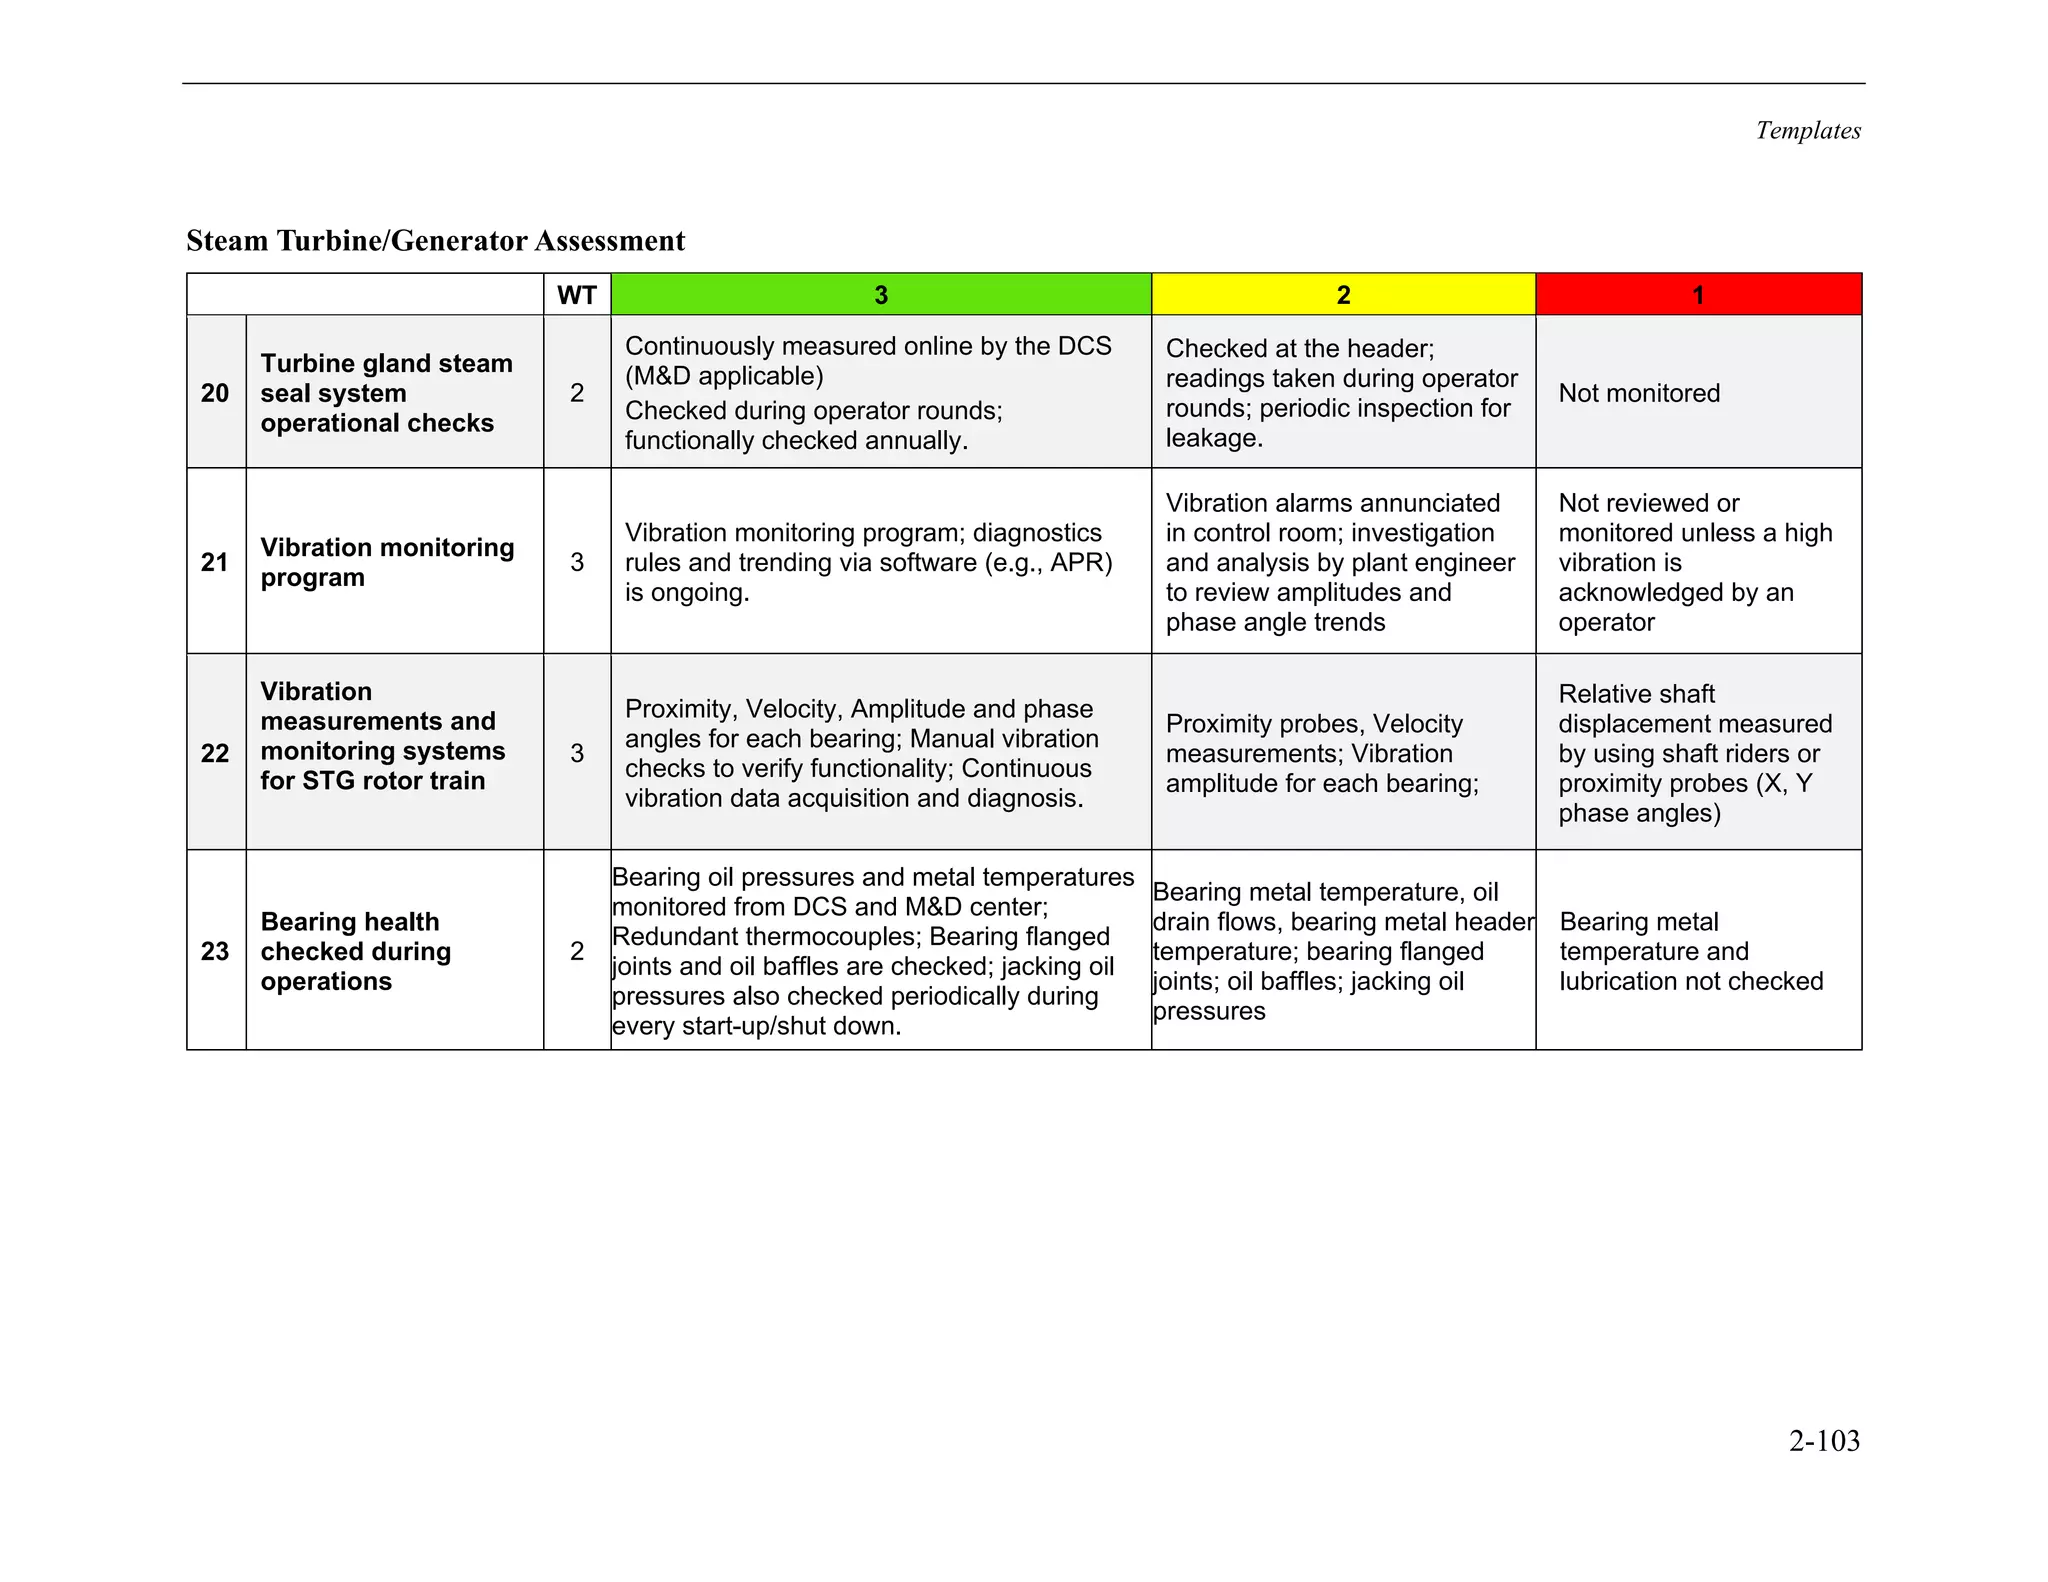
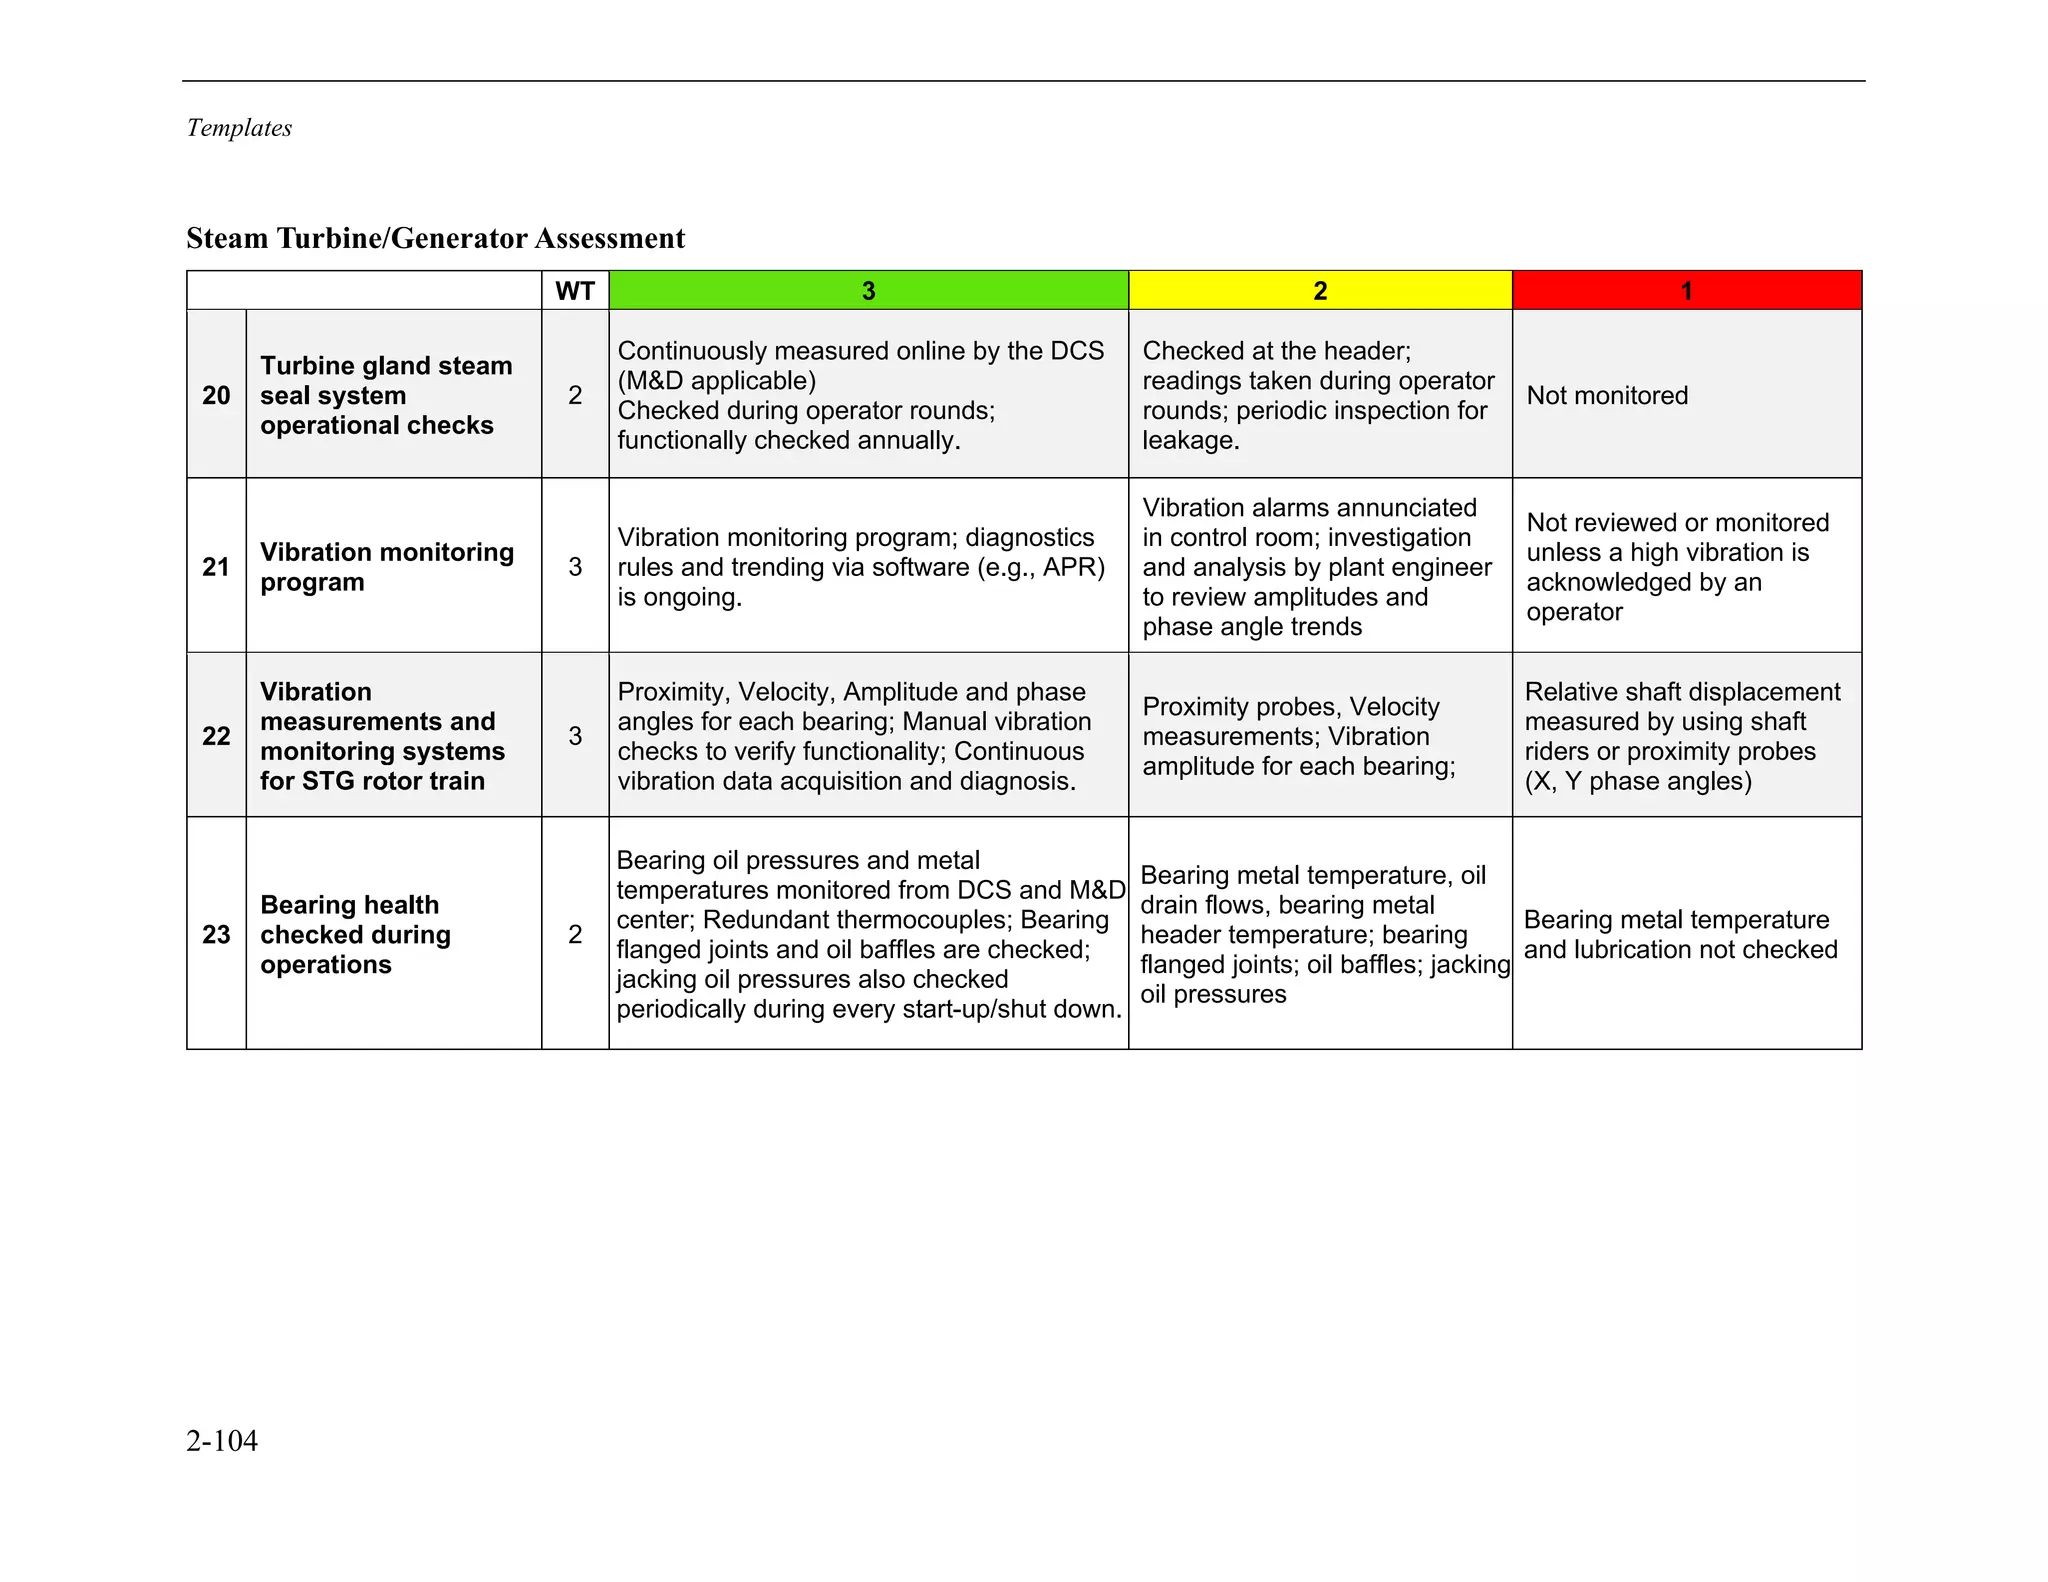
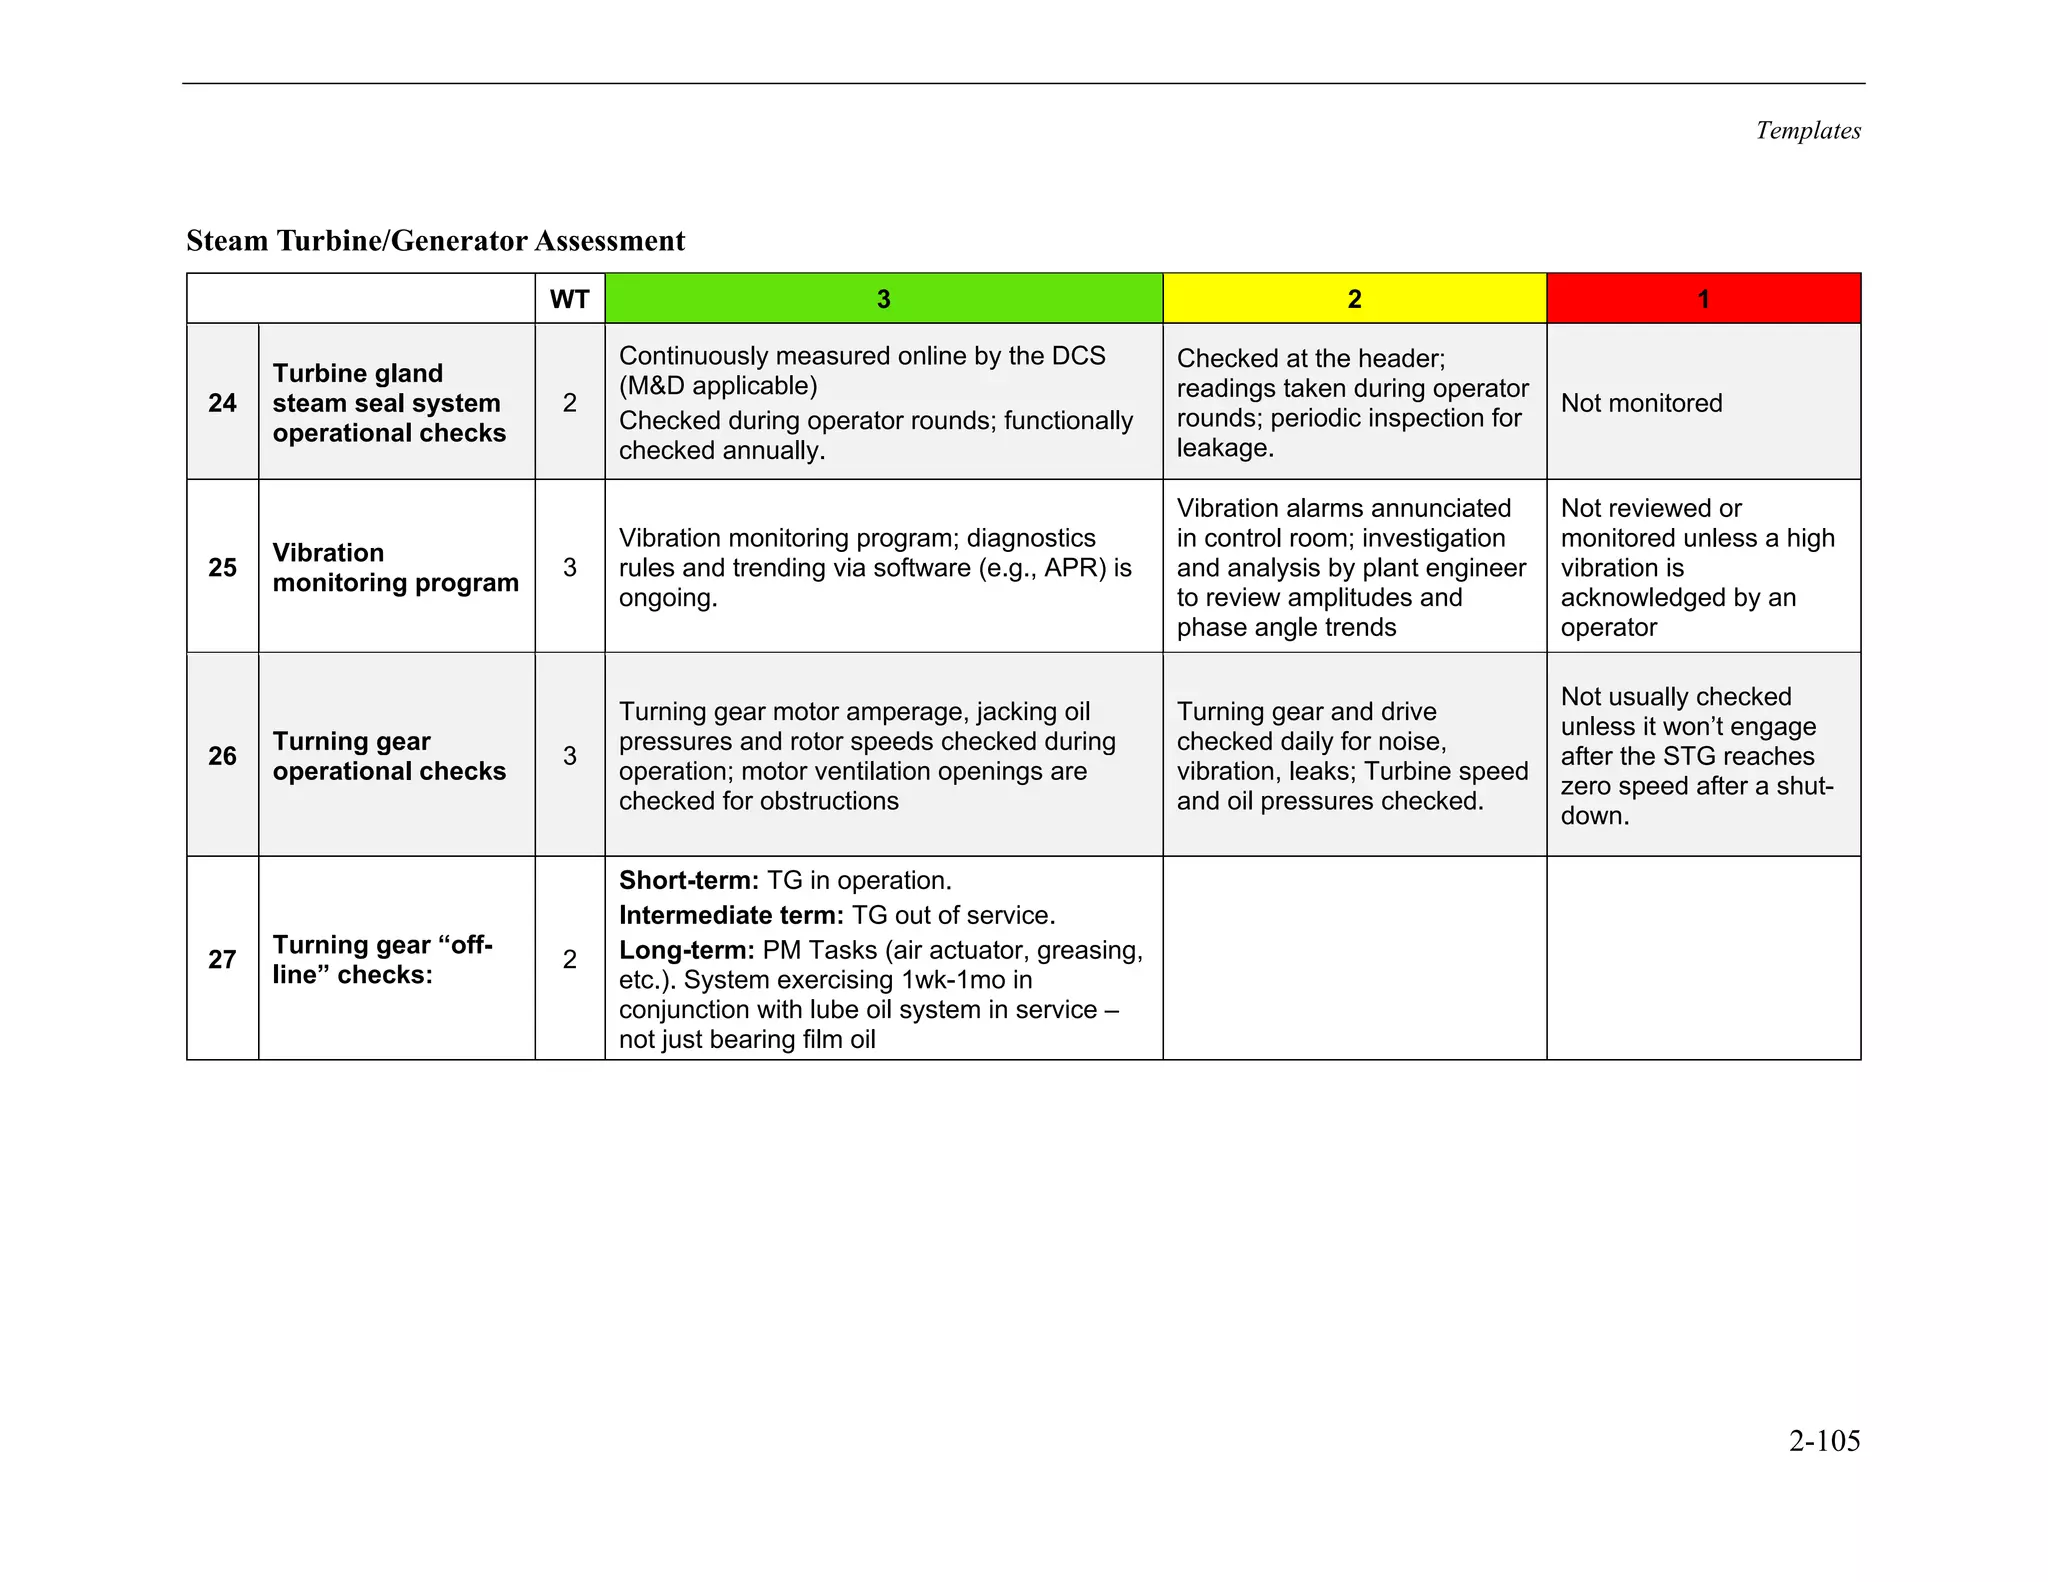
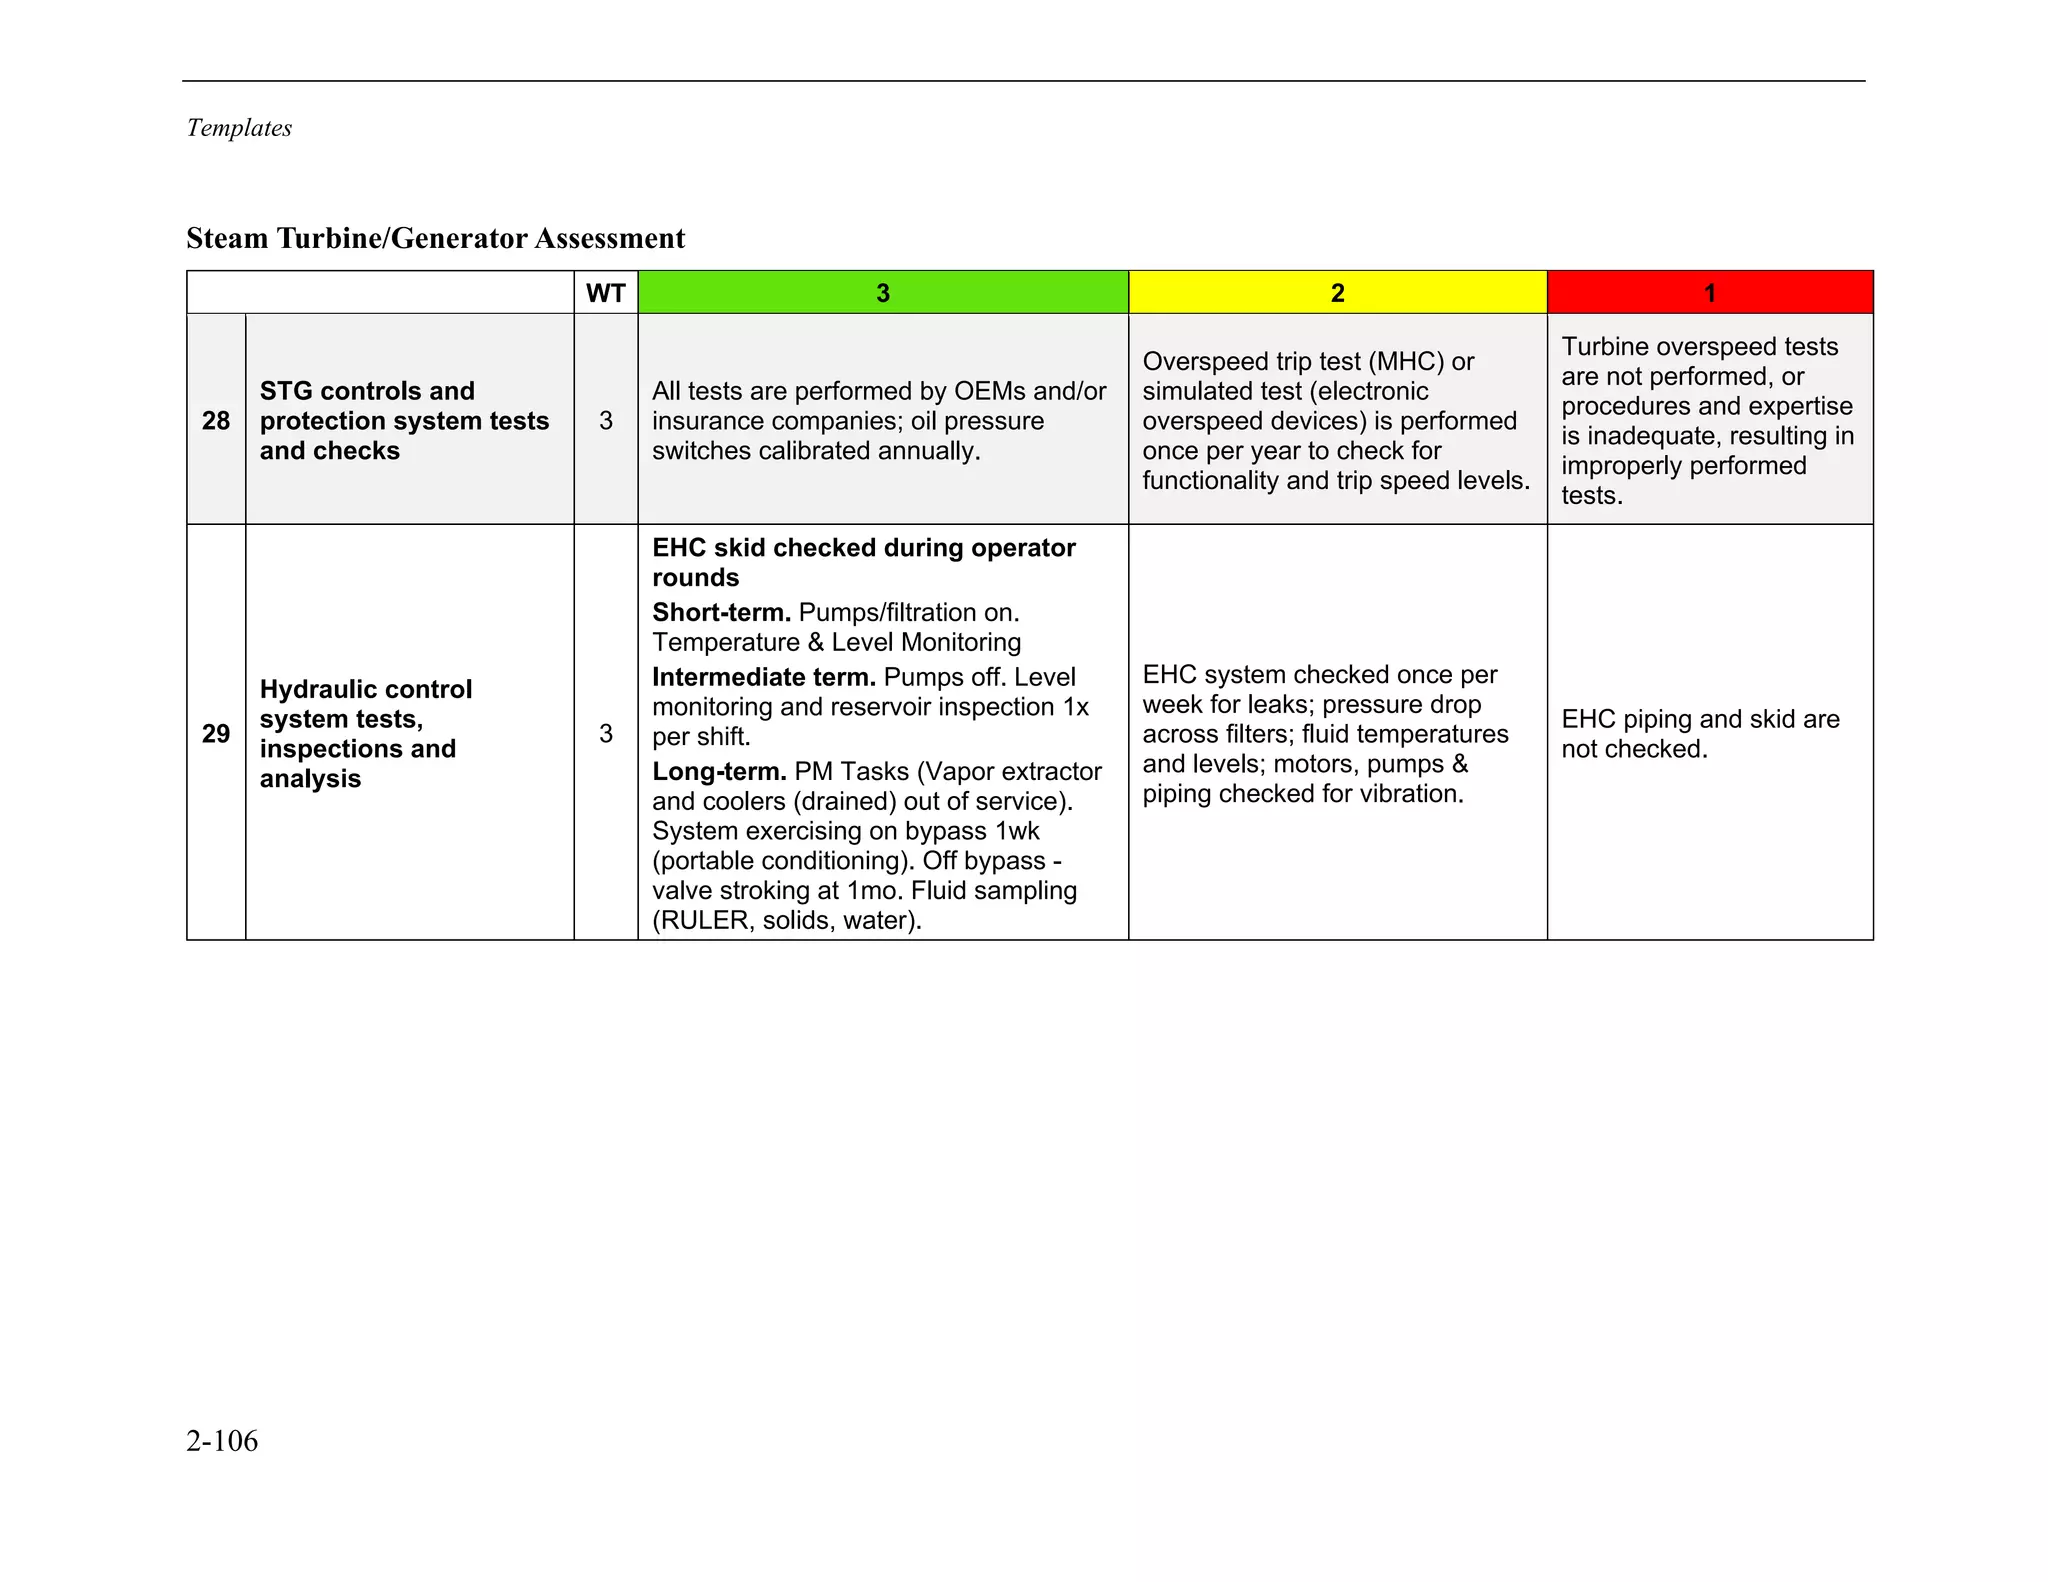
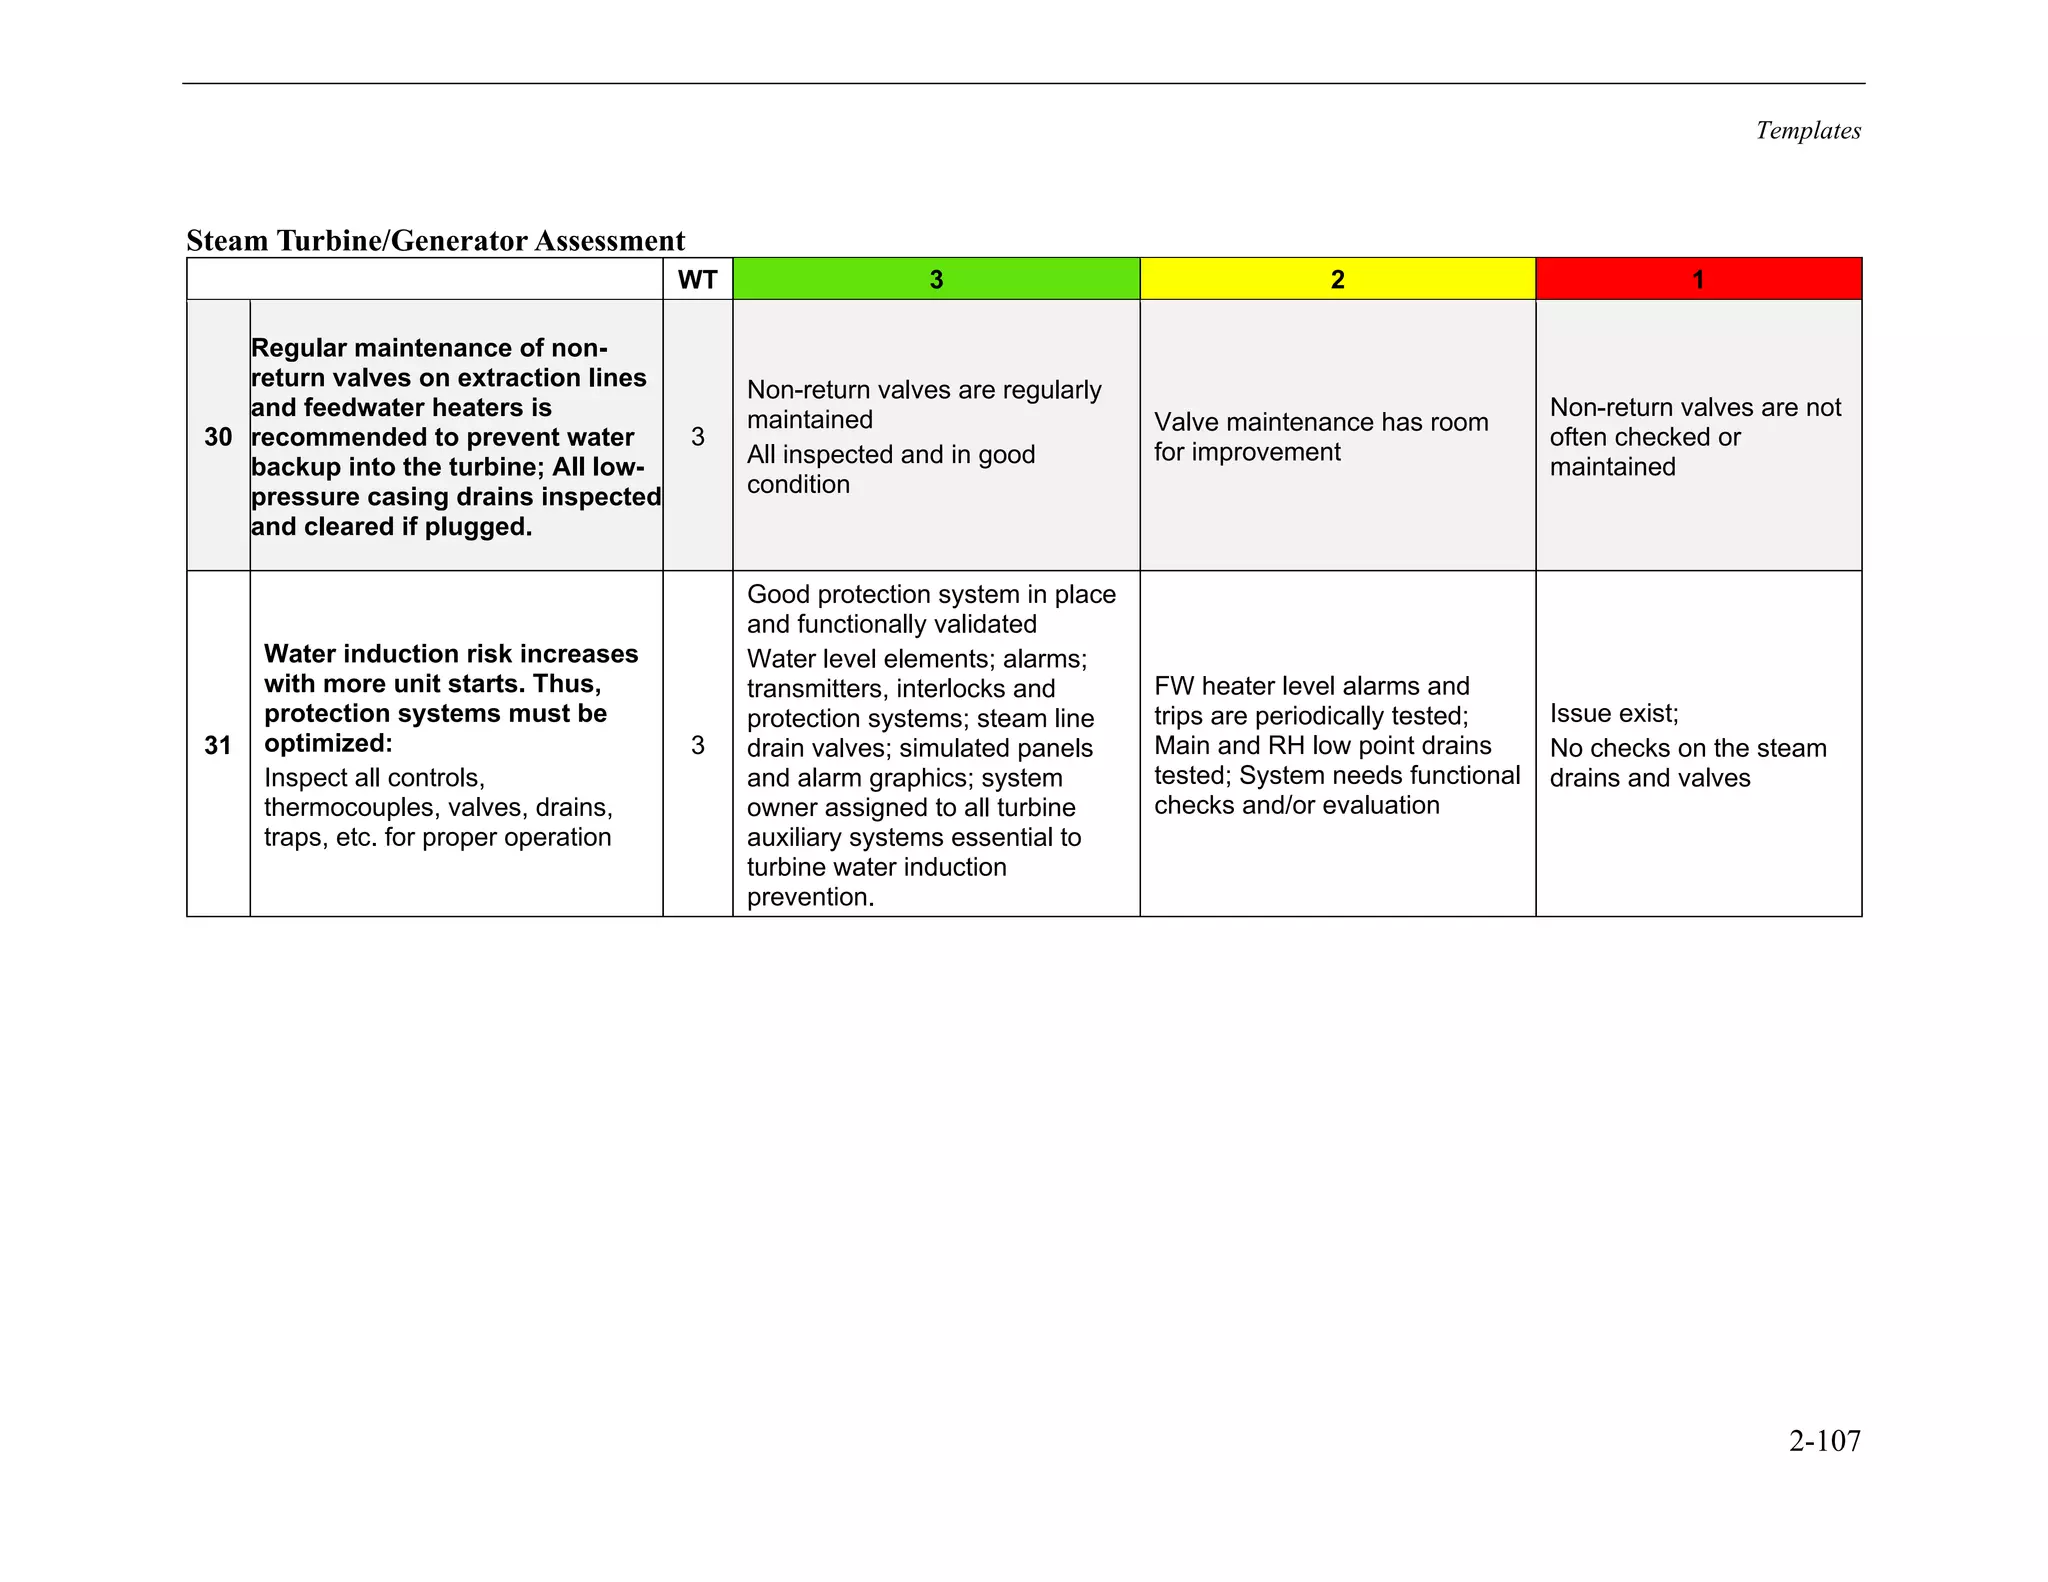
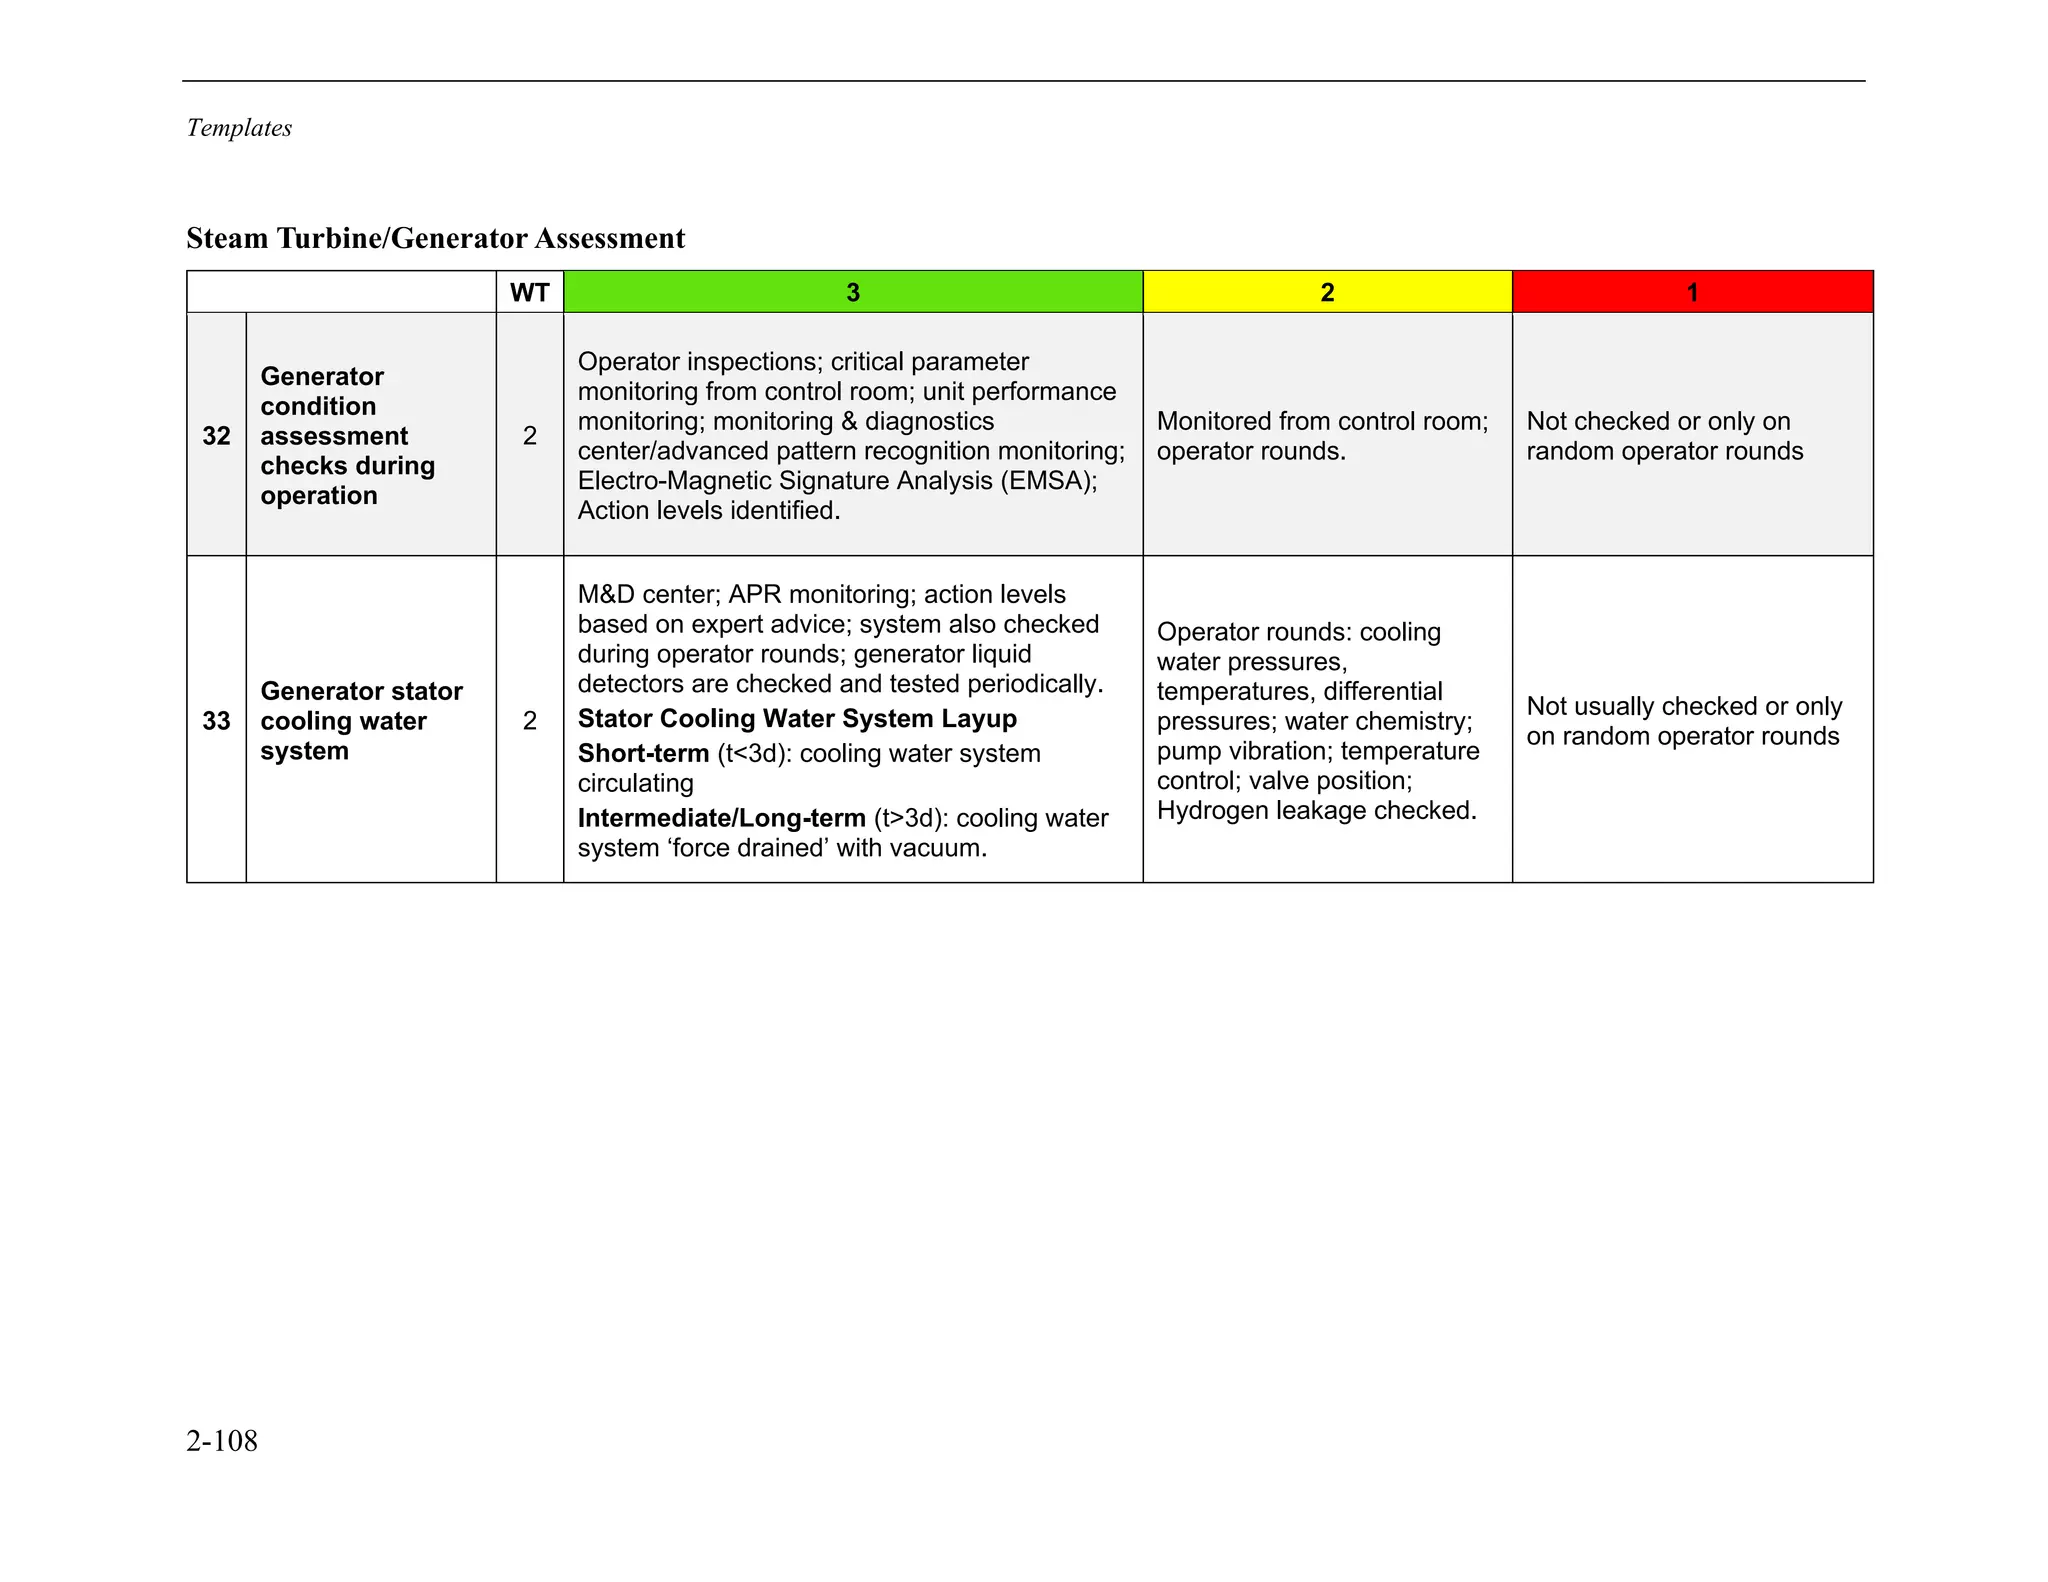
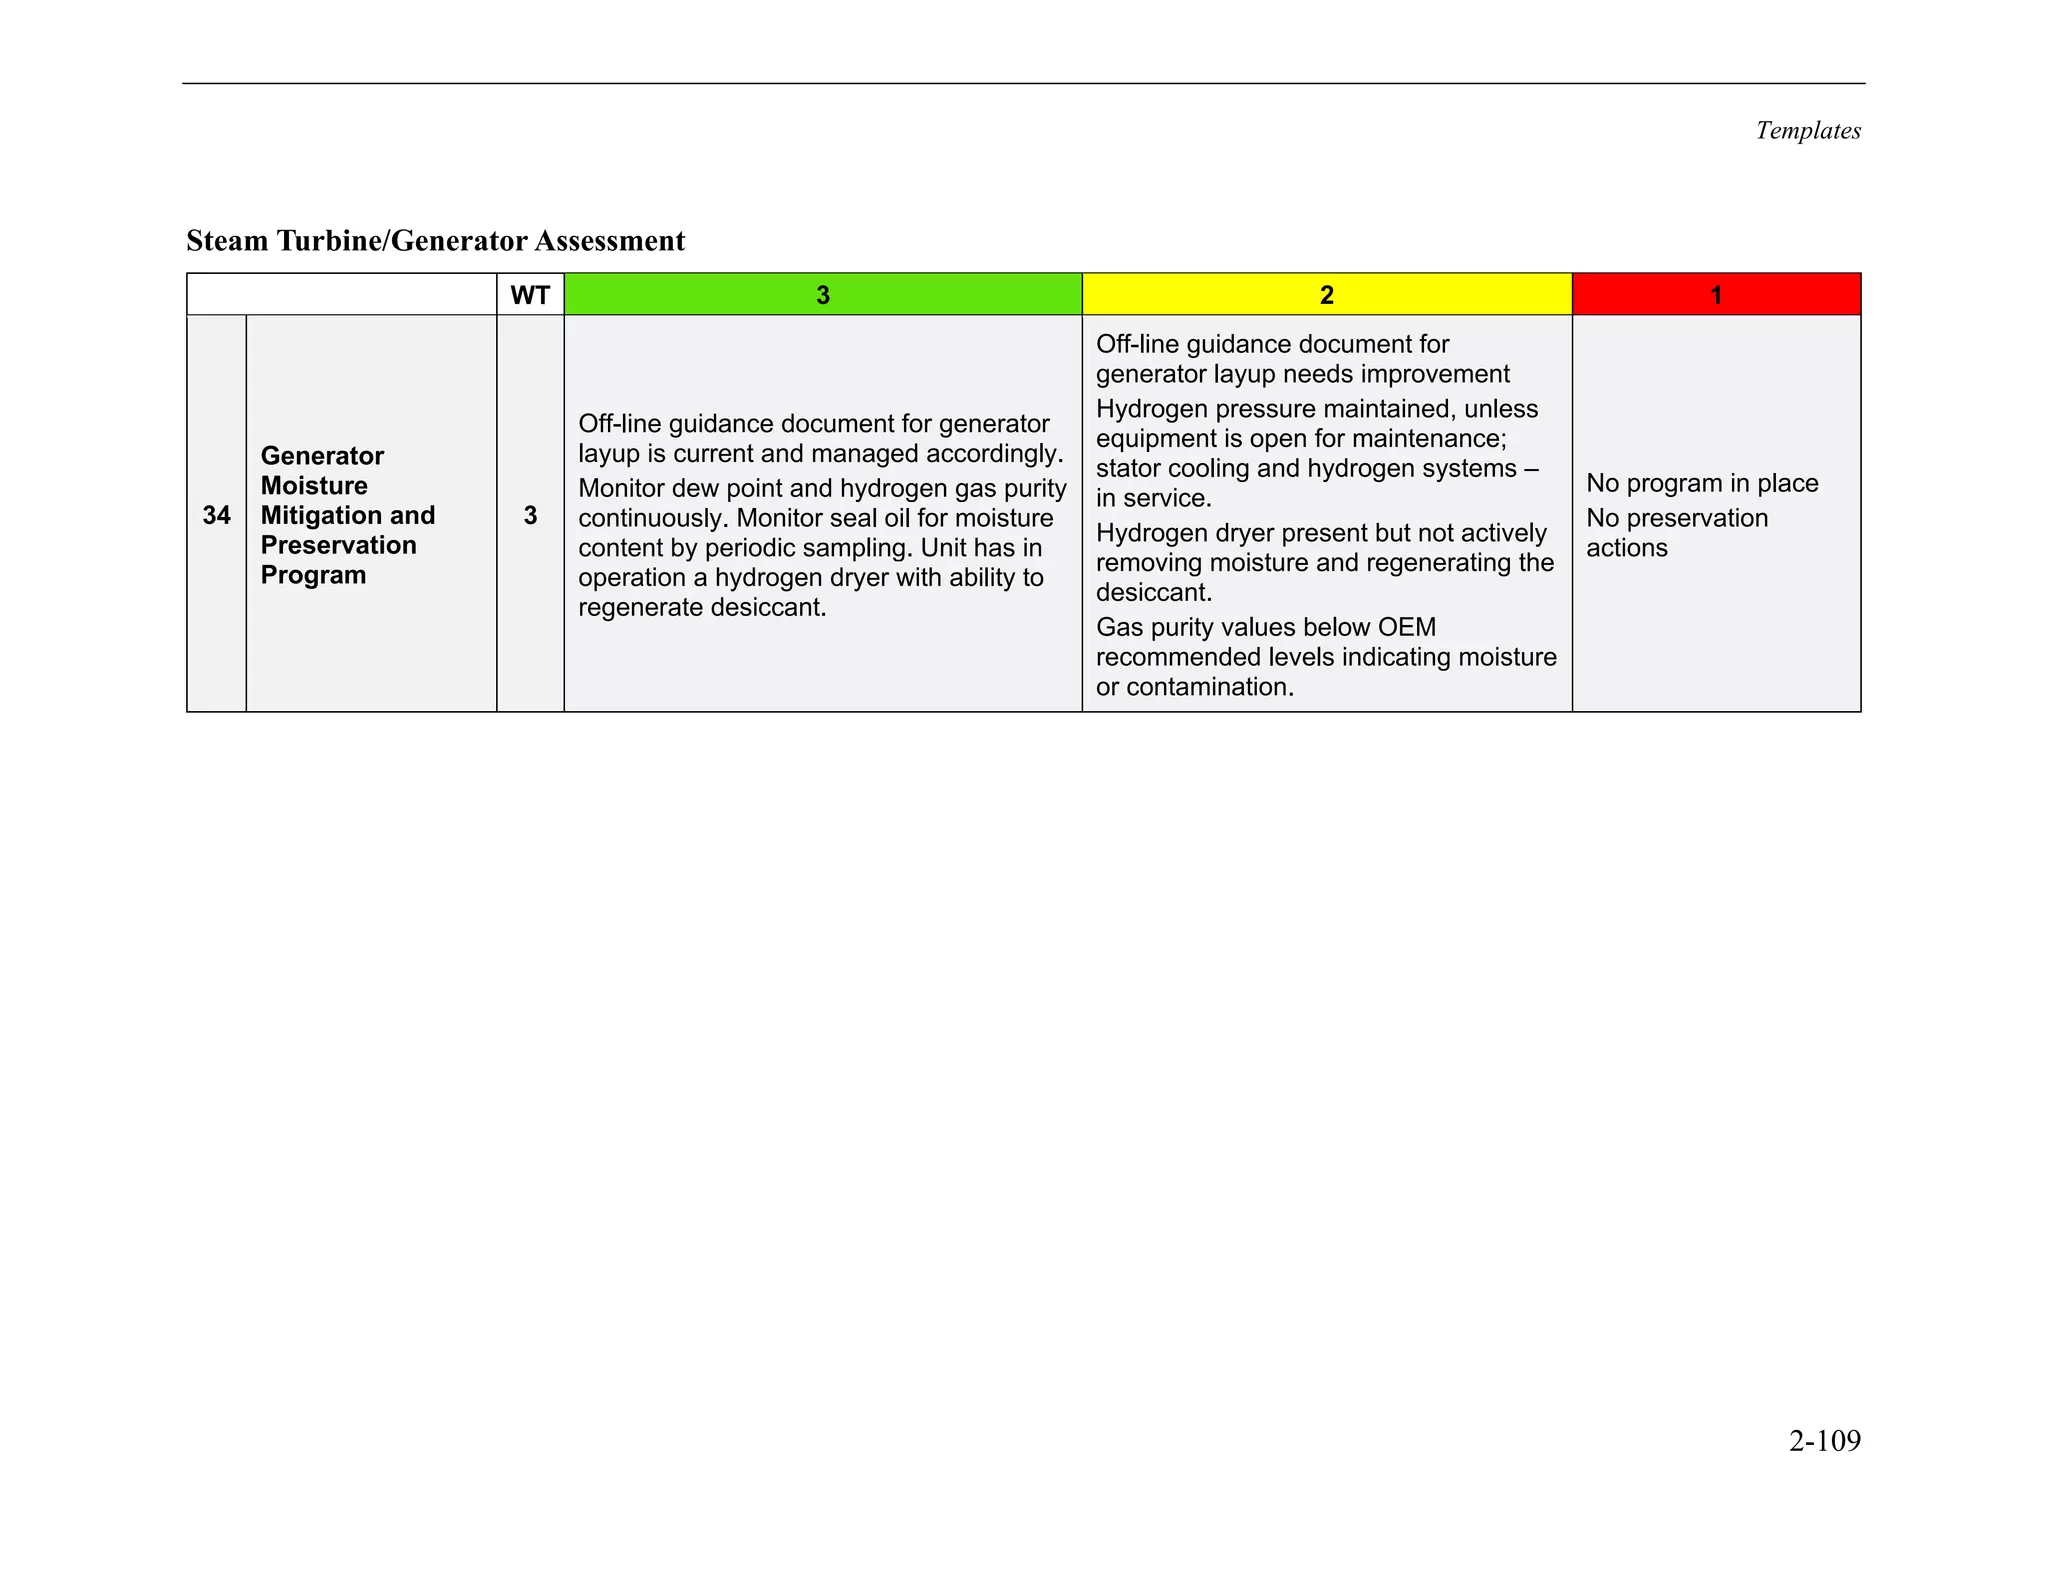
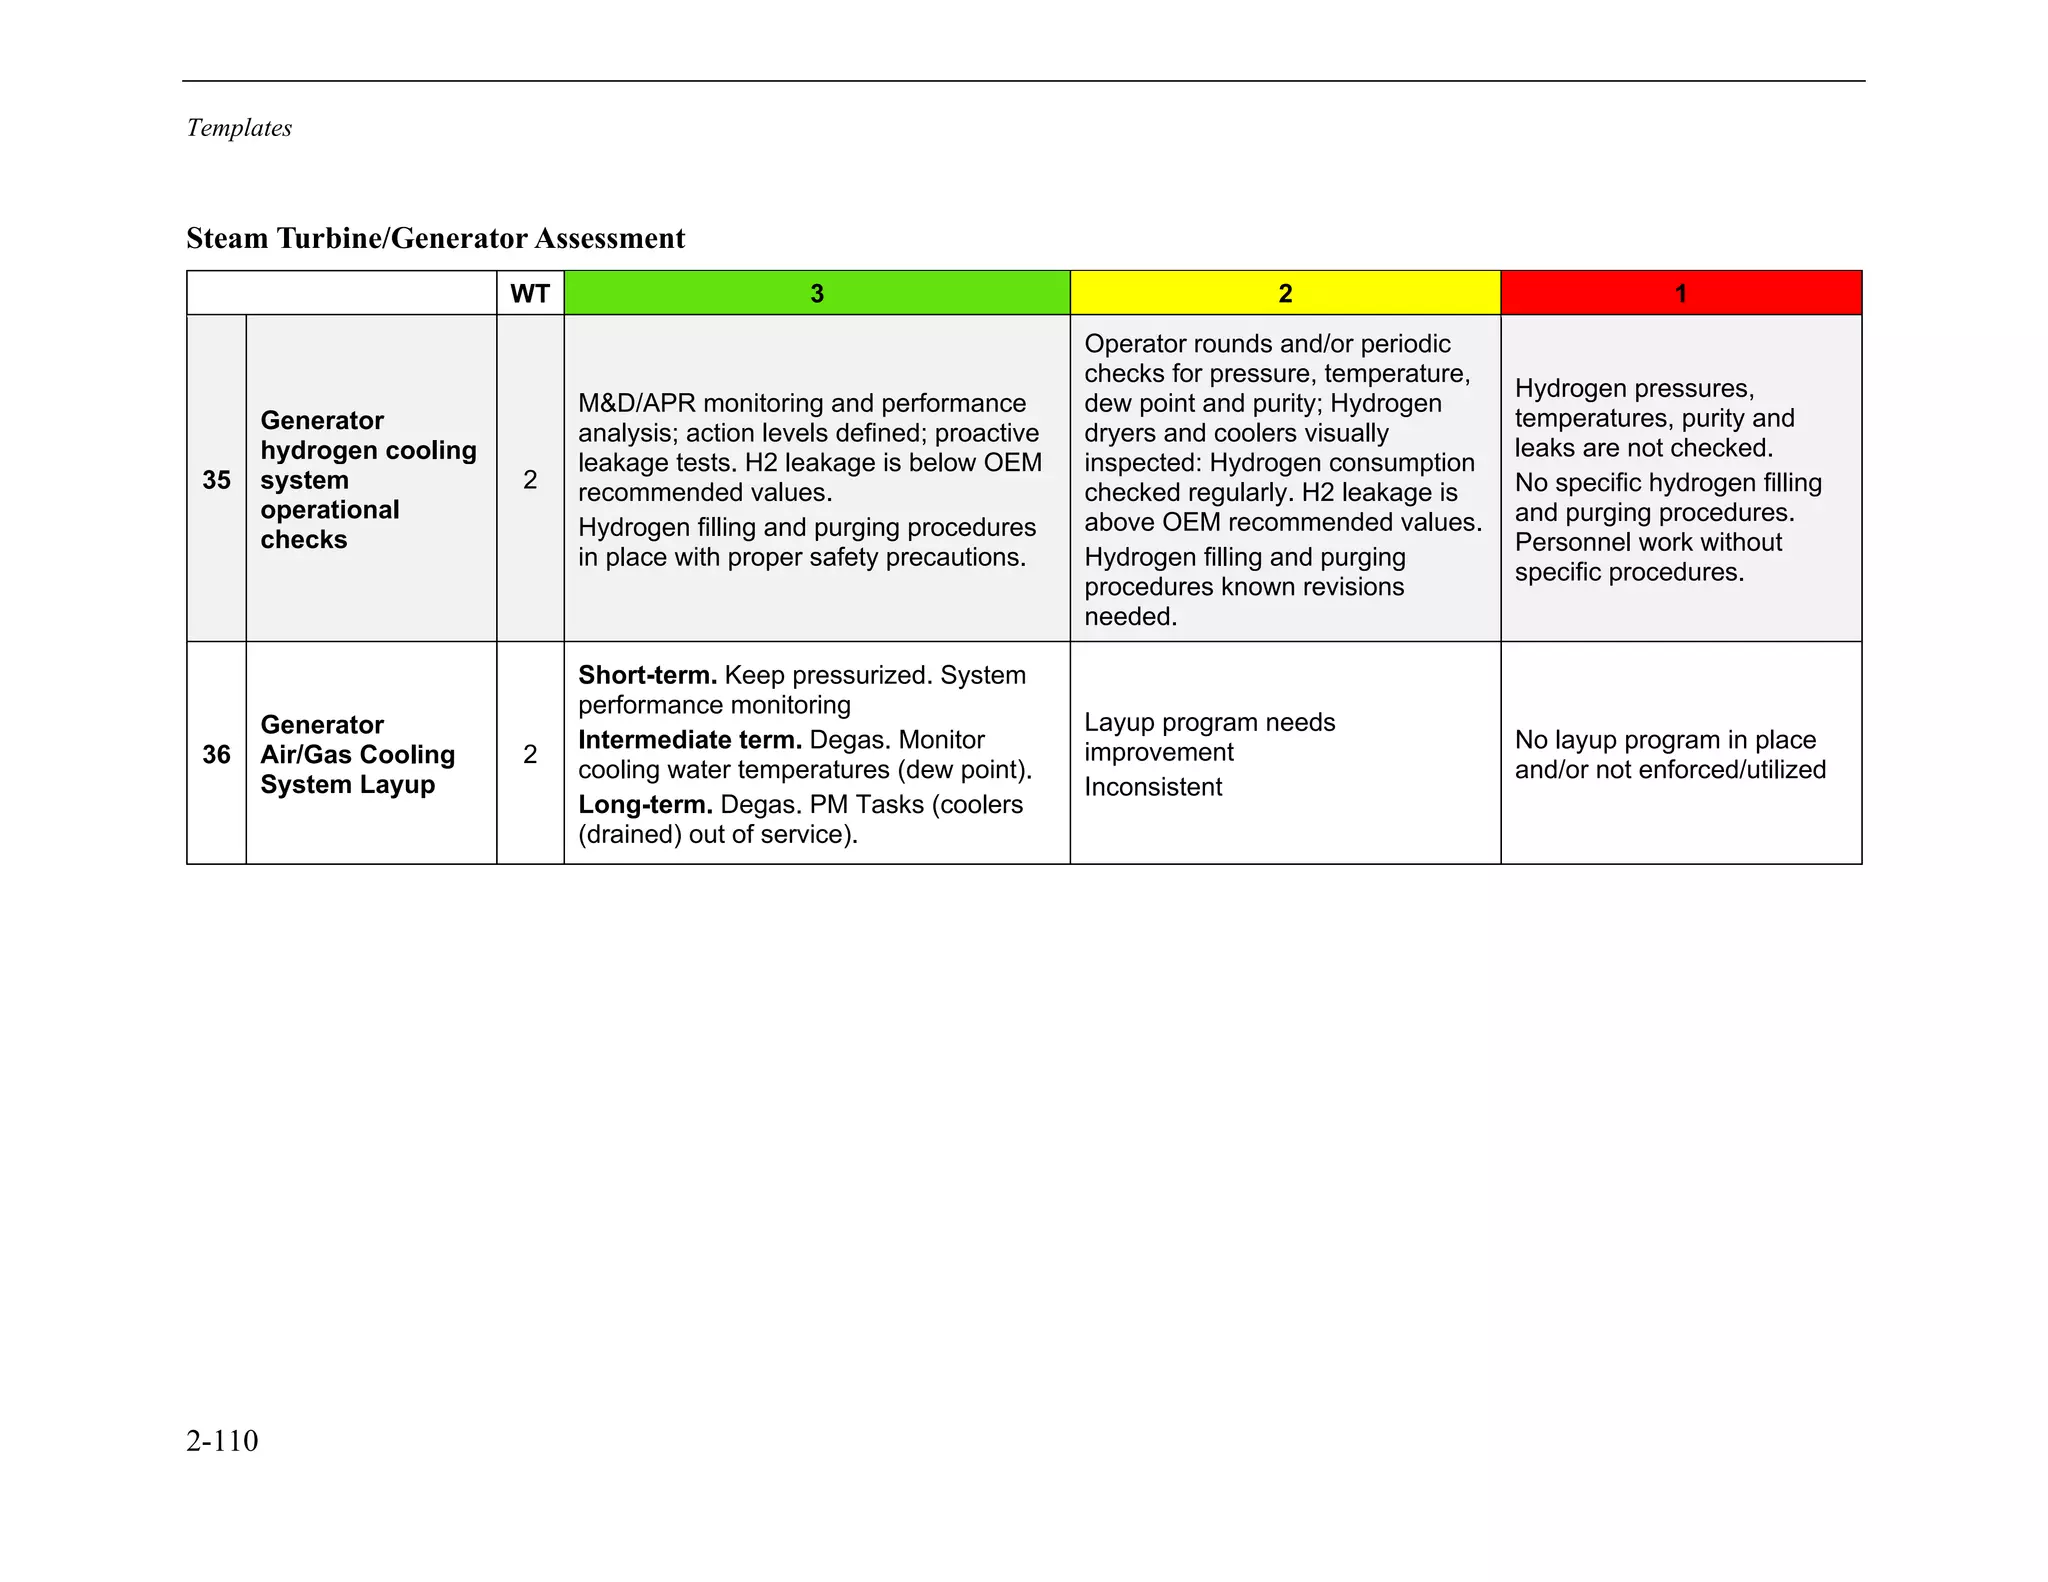
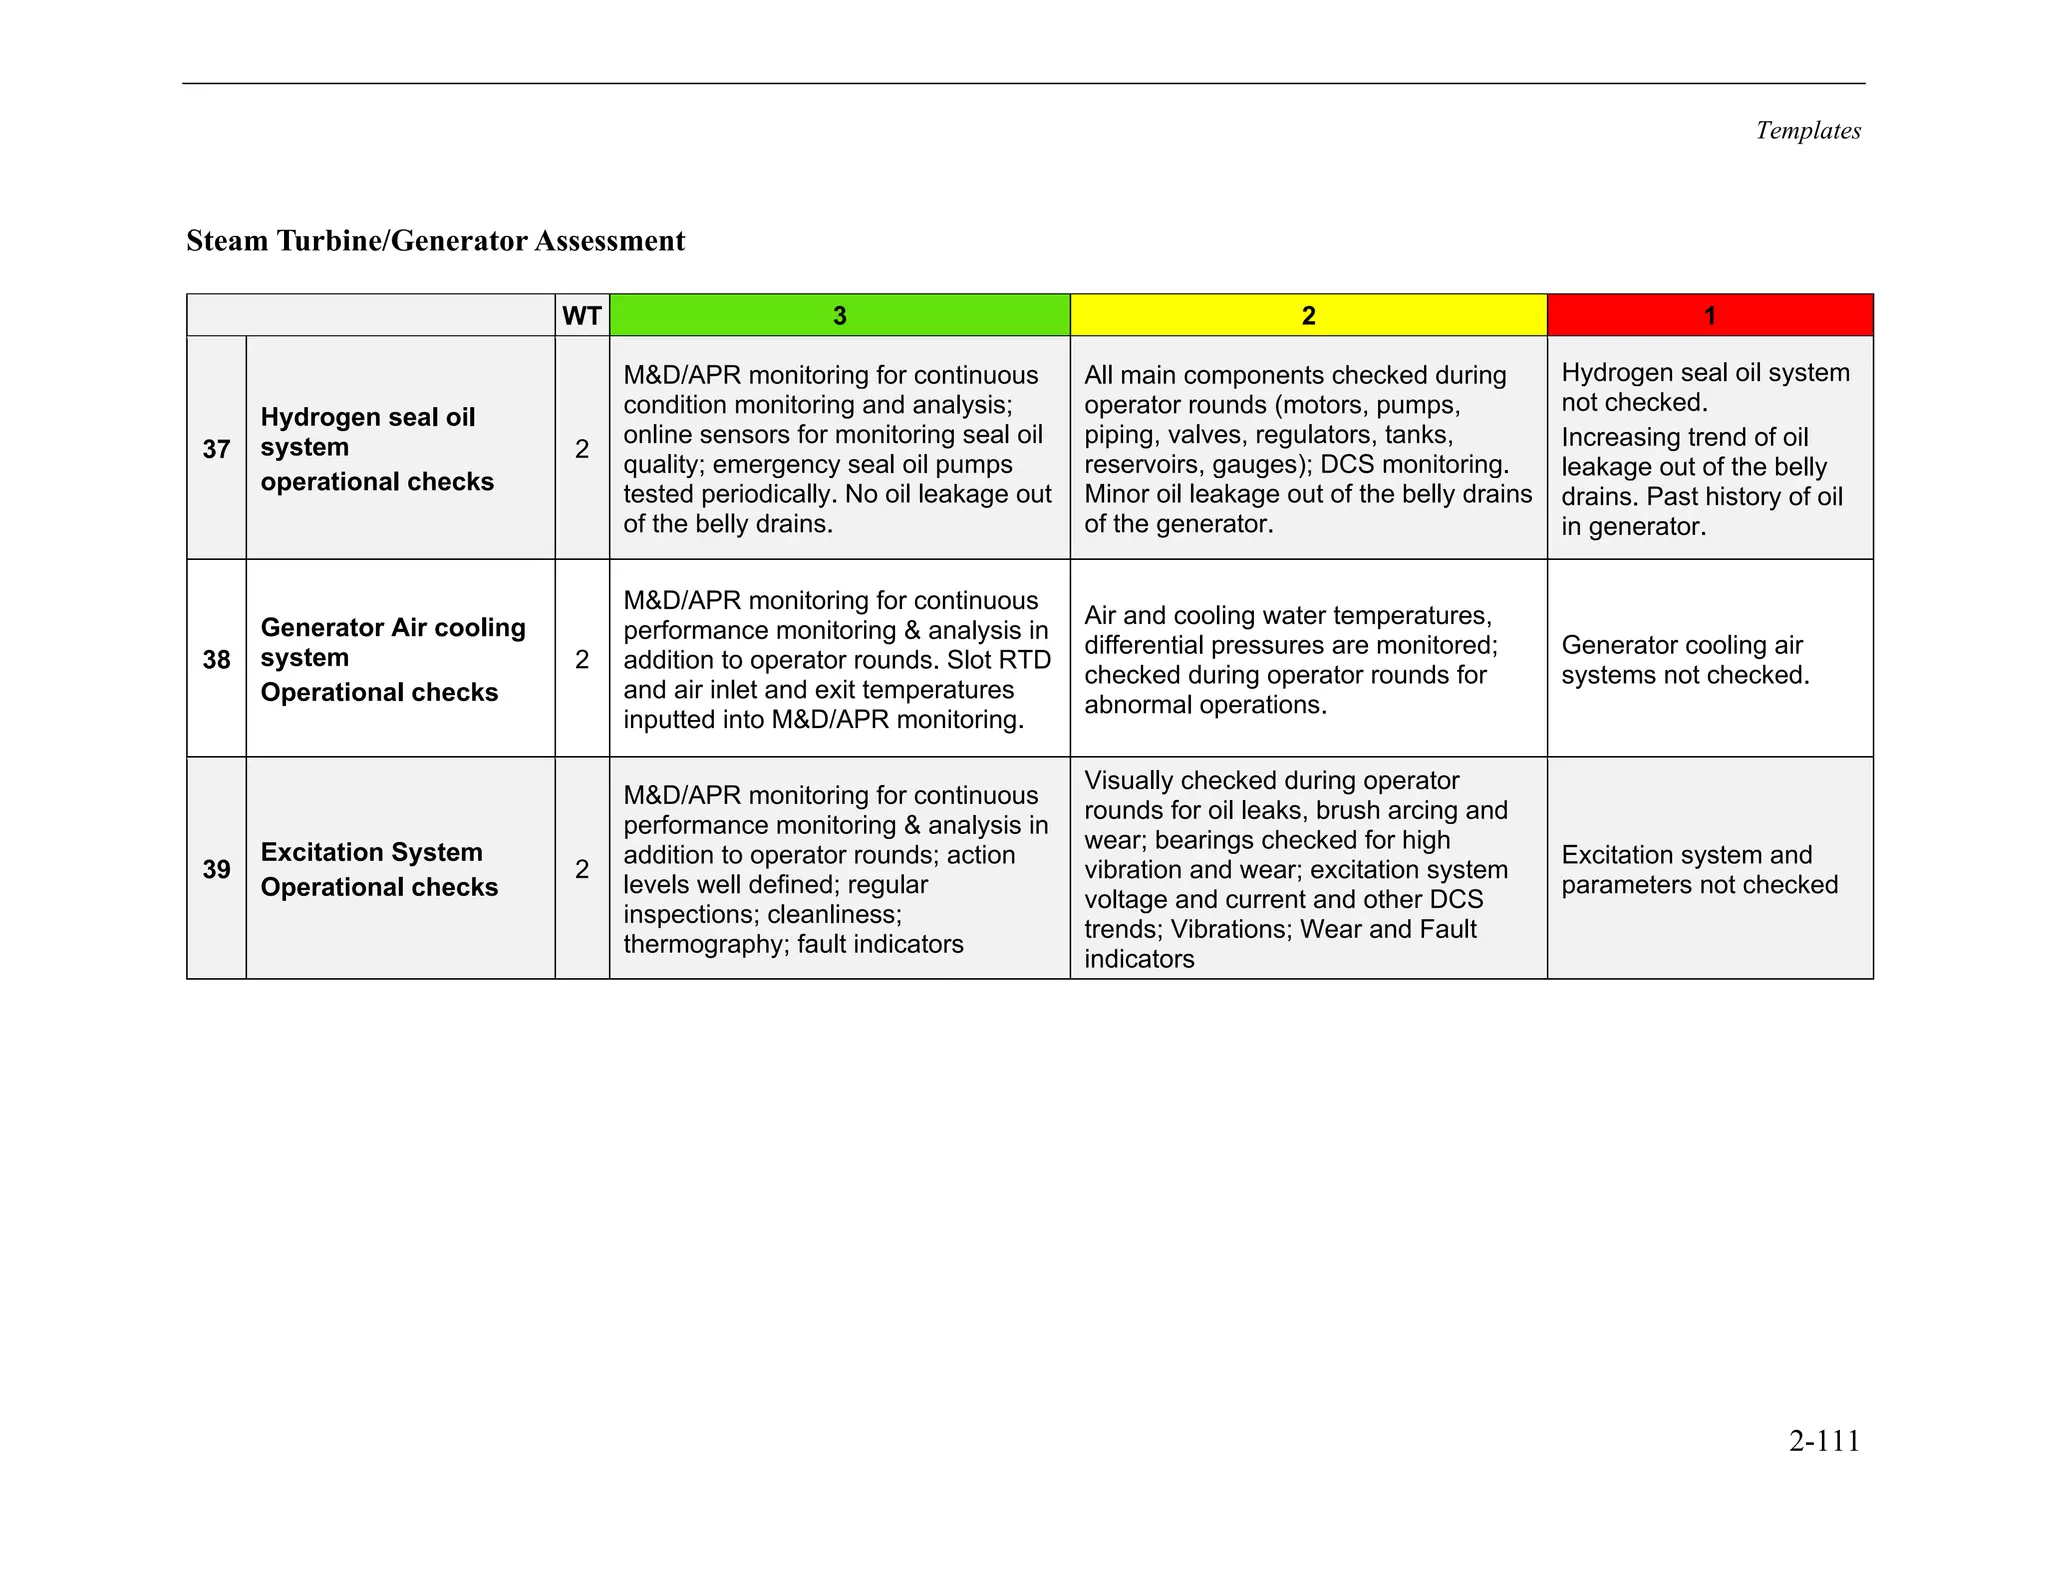
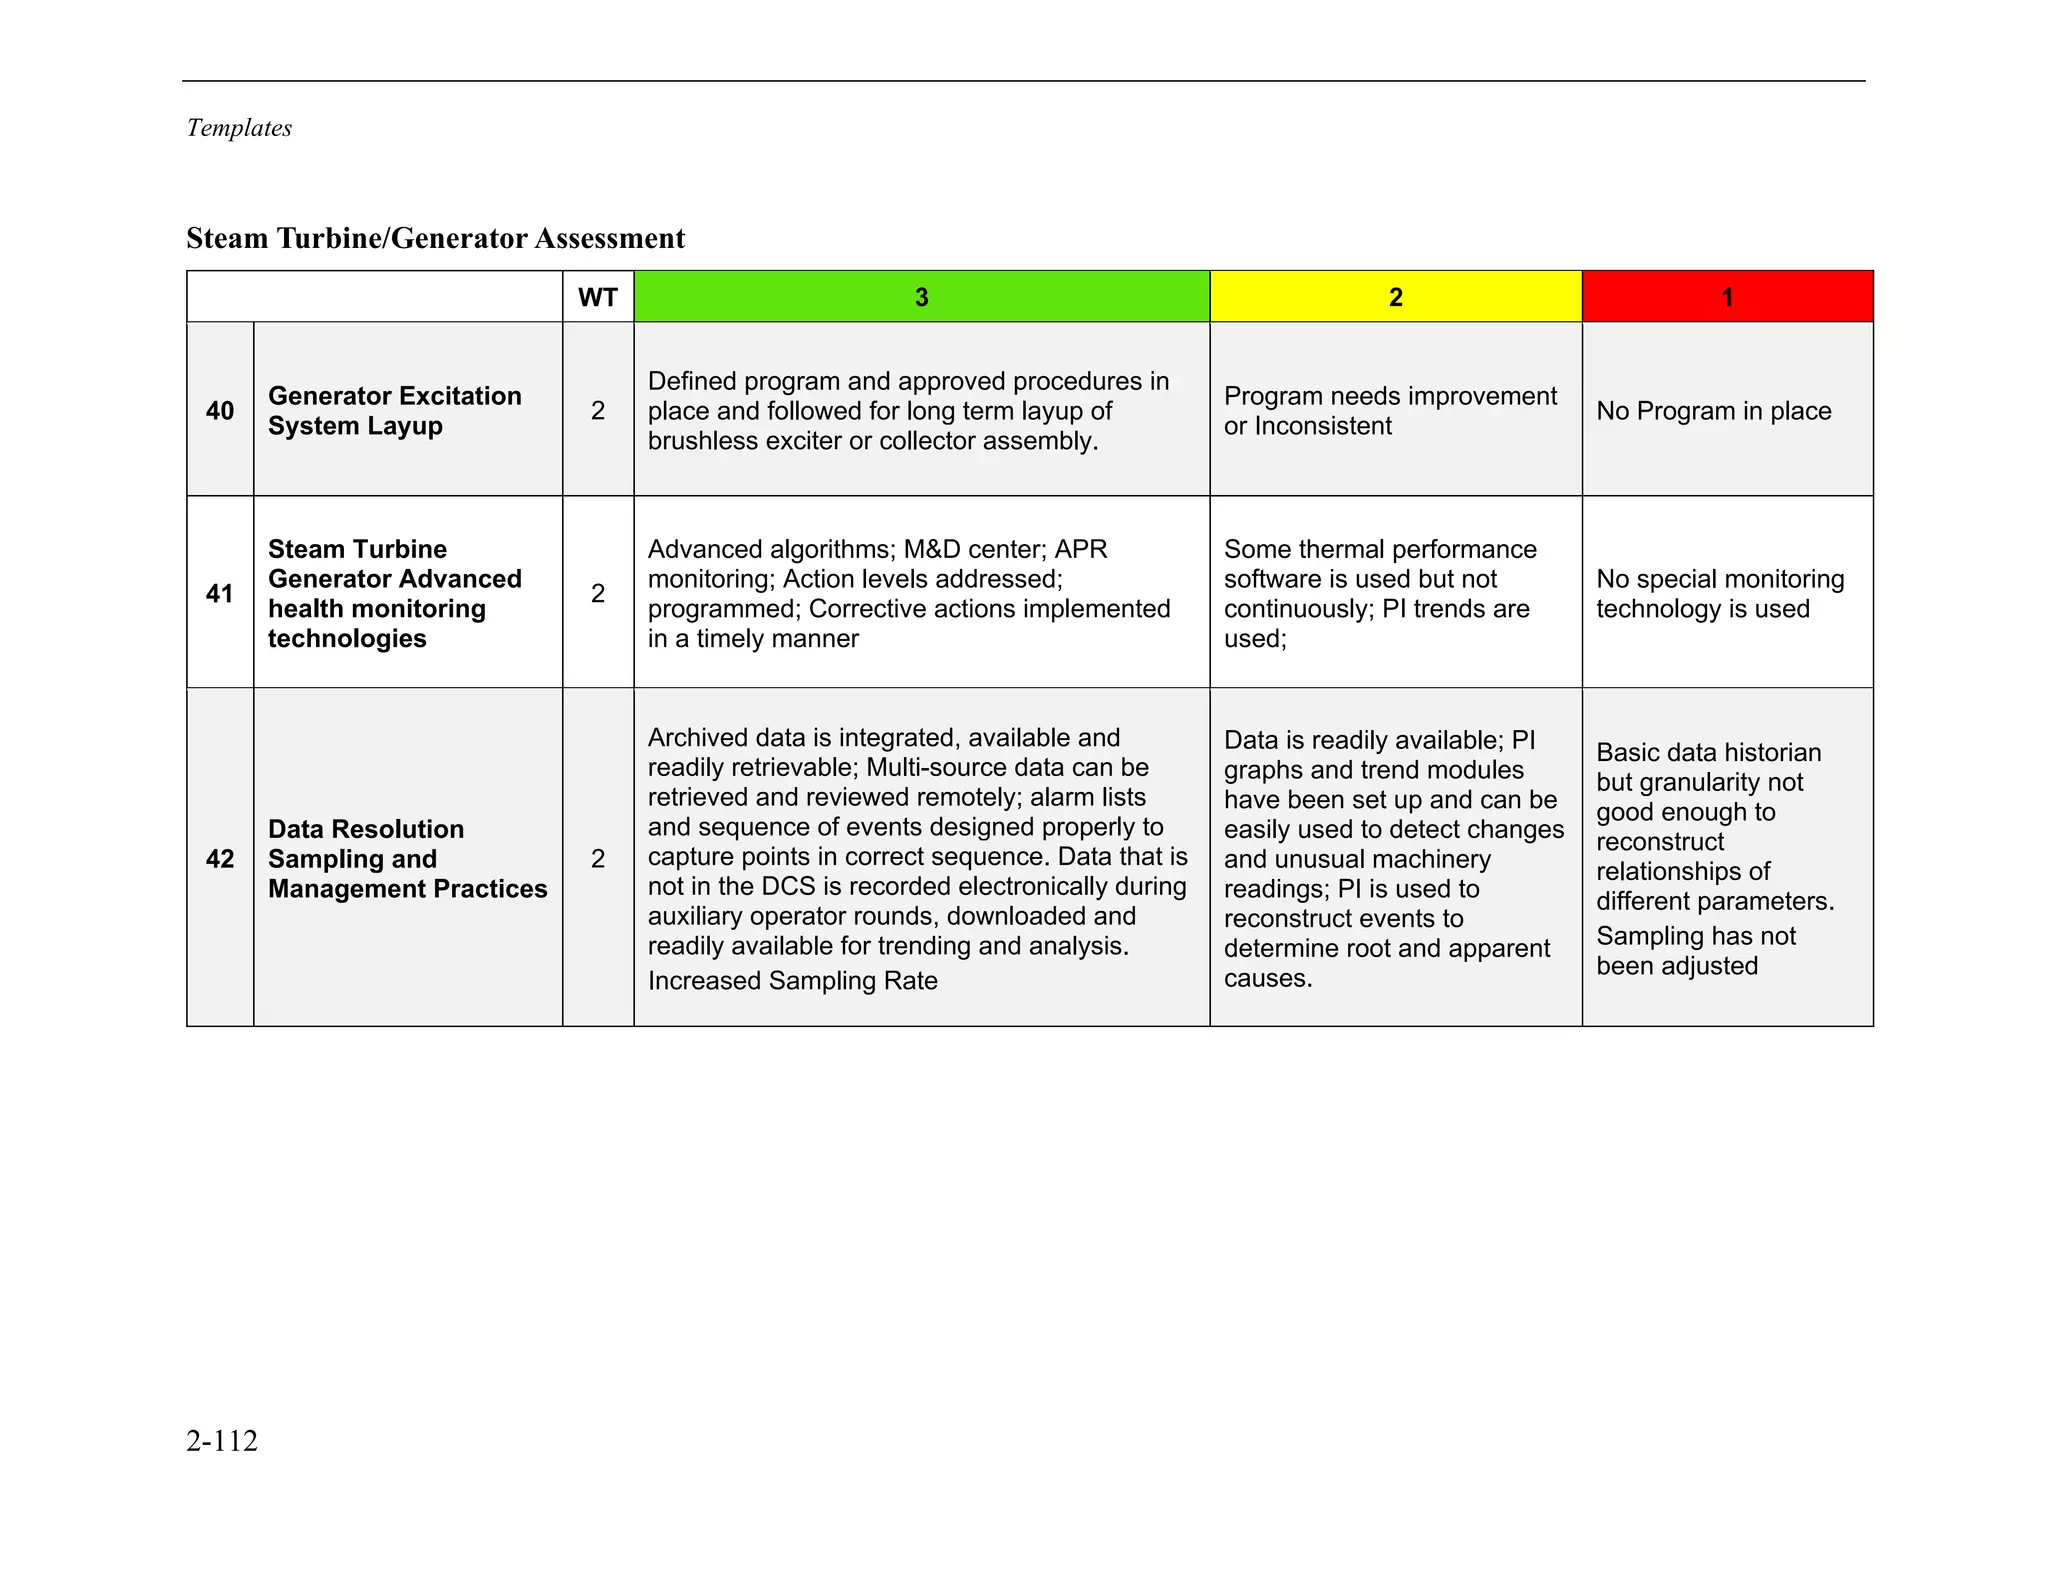
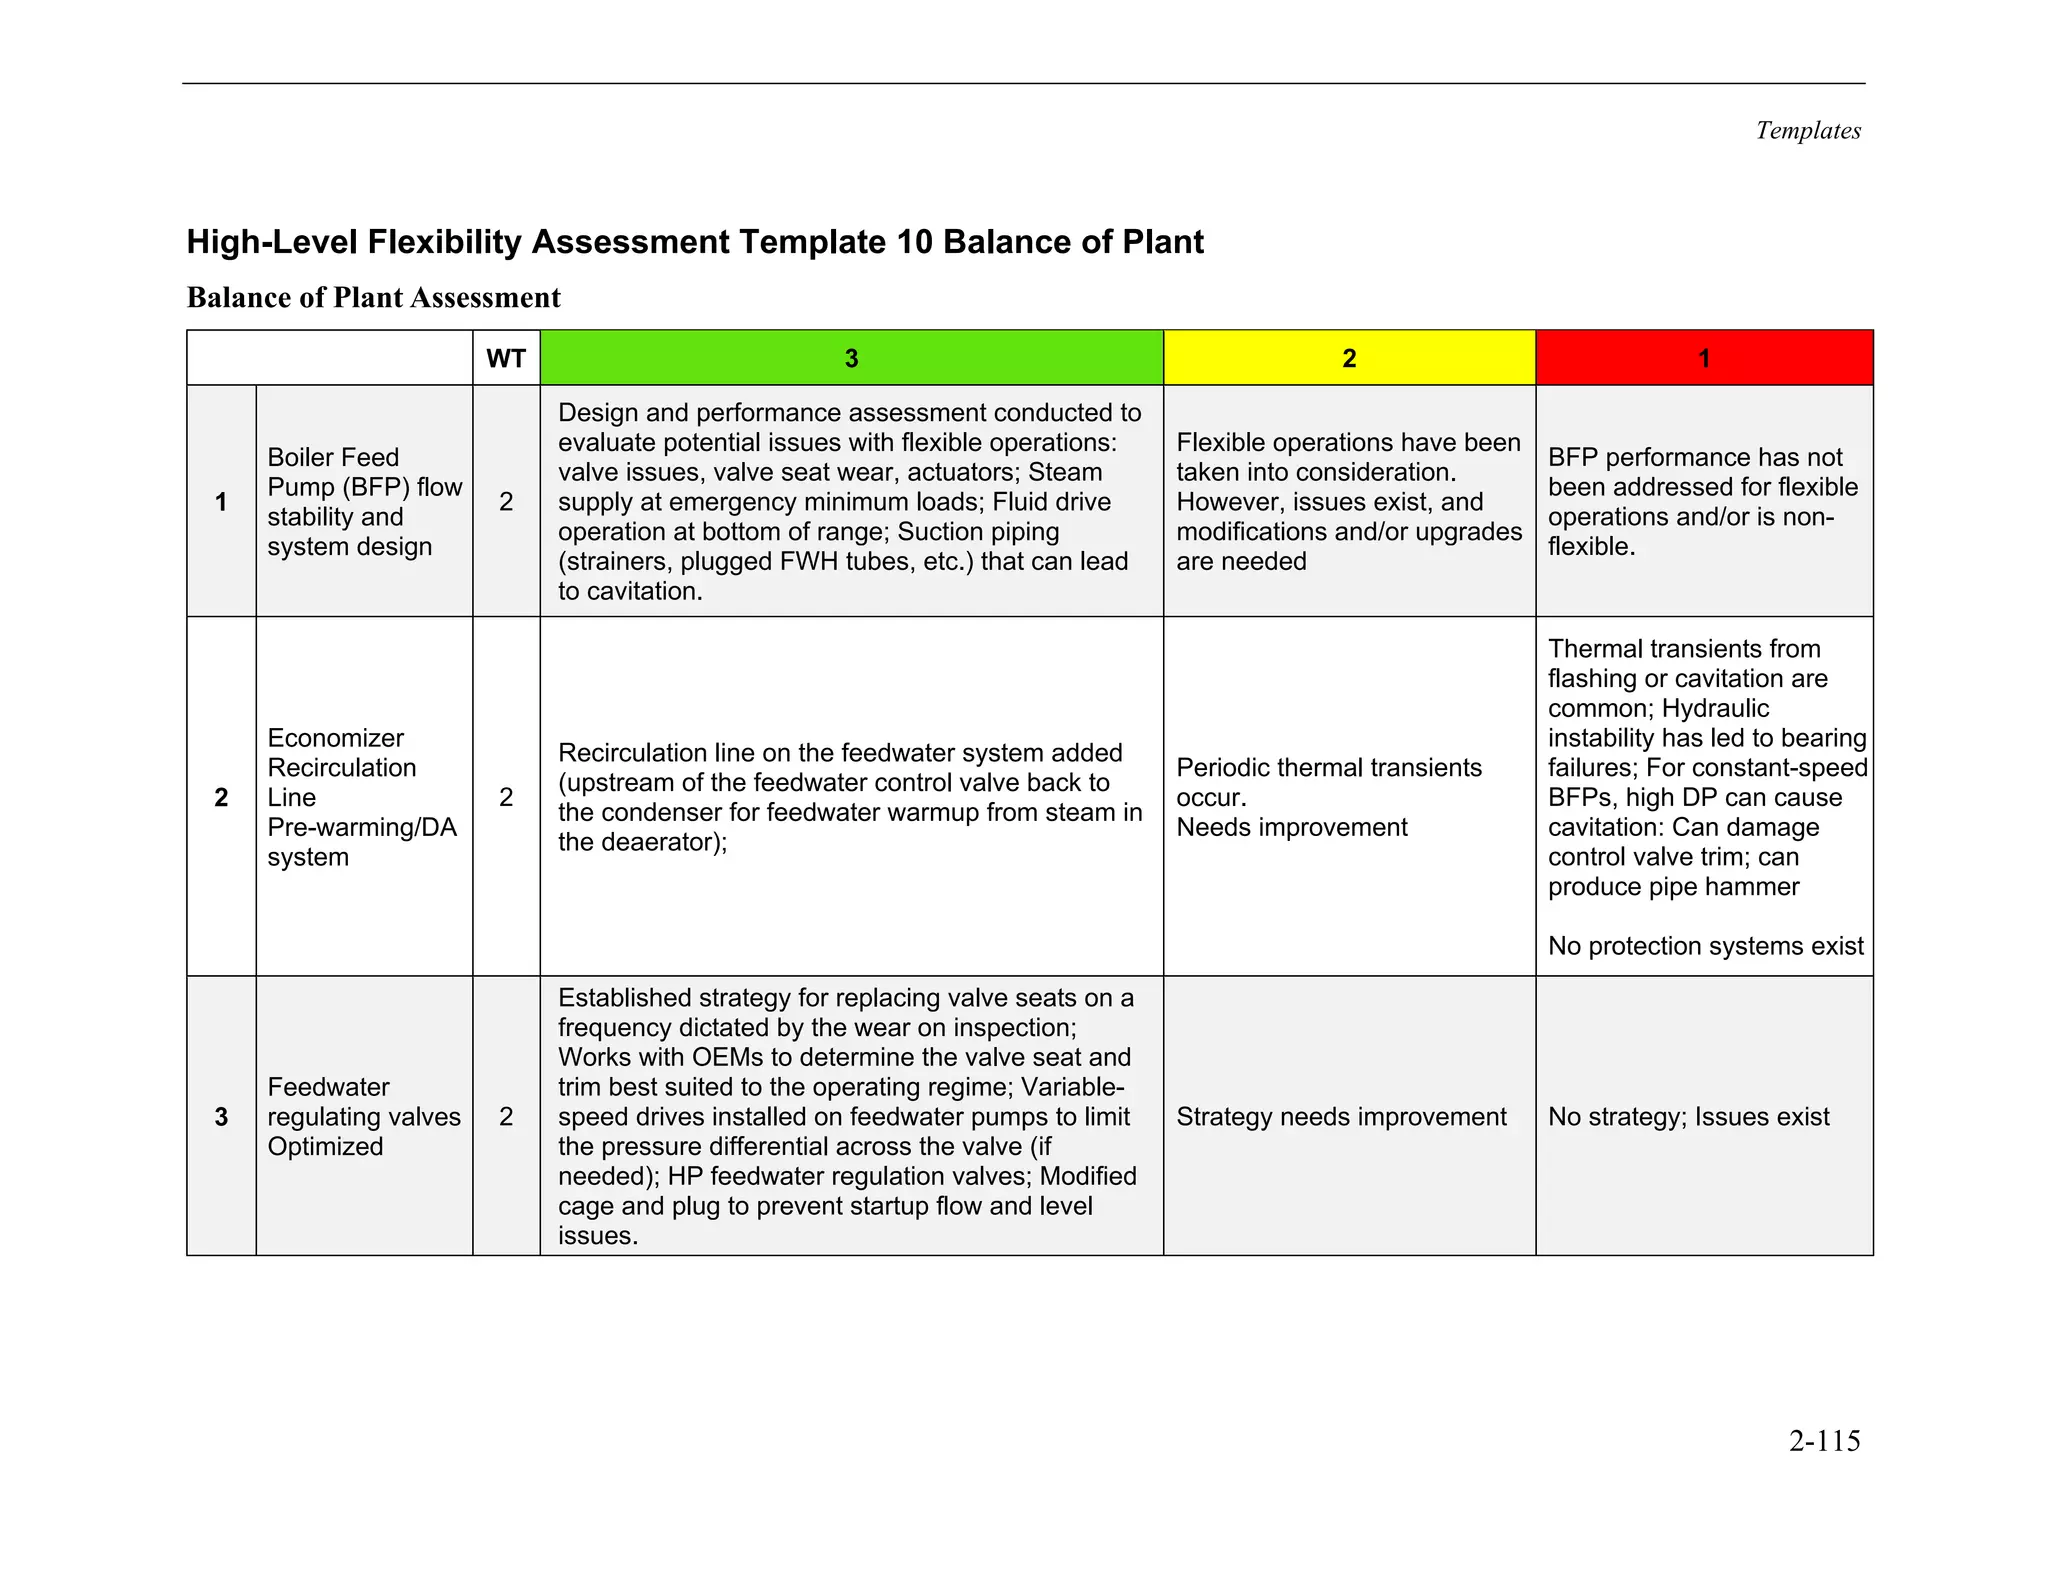
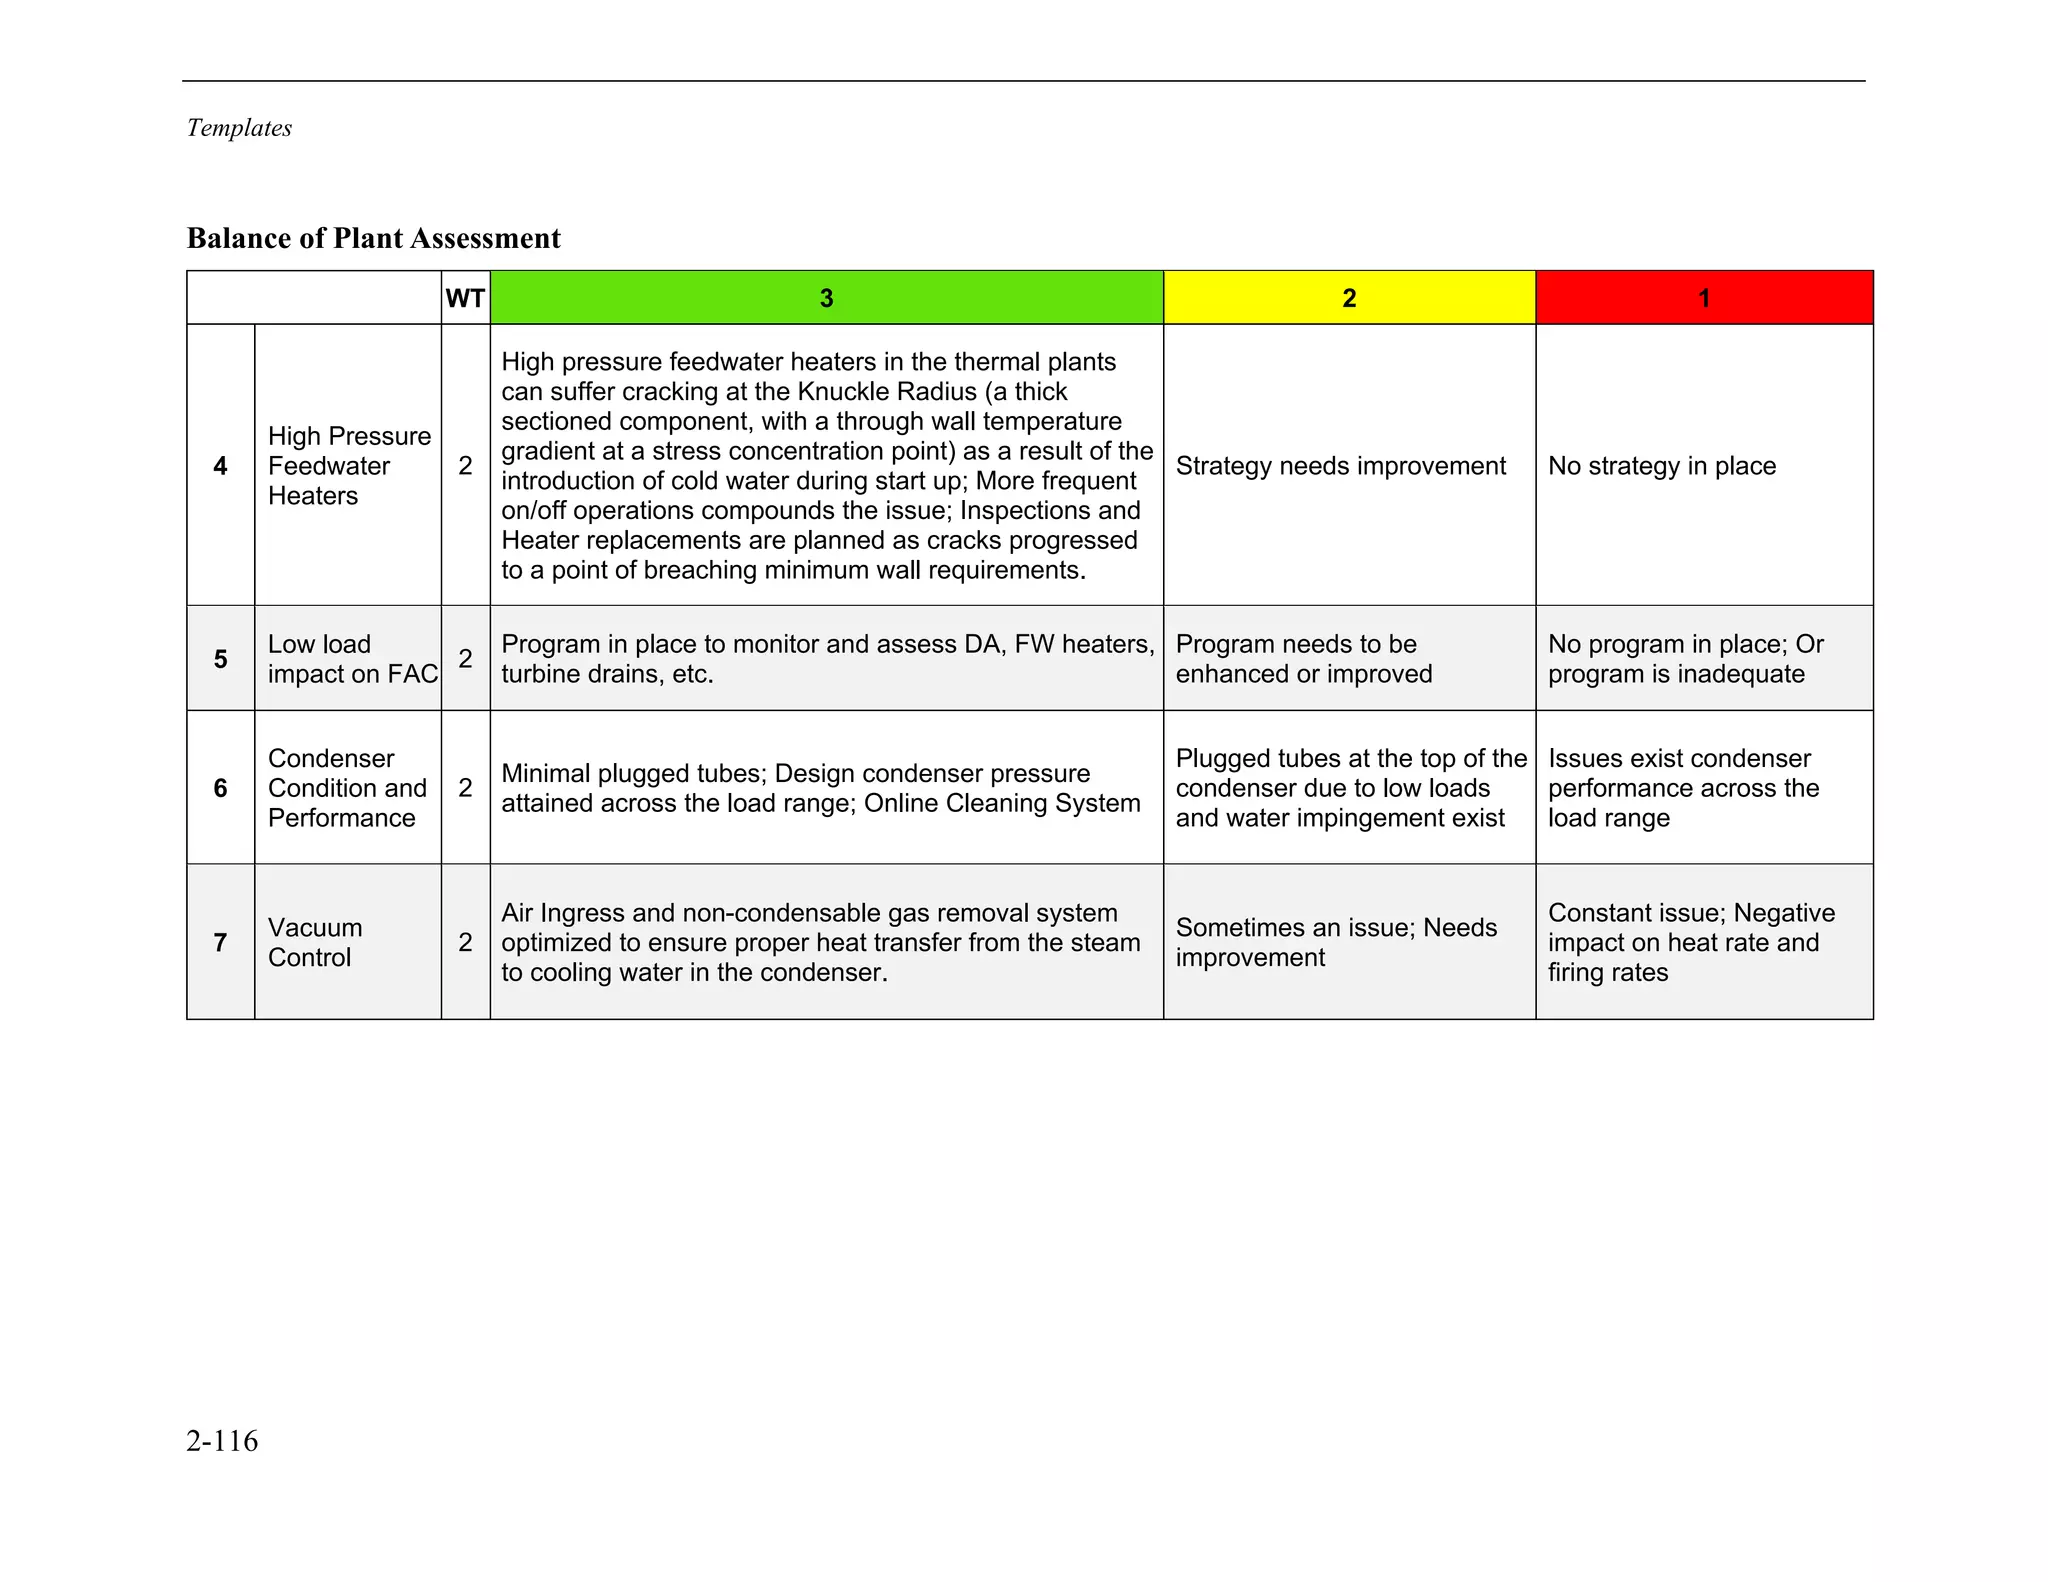
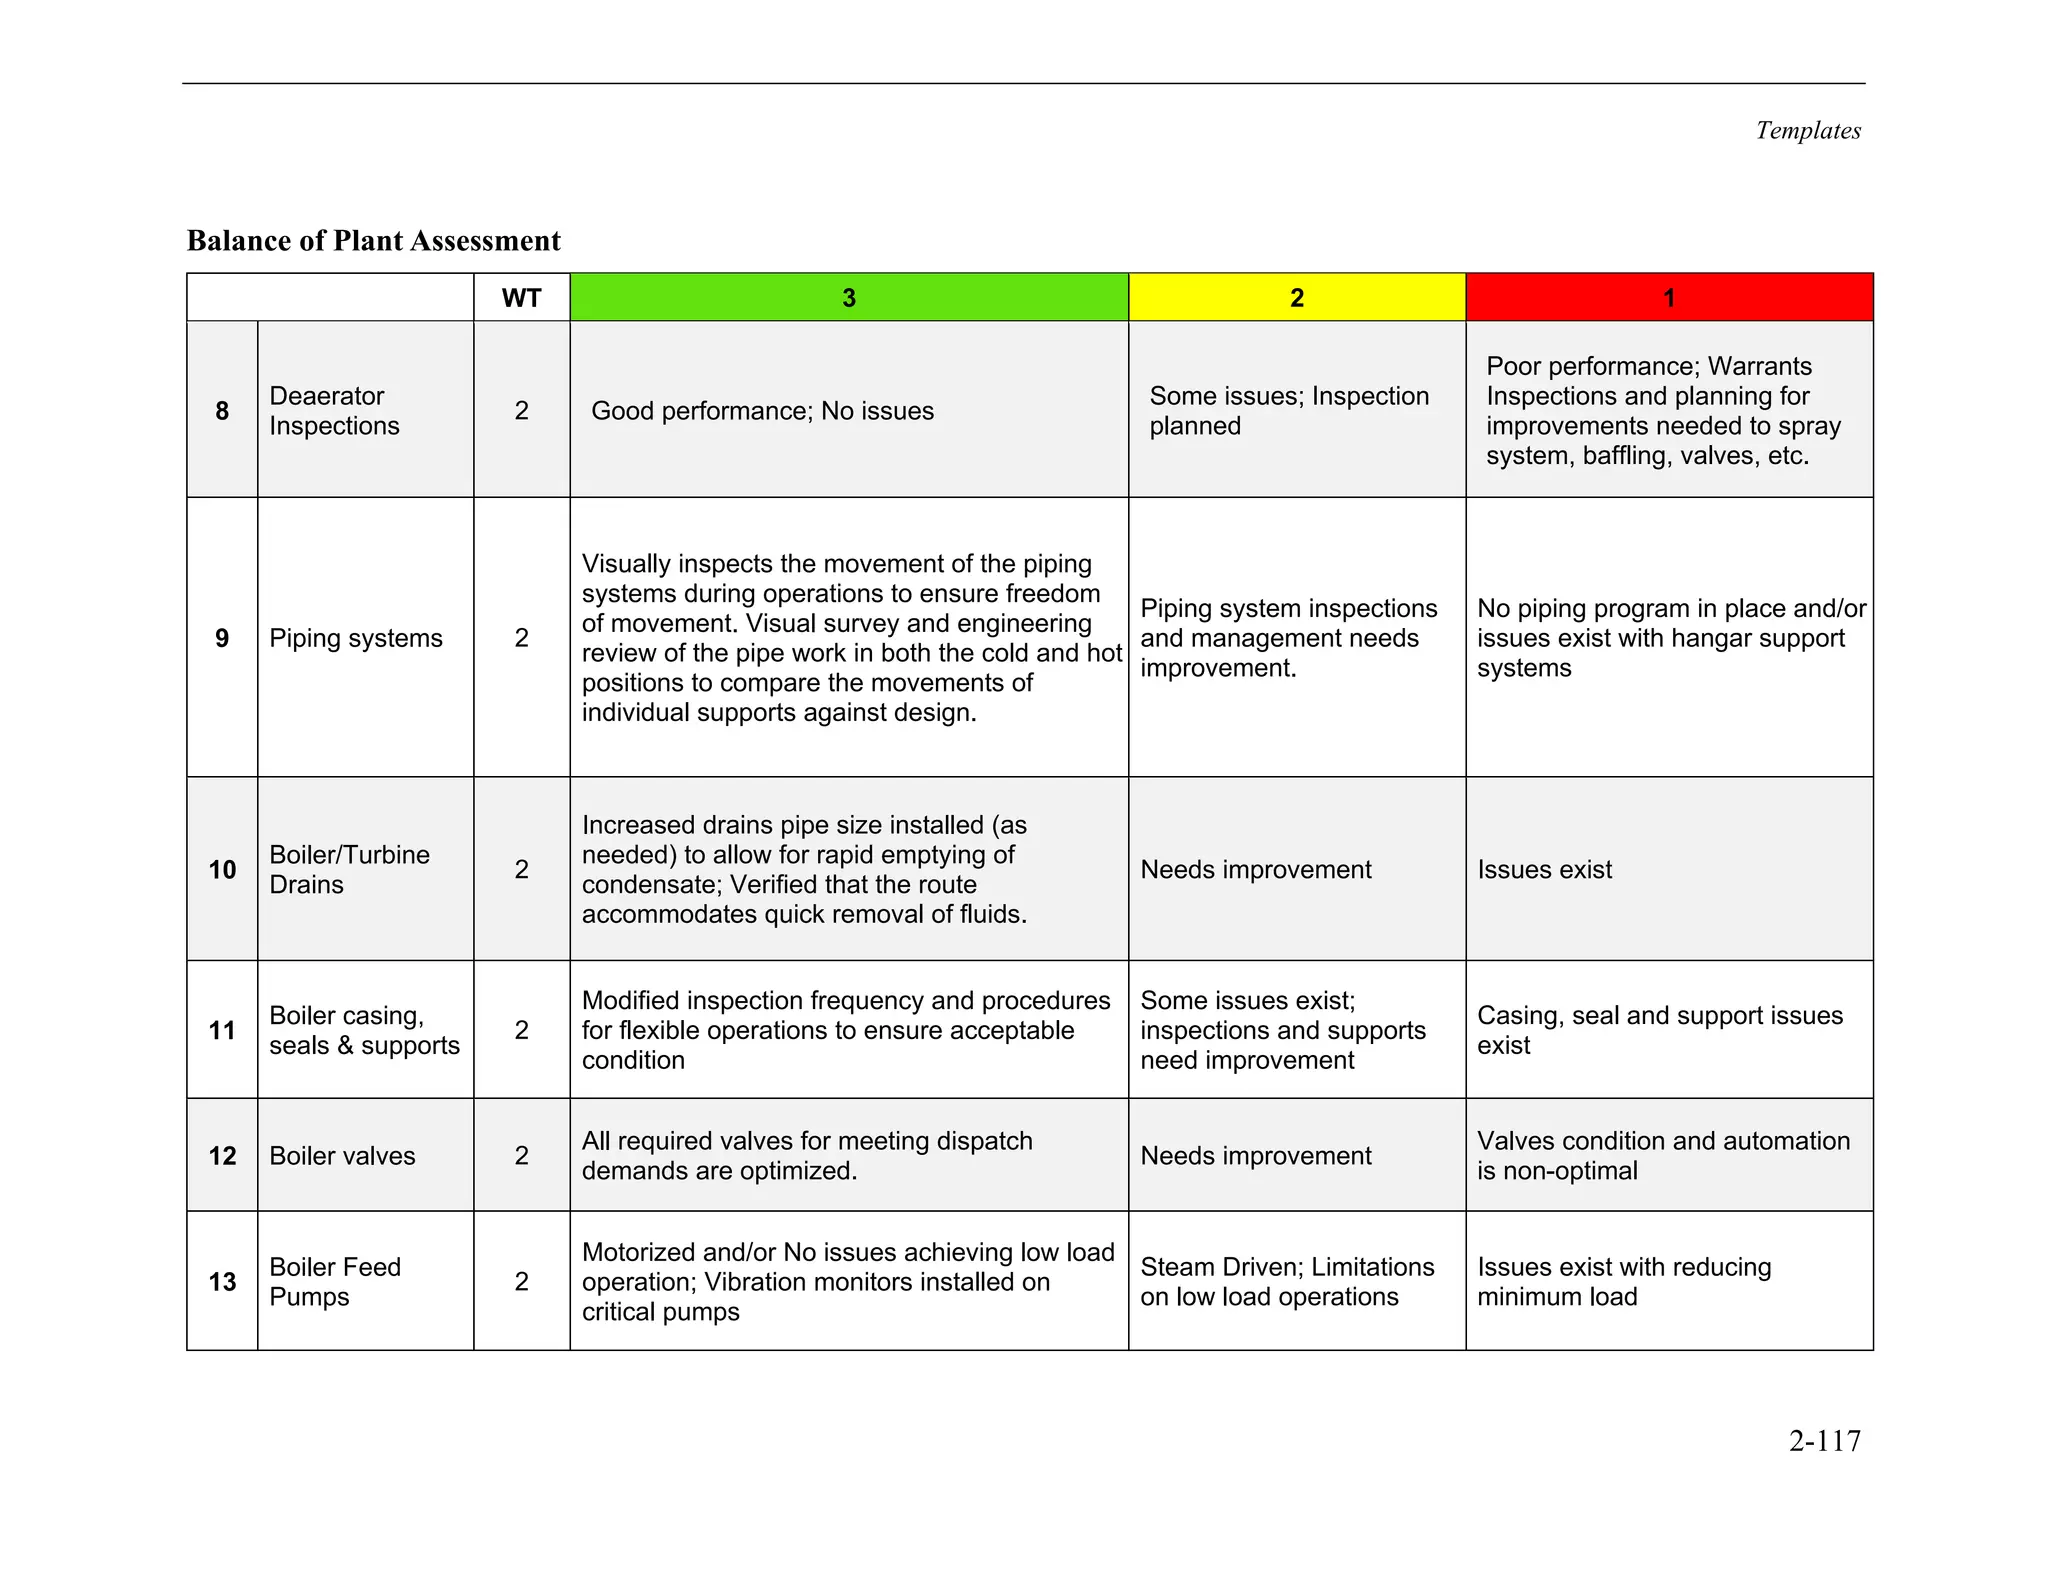
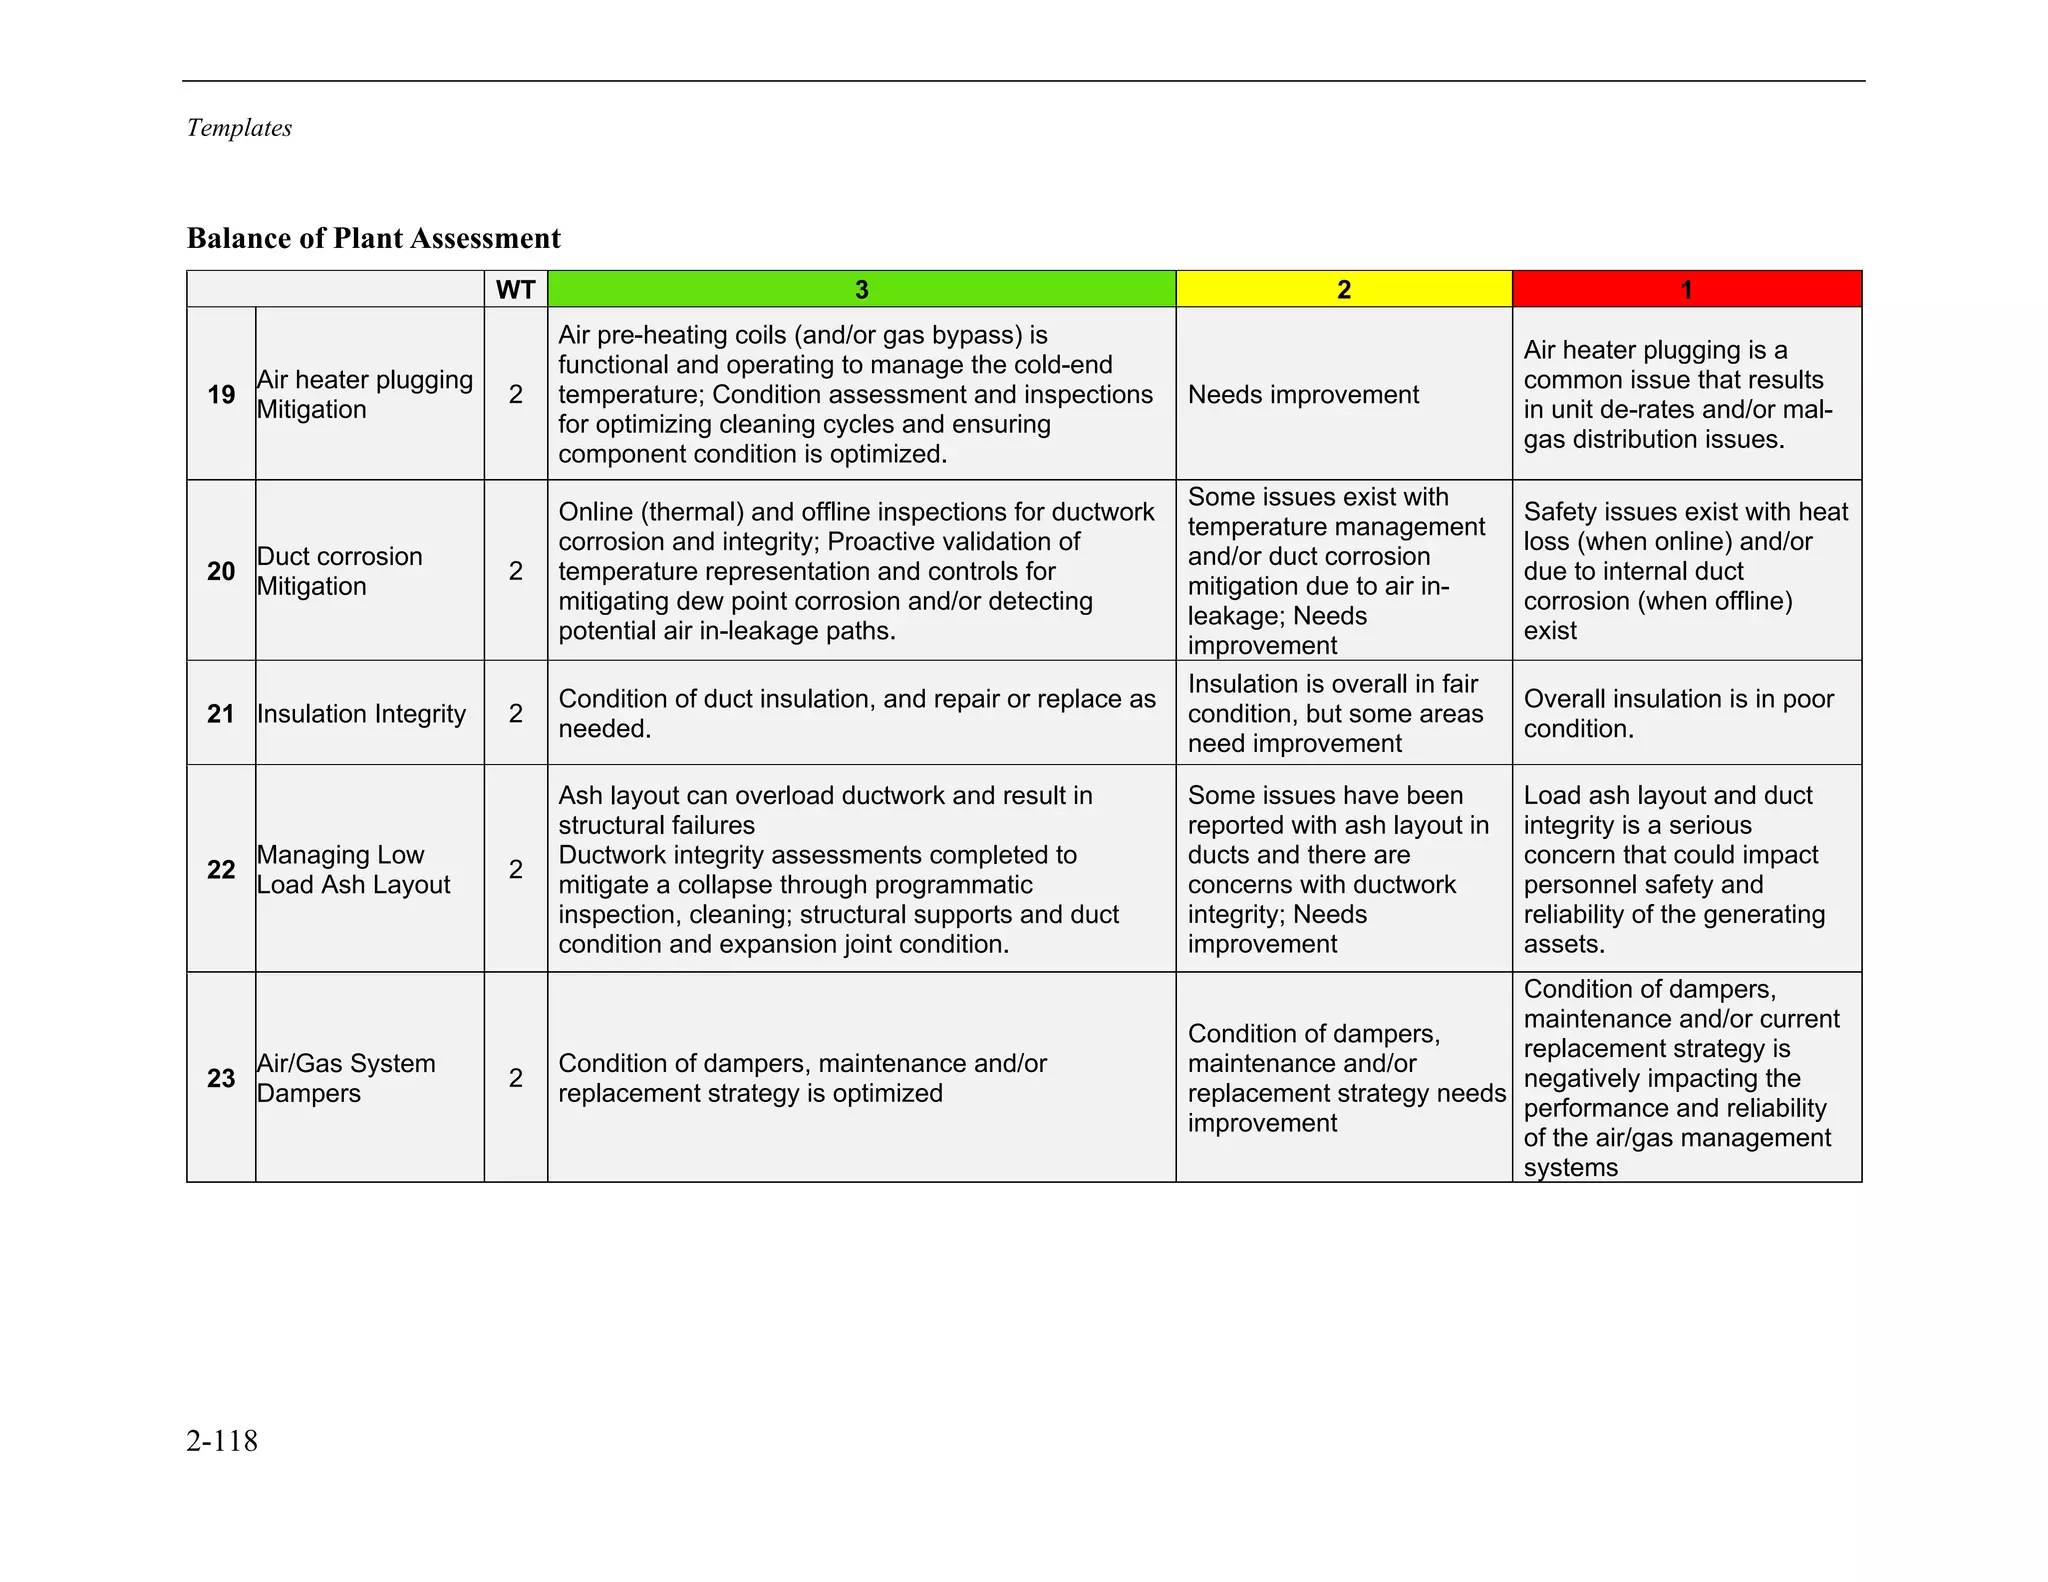
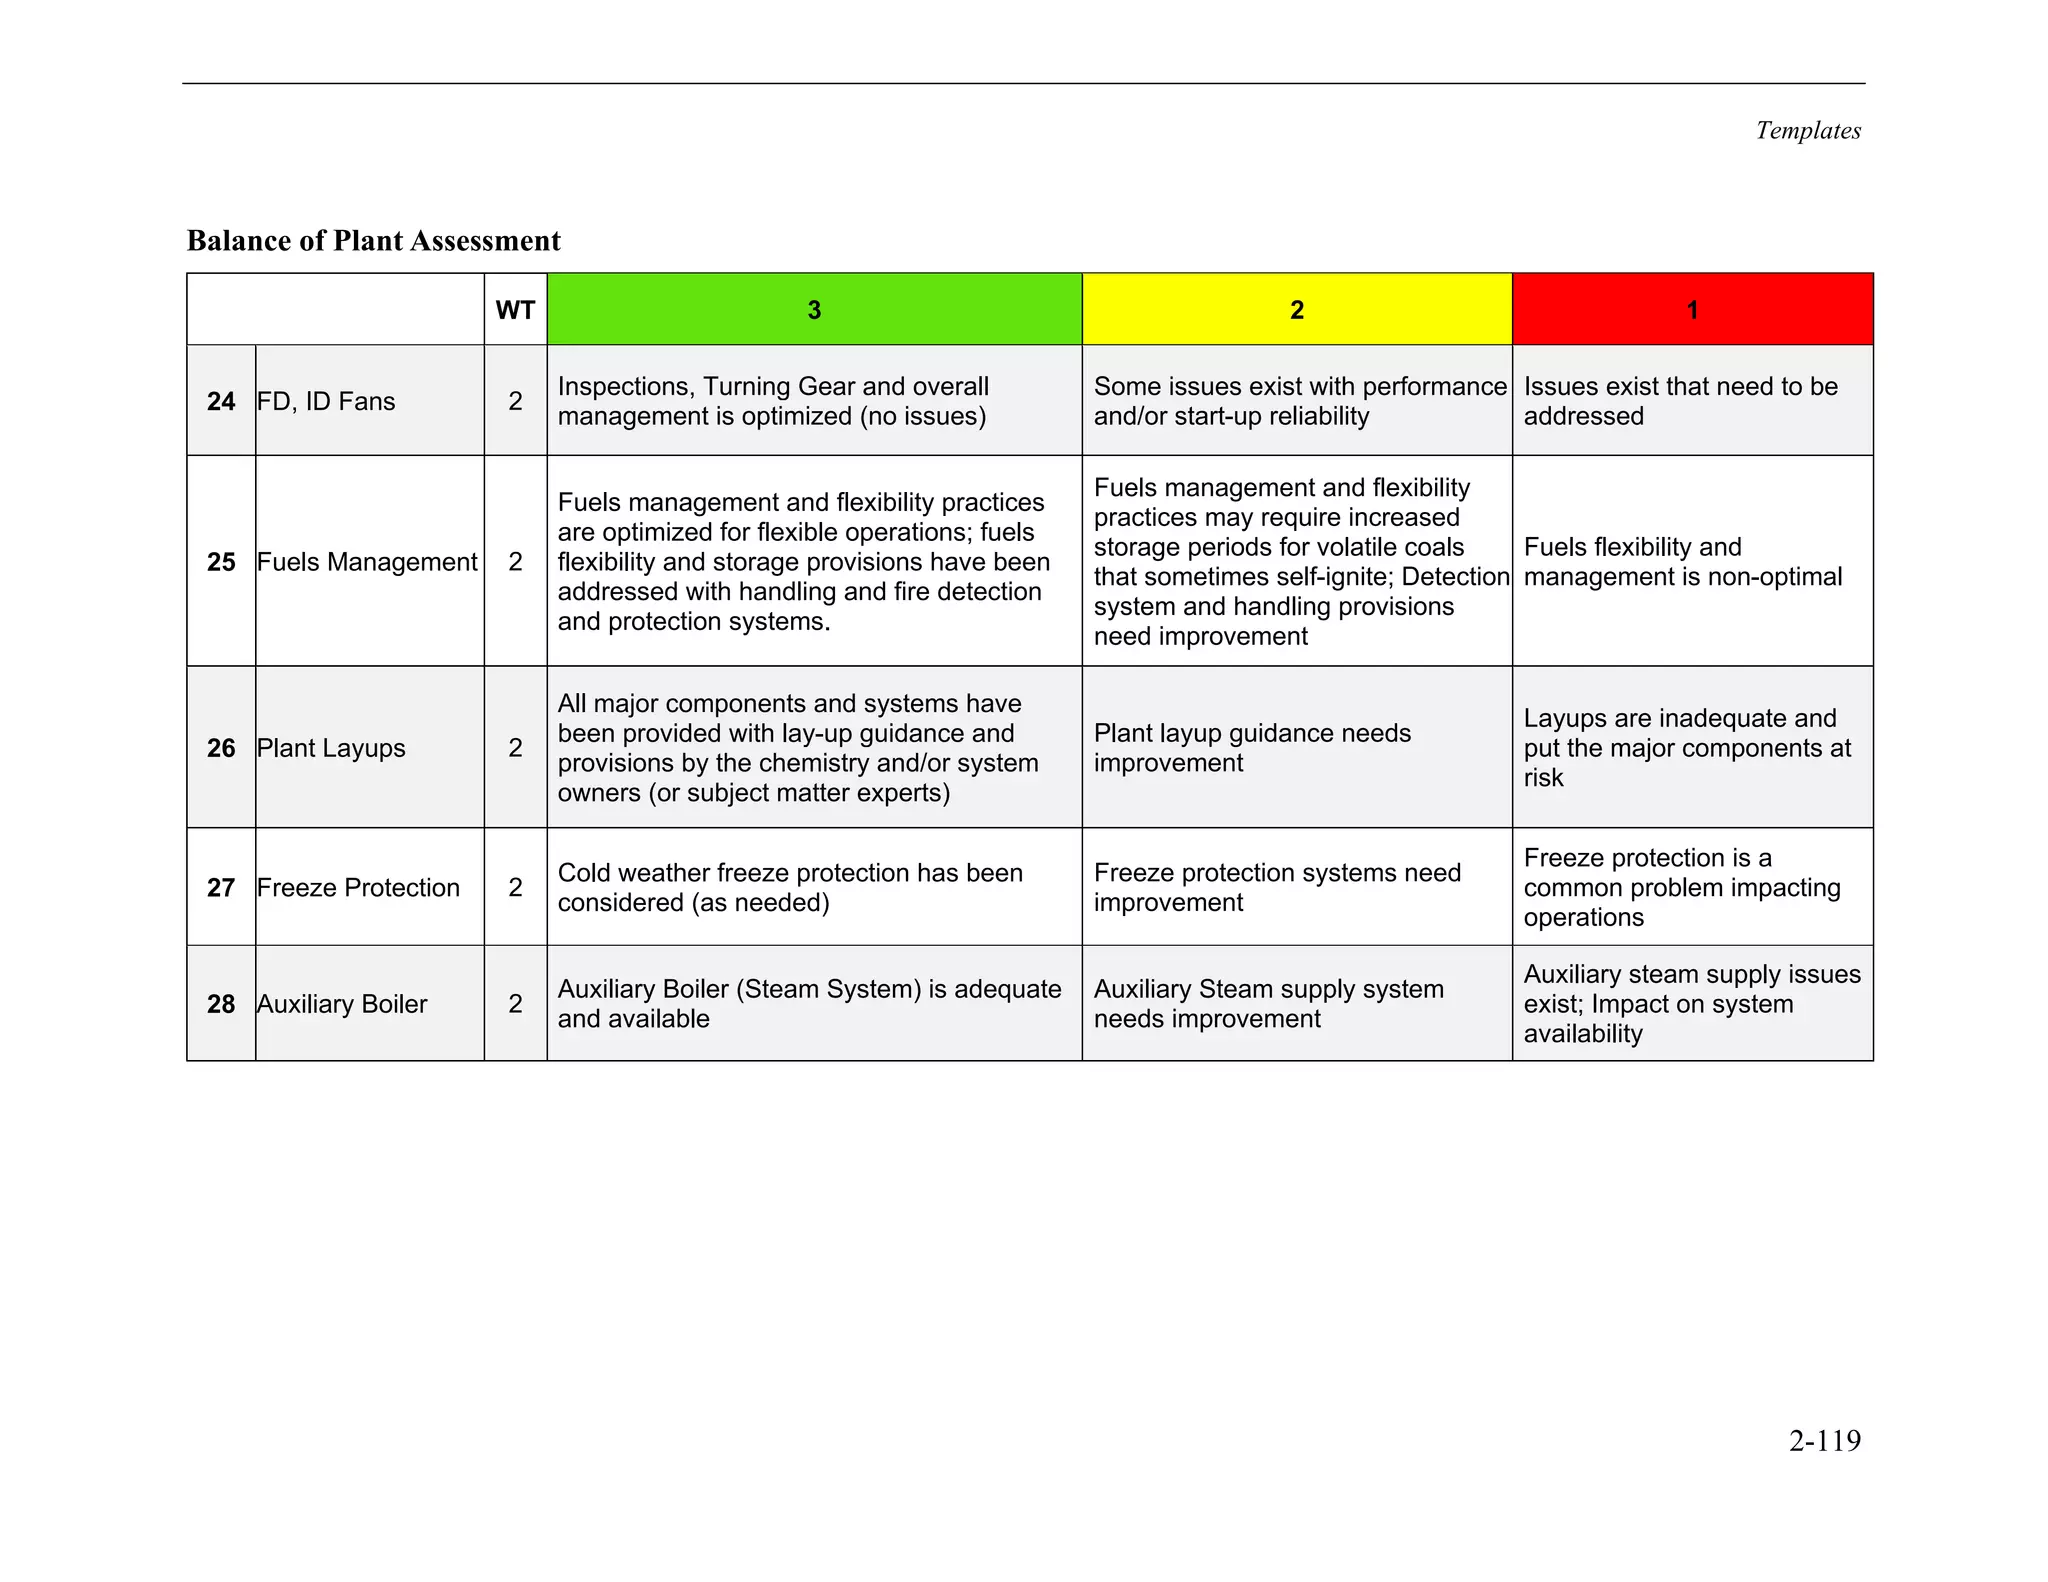
This technical report provides templates to help operators of conventional steam generators assess flexibility performance. The templates cover 10 key areas and are intended to identify gaps and improvement opportunities related to operating flexible units. As renewable energy increases on grids, coal plants are often required to operate more flexibly by load following or operating at lower minimum loads, which can impact reliability if not properly managed. The templates provide guidance to help plants evaluate systems and optimize for flexible operations while minimizing negative impacts on equipment.
3. EPRI Project Manager
S. Storm
ELECTRIC POWER RESEARCH INSTITUTE
3420 Hillview Avenue, Palo Alto, California 94304-1338 ▪ PO Box 10412, Palo Alto, California 94303-0813 ▪ USA
800.313.3774 ▪ 650.855.2121 ▪ askepri@epri.com ▪ www.epri.com
High-Level Flexibility Assessment
and Benchmarking Tool
Conventional Steam Generators
3002019900
Final Report, October 2020
11534825
5. This publication is a corporate document that should be cited in the literature in the following
manner:
High-Level Flexibility Assessment and Benchmarking Tool: Conventional Steam Generators.
EPRI, Palo Alto, CA: 2020. 3002019900.
iii
ACKNOWLEDGMENTS
The following organizations prepared this report:
The Electric Power Research Institute (EPRI)
U.S. Department of Energy (USDOE)
This is a U.S. Department of Energy (USDOE) collaborative project supported under the Power
and Energy Efficiency Pillar of the U.S. - India Strategic Energy Partnership (SEP), which is
co-chaired by DOE’s Office of Fossil Energy and India’s Ministry of Power. EPRI received
collaborative input and support from the following organizations:
• NTPC Limited (NTPC), Corporate Operations Services Team
• NTPC, Centre for Power Efficiency & Environmental Protection (CenPEEP)
• NTPC Stations:
– NTPC Simhadri (4x500-MW subcritical units)
– NTPC Bongaigon (3x250-MW subcritical units)
– NTPC Farakka (3x200-MW subcrtical units and 3x500MW subcritical units)
– NTPC Gadawara (2x800-MW supercritical units)
– NTPC Solapur (2x660-MW supercritical units)
– NTPC Unchahar (5x210-MW subcritical units and 1x500-MW subcritical unit)
Michael Caravaggio, Major Component Reliability (MCR) and EPRI generator sector, is
acknowledged for support of the project.
Additional input was provided by FM Global, Duke Energy and Mr. Anjan Sinha, Senior
Advisor, U.S. Agency for International Development (USAID) – Greening the Grid
Renewable Integration and Sustainable Energy (GTG RISE) Initiative.
11534825
6. iv
Since the majority of power in India is comes from coal, conventional steam generators play a
key role in helping to balance the grid with flexible operations. From January 2020 until project
completion, NTPC supported EPRI with the application of relevant research to develop a user-
friendly—yet comprehensive—assessment and benchmarking tool for conventional steam
generation operators. The tool is essentially a guide for conducting assessments to reveal gaps
and identify areas needing improvement.
The templates provide relevant guidance to address a global challenge facing conventional steam
generators. As these units continue to age, reliability is being threatened by thermal transients,
vibration, corrosion, and many other damage mechanisms imposed by cyclic conditions. These
conditions require periodic assessment and asset management practices to help mitigate
potentially costly equipment damage and to promote safe, efficient and event-free operations.
This was the inspiration behind developing a tool with integrated templates that provide a high-
level assessment process for identifying gaps in flexibility performance. The end goal was to
create awareness, leverage past research, and help drive projects to overcome flexibility
roadblocks.
NTPC not only supported the project development process, but also demonstrated the
effectiveness of the tool by leveraging a project team from six (6) stations that conducted
multiple assessments to identify challenges and roadblocks, as well as identifying a fast-paced
approach to improvement of their fleet optimization strategy on approximately 8GW of critical
generating assets across the NTPC fleet. The quantifiable benefits helped to identify high-level
gaps in performance. The results obtained are being used to drive improvement in flexibility by
addressing the identified issues. The onset of lower-carbon energy resources on the grid
continues to transform the mission for coal-fired generating stations in India.
11534825
7. v
ABSTRACT
Flexible conventional steam generators play a key role in ensuring grid stability. The objective of
this project is to develop user-friendly tools in the form of flexibility templates to help guide
operators of these units on how to conduct complex assessment that reveal unit design and
operating gaps, as well as identify areas needing improvement. The templates are applicable to
both subcritical and supercritical steam generators >100MWs. As units continue to age,
reliability is jeopardized by thermal transients associated with cyclic conditions. These
conditions may need further assessment and monitoring processes to help mitigate potential
costly equipment damage and to promote safe, efficient, and event-free operations without
depleting the plant’s operating and maintenance budgets.
The assessment templates in this document are high-level and are intended to help identify and
address areas of vulnerability that require prioritized focus and attention to flexible operations.
Because unit conditions and performance will vary, the templates are intended to be used to
evaluate an individual unit. However, while organizing the assessment, multiple units at a given
plant can be evaluated simultaneously. Flexible operations can encompass a wide range of plant
operating modes and can be applied to all conventional steam generators that are not operating
under baseload conditions. Operating modes are typically driven by production costs and the
demand from the energy market. Varying modes of operation can have a negative impact on
reliability and demands optimization of people, process, and technologies. To operate
successfully with cyclic operations, plants will likely need to adopt new strategies that include
change in operating procedures, condition-based maintenance, equipment preservation, and
process control—which will depend on regional energy markets, seasonal conditions, and/or
geographic locations. The onset of lower carbon energy resources on the grid continues to
transform the mission for generating stations around the world. Many of the dispatchable thermal
plants being used to balance the grid are conventional steam plants. Since cycling can have a
major impact on plant reliability, grid stability can be negatively affected if the assets are
improperly managed.
Keywords
Assessments
Benchmarking
Operational flexibility
Subcritical
Supercritical
11534825
9. EXECUTIVE SUMMARY
vii
Deliverable Number: 3002019900
Product Type: Technical Report
Product Title: High-Level Flexibility Assessment and Benchmarking Tool: Conventional
Steam Generators
PRIMARY AUDIENCE: Conventional Steam Generator – Flexible Operations Management Team
SECONDARY AUDIENCE: Conventional Steam Generator Operations and Maintenance Teams
KEY RESEARCH QUESTION
The objective for this project is to provide an overview and set of templates that helps the user identify and
assess key areas of focus for managing conventional steam generators operating under flexible
operations.
RESEARCH OVERVIEW
The report provides a comprehensive and cross-sector guideline for key areas and serves as a tool that can
be used to conduct a self-assessment against standards of performance.
KEY FINDINGS
The findings within this report are an accumulation of information organized from past generation sector
research that aligned various programs and working groups to address changes in operating mission
profiles.
WHY THIS MATTERS
Due to changes in power generation, thermal power generating plants are increasingly seeking improvements
in operational flexibility while minimizing the negative implications on the plant and equipment.
This report provides guidance on how to assess various systems and equipment to help achieve operating
goals. The effort was a collaborative project that addressed relevant global issues and it is intended to
accelerate elevating industry knowledge.
HOW TO APPLY RESULTS
The information presented in this report is intended to assist management and technical personnel at thermal
power plants to better understand the complexity of flexible operations and identify areas that need
improvement. Guidance is provided for owners and operators of thermal power plants to assess flexible
operations.
11534825
13. xi
LIST OF FIGURES
Figure 1-1 Global electricity generation 1971–2019, Global Energy Review 2020, IEA,
Paris...................................................................................................................................1-2
Figure 1-2 Basic operational flexibility descriptions ...................................................................1-3
Figure 1-3 Illustration of load following: cold, warm, and hot starts ...........................................1-4
Figure 1-4 GADs data: EFOR coal units >100MW vs. annual start range.................................1-4
Figure 1-5 GADs data: varying operating modes vs. boiler circulation type ..............................1-5
Figure 1-6 Once through supercritical steam generator ............................................................1-5
Figure 1-7 Challenging flexible operations trends with heat rate and EFOR .............................1-6
Figure 1-8 Common locations for flexibility challenges on a coal fired steam generator ...........1-7
Figure 1-9 Ten templates for comprehensive flexibility assessment .........................................1-9
Figure 1-10 Project approach for the assessment tool application ............................................1-9
Figure 1-11 Assessment and benchmarking score overview...................................................1-11
Figure 1-12 Assessment summary table and scoring metric ...................................................1-12
11534825
15. 1-1
1
INTRODUCTION AND GUIDANCE
The demand for coal-power plant flexible operations is largely driven by the onset of variable
renewable energy on the grid and relative production costs. Conventional steam generating units
that are more efficient and have lower electricity production cost typically operate at a higher
capacity factor. Externalities—such as regulatory requirements and fuel pricing—can also
significantly impact a unit’s operational load demand.
Two common operating strategies used to address flexibility are: a reduction in minimum
operating load and/or fuel changes to remain competitive with the energy markets. However, the
need to apply these strategies is contingent on the power market in which the unit is dispatched.
For example, a unit is unlikely to remain economically viable if required to be in extended
shutdown (economic reserve) for long periods of time. However, that same unit could remain
economically viable if it operates in a capacity market where the plant is compensated for being
available to generate power.
Until recently, there had been very little demand for energy storage because variable renewable
energy sources have provided a small percentage of electricity. However, with the recent and
significant increases in renewable power generation, the demand for energy storage has shifted.
Without energy storage, there is a greater demand for conventional and “dispatchable”
generation to operate more aggressively with decreasing minimum loads and higher peak ramp
rates. Figure 1-1 illustrates the changing trend in global electricity production. This illustrative
graph compares coal against low-carbon generation sources, excluding natural gas and oil.
The onset of lower carbon energy resources on the grid continues to transform the mission of
generating stations around the world. High penetration of renewables power changes the
electricity market demand for flexible operations and often forces thermal assets to change their
mode of operation. This is especially true if a generator is bidding into day-ahead or real-time
energy markets. However, it is important to understand that many of the dispatchable thermal
plants being used to balance the grid are conventional steam plants. Because cycling can have a
major impact on plant reliability, this can negatively impact grid stability if these assets are
improperly managed.
11534825
16. Introduction and Guidance
1-2
Figure 1-1
Global electricity generation 1971–2019, Global Energy Review 2020, IEA, Paris
https://www.iea.org/reports/global-energy-review-2020)
For a non-flexible plant, startup, and load following can result in significant damage in a short
amount of time if process controls, safety interlocks, and protection systems are not optimized
for the various modes of operation. Considering this, flexible operations demand a systematic
approach, continuous improvement, and a focus on proactive damage mitigation in various plant
systems.
Modes of Operations
Table 1-1 provides a high-level description of some of the different modes of operation for
conventional steam generators.
Table 1-1
Description of operating modes
Base Loaded Units High net capacity factor; minimal starts (<10 annually)
Reserve Shutdown Extended: >1,000 hours or limited: <1,000 hours (annually)
Load Following Service factor >70%, minimal starts (<10 annually), frequent load changes
Minimum Load Operations at minimum design load and/or a reduced minimum load
Two Shifting Average run time: < 24hours; typically: >50 Starts per year
Flexible Operations
Many conventional steam generators were designed and built for baseload operations but are
now required to operate in varying operating modes. At a high level, one may evaluate (or
benchmark) flexibility performance as the ability to meet a wide-load range and/or do it in timely
manner. However, the long-term availability, efficiency, production cost and the impact on
emissions from unit cycling are likely to have on unit dispatchability and sustainability in the
energy market should also be considered. Figure 1-2 describes the basic aspects of operational
flexibility.
11534825
17. Introduction and Guidance
1-3
Figure 1-2
Basic operational flexibility descriptions
To manage a generation flexibility program, it is first imperative to understand the electricity
market, load profiles and demand on the dispatchable generation assets. Establishing flexibility
goals should be based on both current and future forecasted demands. Then, align teams and
resources to achieve those goals. After that, it is all about applying a systematic approach toward
achieving the flexibility goals. Flexible operations demand can vary significantly from region to
region. In some cases, cycling may be minimal. While in other cases, a plant may need to reside
in a short- or long-term reserve shut-down regime.
If units are not properly managed both online and offline, such conditions can be damaging to a
variety of system components. Cyclic operations demand attention to detail in managing
operational models and protecting assets from common damage mechanisms that occur from
thermal transients, corrosion and/or issues with process controls or managing the required water
and steam chemistry conditions. Depending on plant configuration and design characteristics, the
duration required from startup to full load will vary. Furthermore, the type of start (cold, warm,
hot) will vary the start-up timing and requirements for returning to normal operations from a
reserve shut down. Table 1-2 provides common criteria for start types.
Table 1-2
Common “off-load” criterial for conventional steam generators
Starts “Off-Load” Criteria
Pre-Start HP Steam Turbine Casing
Temperature
Hot Start <8 hours off-load 700F – 750F (371C – 400C)
Warm Start 8 to 48 hours off-load 320F – 750F (160C – 400C)
Cold Start >48 hours off-load 250F – 320F (120C – 160C)
Cold Ambient >48 hours off-load 70F (21C)
As power generating stations continue to shift their mission from baseload to cyclic operations,
it’s imperative that start-up and shutdowns be managed as best as possible to minimize the
negative impact on reliability.
One can compare the design starting and loading curves in to order to determine discrepancies
from the design curves. However, feedback to the operators is usually delayed. Automated
reports could help operations management with post start-up critiques with the operations team
and/or identify control loops that need improvements due to lack of maintenance or tuning.
Furthermore, and more importantly, improvements can be made to the start-up process to
On/Off
•Taking the unit in
and out of service.
(Hot, warm, or cold
starts).
Turndown
•Expanding the
operation range of a
unit’s output by
lowering its
minimum
sustainable load
and heat input.
Fast Ramping
•Units that can keep
pace with rapidly
changing load
demand will be
selected for
dispatch.
Load Cycling
•Unit remains in
service, but load is
varied widely, from
maximum to low
load.
11534825
18. Introduction and Guidance
1-4
improve consistency in returning to service for the dispatcher or the independent system operator
(ISO) needs. This is especially important with cold starts, which are often the most damaging.
Figure 1-3 illustrates load following operation and the types of starts.
Figure 1-3
Illustration of load following: cold, warm, and hot starts
Referencing 40 years of data from the United States and Canada, there is clearly a correlation
between equivalent forced outage ratings (EFORs), the number of starts, and the age of the unit.
The younger units operating with increased flexibility seem to recover better than the older units
perhaps because operators learn to manage the equipment better with more frequent annual
starts. However, with older units, shifts to flexibility without the proper actions and upgrades can
lead to a rapid rise in the unit’s equivalent forced outage rate. Figure 1-4 is North American
Electric Reliability Corporation Generating Availability Data System data for coal units, grouped
by age and annual starts versus their average annual EFOR.
Figure 1-4
GADs data: EFOR coal units >100MW vs. annual start range
Figure 1-5 references the same 40-year data set from the United States breaking it down by
operating mission. In most cases, as the number of starts and age increase, so does the EFOR.
Baseload, Load Following and Limited Shutdown operating modes have the lowest EFORs.
0
5
10
15
20
0-10 Starts 10-20 Starts 20-30 Starts 30-40 Starts 40-50 Starts >50 Starts
EFOR
0-5 Years 5-15 Years 15-25 Years 25-35 Years 35-45 Years 45-55 Years
11534825
19. Introduction and Guidance
1-5
Figure 1-5
GADs data: varying operating modes vs. boiler circulation type (CF = capacity factor)
As illustrated in the previous figure, two-shifting once-through supercritical units (see Figure 1-6
for a typical layout) have traditionally resulted in the highest EFOR, which makes a case to two-
shift subcritical units when necessary.
Figure 1-6
Once-through supercritical steam generator
0
10
20
30
40
50
60
70
80
Baseload Load
Following
Extended
Shutdown
Limited
Shutdown
Minimum
Load
CF<30
Minimum
Load
CF<50
Minimum
Load
CF<70
Two-Shift
EFOR
Forced Natural Once Through
11534825
20. Introduction and Guidance
1-6
Operations with a flexible future can be more complicated with more stringent air pollution
control regulations or operating loads that yield lower thermal efficiencies. Other variables may
include challenges from firing lower-quality fuels or operating with constrained budgets due to
higher-fixed costs with the lower generating demand and output. Flexibility scenarios that reduce
capacity factor, increase cycles or leave assets in reserve shutdowns while awaiting economical
dispatch create challenges for both the system operator and generators. The system operator must
deal with variability, uncertainty, load frequency control, scheduling reserves, managing the
transmission network, ancillary services and cost.
Generators have to not only manage operations with lower capacity factors, but also be available
to meet dispatch demands to synchronize with the grid and meet ramp rates in a safe and
efficient manner that not only balances the grid, but also operating budgets, maintenance
overhauls and the generation asset fuel strategy. Figure 1-7 illustrates the general relationship
between efficiency and reliability with turndown and increased annual starts.
Figure 1-7
Challenging flexible operations trends with heat rate and EFOR (MCR = maximum
continuous rating)
The degree to which the overall heat rate is affected by part-load operation depends on the part-
load efficiencies of the individual system components as well as the type of fuel selected for use.
Plant heat rate can vary significantly between full and low load. Thus, to interpret a plant’s
thermal efficiency and evaluate the heat losses, one must have an accurate measurement of both
turbine cycle heat rate and boiler efficiency to understand where the losses originate and to
validate the potential for improvement when implemented. For the impact on EFOR, many
locations throughout the cycle can become a challenge as illustrated in Figure 1-8.
11534825
21. Introduction and Guidance
1-7
Figure 1-8
Common locations for flexibility challenges on a coal fired steam generator
This may encompass challenges with the water and fuel entering a unit (e.g., managing dissolved
O2, fuel quality and consistency, impacting flame stabilization at low loads) or even air emissions
leaving the stack. Because of this, seemingly simple processes, such as fuel management, milling
strategies and fuel consistency, can be a challenge for management of system inputs. To
overcome flexibility challenges, a systematic approach to optimization is required to address
variables, such as mill blue-printing on pulverized coal (PC)-fired units, combustion
optimization for managing heat transfer, boiler circulation, temperature control and protection
systems for the air, water and gas management systems. Furthermore, thermal expansion,
thermal fatigue and corrosion can also be factors impacting major components, piping, casing or
structural components within the boiler turbine or balance of plant. Considering all this, it is
important to understand that the negative impacts of flexible operations must be offset with
flexibility management strategies. Otherwise, the damage imposed by non-optimal performance
can create more significant challenges with the inability to balance a preexisting and constrained
operations and maintenance budget.
Historically, most staffing levels were set based on steady-state operation, a crew smaller than
what may be required when operating more flexibly. Thus, operations strategy is likely required
to address the support required to ensure reliable and safe plant startups. Site strategy may
require staff resource sharing and training to ensure the staff are confident in managing a flexible
operations program. If not already completed, operational procedures will also need to be
updated to reflect lessons learned and best practices.
The program must ensure the control system has the proper procedures, training, simulators
and/or automation for ensuring properly sequenced startup and shutdowns. Depending on
commercial viability of a plant or other factors, there may be a requirement to manage a plant in
a non-operational state, which may require plant preservation measures for the boiler, turbine
cycle, environmental controls and ancillary equipment. Layups should be classified as either
short term or long term. The benefit of a short-term lay-up is that the plant remains available for
generation, with little increase in its notice period to be ready for synchronization. As the plant
enters an operational state not previously experienced, the unit will be more vulnerable to
damage and performance degradation. Performance monitoring, diagnostics and data
assessments, can be used to evaluate unit’s performance and strategy as a platform which
supports the overall systematic approach being applied to achieve flexibility goals. It is
11534825
22. Introduction and Guidance
1-8
imperative to understand that all units vary. Thus, conducting individualized and independent
unit assessments is critical to understand flexibility impacts as well as site specific details. Some
of those details are described below:
• Age and sizing (MW capacity)
• Maintenance-related activities
• Equipment design variables and manufacturer
• Vintage of technologies installed
• Fuel type, quality, and deviation from design fuel specifications
• Environmental equipment (including retrofits)
• History and timing of past and future overhauls (boiler/turbine/BOP)
• Plant configuration, size, economies of scale, and scope
• Process controls and instrumentation
• Retrofit of equipment, especially for greater flexibility in moving among duty cycles
• Modes of flexible operation over time, measured with variables such as number of hot starts,
warm starts, cold starts, and load-following requirements (e.g., two-shifting, double two-
shifting, weekend shutdowns, load-following, load-cycling, and/or sporadic operations)
It is also important to understand that reliability and flexibility of conventional steam generators
is interrelated with performance of various subsets of equipment, operational and maintenance
actions that are driven by people, process and the application of technologies that assist with
performance sustainability and market availability.
The mission profile changes for conventional steam generators demands integration of cost-
effective defense processes and technologies that help adapt, work smarter and protect assets
under challenging conditions. As we evolve with advancements in power generation
technologies, conventional steam generators need to build on the fundamentals and lessons
learned from the past. This includes both quantitative and qualitative actions that cost-effectively
drive awareness, support best practice application and encourages benchmarking and defense
strategies to protect assets.
With any successful programs, it is important to first identify the gaps needing improvement,
create awareness and then prioritize improvement actions. It is important to understand that the
negative impacts of flexible operations must be offset. Otherwise, the damage caused can create
more significant challenges including inability to balance the budget. Achieving operational
flexibility goals is a complex process that must have senior management’s full commitment.
This recognizes that most thermal plants can operate flexibly in the short-term. However, to
sustain reliability and acceptable performance, it is important to conduct flexibility assessments
to identify top areas needing improvement. This should take into consideration impacts from
multiple areas of the station, including: 1) boiler, 2) turbine generator, 3) balance of plant, and 4)
environmental controls.
11534825
23. Introduction and Guidance
1-9
The templates included address multiple areas for comprehensive evaluation, including the ten
areas for evaluation given in Figure 1-9.
Figure 1-9
Ten templates for comprehensive flexibility assessment
Comprehensive Assessments
As plant teams develop an understanding for flexibility, they must also understand the impacts of
flexibility on availability, efficiency and environmental controls. This was the inspiration for
developing the templates to help drive awareness with comprehensive flexibility assessments and
to provide a path for benchmarking against a high-level standard of performance. Figure 1-10
illustrates the project approach for a complete assessment applying the flexibility templates.
Figure 1-10
Project approach for the assessment tool application
11534825
24. Introduction and Guidance
1-10
Conducting High-Level Assessments
A comprehensive assessment should address a multitude of items and suggest needs for
improvements. Considering this can be overwhelming, the reason for developing the assessments
into ten templates with performance standards, is to allow small groups of competent people
working under the direction of the flexibility team leader to accomplish a review in a productive
manner.
It should also be mentioned that this activity should be sponsored by senior management,
showing “top-down” support for the collaborative initiative. The designated team leader
organizing the assessment should have comprehensive knowledge of all areas being evaluated
and be able to provide the following leadership:
1. Provide overall direction.
2. The assessment lead would ideally manage a station or fleet flexibility program.
3. Demonstrated ability to plan, communicate, and obtain buy-in for implementation of action
items required.
4. Perform or facilitate the assessments aligning the team members from each area.
5. Communicate and incorporate plant improvement projects that help resolve deficiencies that
have been identified.
6. Coordinate the annual update for site self-assessment evaluations and audits of controllable
variables and mitigation efforts to offset for negative impacts.
7. Provide specialized technical support when required.
8. Arrange and conduct training as requested or needed to address gaps.
9. Maintain annual communications with corporate, regional and/or station management.
10. Provide fleet technical support and develop action plan recommendations for performance
improvements needed and overcome roadblocks by first describing the challenges,
identifying system owners, resources and prioritizing actions.
High-Level Assessments
All areas of the assessments are not equally weighted regarding importance. Thus, a place has
been provided for input of a weighting (WT) factor for the variable being assessed. A weighting
factor of (1) represents a “low-impact” variable. A weighting factor of (2) represents a “medium
impact” variable. A weighting factor of (3) represents a “high-impact” (important) variable.
Weighting factors are subjective and will vary from unit to unit. Thus, the current inputs can be
adjusted when evaluating the impact. Furthermore, within the template, the green section
references the ideal (best achievable) score of three points, while the needs improvement
(yellow) section is two points and the “at risk” (red) zone is a score of one.
After the weighting and assessment score have been evaluated, the weighted assessment score is
a simple calculation of the weighted value times the assessment score. This weighted score can
then be benchmarked against the “best-achievable” score with notations, action items and
resources to be evaluated following the high-level assessment.
11534825
25. Introduction and Guidance
1-11
Figure 1-11
Assessment and benchmarking score overview
Conducting a comprehensive flexibility assessment with the intent of understanding challenges
and improving an aging asset’s integrity over time can be complex. This is especially true with
personnel changes or an aging workplace where responsibilities shift. Therefore, having a
program with a benchmarking guide to manage flexibility information and standards of
performance, can be considered part of a defense strategy to manage flexible operations at a
station, across a fleet and/or even globally.
Comprehensive and integrated benchmarking templates provide a foundation for identifying gaps
where technologies have been developed to address common issues intended to help with the
preparation and management of flexible operations needed for conventional steam generators
when adapting to a new mission. Although low carbon resources are being integrated to replace
some aging assets, fossil fuels and conventional steam generators will remain a vital part of
energy security to most countries around the world for many years to come. Thus, these stations
must adapt to flexible operations as the grid demands more cyclic operation.
Staff must understand potential damage mechanisms and considerations must be given to the
impacts of plant cycling on damage rates. Critical risks related to increased production costs,
high probability of equipment failure and reduced-life expectancy demands effective
management actions. In addition, staff should make safety and safe plant operations a top priority
as the various modes of operations are assessed. The flexibility assessment tool can help in a
number of critical areas that are core to program management. Flexibility assessment and
benchmarking helps identify gaps and opportunities for improvement, drive awareness and
prioritization. Furthermore, it will support development projects or laying the groundwork for
more in-depth flex studies that may be required.
11534825
27. 2-1
2
TEMPLATES
High-Level Flexibility Assessment Templates:
1. Equipment operating modes
2. Pressure parts and life availability
3. Operations
4. Maintenance
5. Combustion and boiler performance
6. Instrumentation and controls
7. Environmental controls
8. Steam cycle chemistry
9. Turbine/generator
10. Balance of plant
11534825
28. Templates
2-2
High-Level Flexibility Assessment Template 1 Equipment Operating Modes
Equipment Operating Modes
Fuel considerations should be taken into consideration with the above.
Fuel Type Check Applicable Comments on Fuel Challenges (if any) – on Unit Flexibility
Low GCV coal
Medium GCV Coal
High GCV Coal
Fuel Oil
Dual Firing Capability – Coal/Gas
Dual Firing Capability – Coal/Oil
Dual Firing Capability – Coal/Biomass
Other
GCV = Gross Calorific Value
WT 3 2 1
1 Ramp Rate, % /minute 2 6 4 2
2
Minimum Load
Turndown Capability
2 <30 >30 >40
3
Ramp-Up time for Hot Start
Synchronization to full load
2 1 Hour 2 Hours >3 Hours
4
Ramp Up time for cold start
Synchronization to full load
2 2 Hour 4 Hours >7 hours
11534825
29. Templates
2-3
Equipment Operating Modes
WT 3 2 1
5
What is the most typical operating
mode?
3 Baseload
Expanded the operation range of
a unit’s output by lowering the
unit’s minimum load;
Unit remains in service, but load
is varied widely, running from
maximum load to low load;
Units expected to rapidly change
load demand
Cycling on/off
Taking the unit in and out of
service. (Inducing hot,
warm, or cold starts)
6 Number of Starts per year (Hot) 3 <15 >15 <30 > 30
7 Number of Starts per year (Warm) 3 <15 >15 <30 > 30
8 Number of Starts per year (Cold) 3 <15 >15 <30 > 30
9 Reason for starts per year inquiry 2
Re-starts are planned and/or
driven by market demands
Starts are sometimes related to
reliability issues and/or water/fuel
constraints
Starts are most often
related to reliability issues
and not market, fuel or
water constraint driven
10
Extended or reserve shut down
The Unit is Cold Ambient
Temperature, 70F (21C)
2 <1,000 hours
>1,000 hours
<2,000 hours
>2000 hours
11 Capacity Factor 2 >70% <70% >50% <50%
12
Start-up temperature
(first stage metal)
2
Most startups are Hot
<8 hours off-load
700F-750F (371C – 400C)
Most start-ups are Warm
>8 and <48 hours off-load
320F – 750F (160C – 400C)
Most startups are Cold
>48 hours off-load
250F-320F (120C – 160C)
11534825
30. Templates
2-4
Equipment Operating Modes
WT 3 2 1
13 Net Heat Rate - best achievable across the load range 2
Near
Design
< 2% from
design
>2% from
design
14 Has a reduced minimum load goal been established? 2 Yes Partial No
15
Has the reduced minimum load goal been evaluated and reviewed with OEMs to
discuss the impact of the temperature and pressure changes on major equipment?
2 Yes Partial No
16 Has a reduced minimum load performance review been conducted and understood? 2 Yes Partial No
17 Have potential roadblocks been identified? 2 Yes Partial No
18 Have minimum load reduction operation trials and studies been conducted? 2 Yes Partial No
19 Have minimum load Implementation of upgrades been implemented? 2 Yes Partial No
20
If upgrades have been implemented for reducing minimum load, have re-
test/evaluations been conducted?
2 Yes Partial No
21
Ramp Rate demands and/or Automatic Generation Control (AGC) is understood and
optimized
2 Yes Partial No
22 Start-up Time is understood and optimal for all units and the fleet 2 Yes Partial No
23 Ramp rate speed is understood and optimal for all units and the fleet 2 Yes Partial No
24 Cycling scenarios are understood and managed accordingly 2 Yes Partial No
25
Dispatch Optimization (Efficiency, availability, emissions impact) all taken into
consideration
2 Yes Partial No
26 Cold, warm and hot start provisions are understood and optimal 2 Yes Partial No
27
Lay-up and/or reserve shut-down requirements are understood and optimized for
flexible operations (Boiler, Turbine, BOP equipment)
2 Yes Partial No
11534825
31. Templates
2-5
Equipment Operating Modes: Energy Market Assessment
WT 3 2 1
28 Baseload demand understood 1 Yes Partial No
29 Peak ramping rate understood 1 Yes Partial No
30 Peak demand understood 1 Yes Partial No
31
Typical/seasonal energy demands for a system
understood
1 Yes Partial No
32 Peak to base demands understood 1 Yes Partial No
33 Minimum load demands are understood 1 Yes Partial No
34 On/off timing is understood Yes Partial No
35 Automatic Generation Control (AGC) is operational 1 Yes Needs Improvement No
36
Restricted governor mode operation (RGMO) or free
governor mode of operation (FGMO) for primary
frequency control
1
No issues with
primary frequency
control
Some issues with
primary frequency
control
Issues with primary
frequency control
37
Reserves regulation ancillary services (RRAS) to
restore the frequency level at desired level and to
relieve the congestion in the transmission network
1
No issues with
restoring frequency
control
Issues with restoring
frequency control
sometimes exist
Constant issue
11534825
33. Templates
2-7
High-Level Flexibility Assessment Template 2 Pressure Part Life Assessment
Pressure Parts and Life Assessment
WT 3 2 1
1 Equivalent availability loss (%) 2 <.5 >.5 or <1.5 >1.5
2 Ranking System (priority) in place for BTF Mechanisms in Plant/System 2 Yes No
3 Do you have any cycle chemistry related BTF Mechanisms 2 No Yes
4
What percentage of superheater and reheater circuits in your system/plant do you
know the remaining life (using oxide scale technique)
2 All >50% <50%
5 Do you have a BTF forced outage plan other than “fix it quick” (Must be in writing)? 2 Yes No
6
Do you have Action Plans (in writing) for repeat BTF that addresses damaged tubing
and mitigating actions? See Appendix for Examples
2 Yes No
7
Do you normally continue running with known tube leaks (written procedure) - except
in a system emergency
2 No Yes
8
Do you normally use pad welding - written procedure (except in a system
emergency)
1 No Yes
9 Do you have a set of BTF goals/objectives? 1 Yes No
10 Does your organization have a formal life assessment program in place? 3
Corp. Directed
and/or Multi-
Disciplined Team
Individual
coordinator
No formal
Program
11
Do you force cool the boiler?
Do your operators have access to written, plant-specific procedures for responding to
out-of-normal temperature pressure/conditions?
2 Yes No
12
Have you experienced any operational issues such as over-temperature/over-
pressure in the past 5-years?
2 No Yes
13 Do you monitor steam chemistry (MS or RH) limits? 2 Yes No
14 Do you have written procedures for reducing load if indications are identified? 2 Yes No
BTF = Boiler Tube Failure MS = Main Steam RH = Reheat
11534825
34. Templates
2-8
Pressure Part Life Assessment
WT 3 2 1
15 Do you have established inspection intervals for all major equipment 2 Yes No
16 Do you inspect 100% of seam-welded pipes? 2 Yes No
17
Do you perform remaining life analysis/calculations to establish inspection locations and
intervals?
2 Yes No
18
Do you (or your inspection organization) have calibration blocks for every size pipe in your
system?
2 Yes No
19 Do you utilize advanced inspection methods (TOFD, Focused Array, Acoustic emission, etc.) 2 Yes No
20 Are NDE inspectors fully qualified via an accredited program? 2 Yes No
21 Do you have multi-discipline involvement in your failure analysis 3 Yes No
22
Are failure analysis, root cause analysis, and plan of elimination performed on every
indication/failure?
3 Yes No
23 Do you record and chart all failures or indications? 3 Yes No
24 Do you involve a staff metallurgist (or have equivalent access) in all failures? 3 Yes No
25
Do you have qualified welding procedures for every component in your unit? (Including all
materials)
2 Yes No
26 Do you have sample removal and re-installation/repair procedures 2 Yes No
27 Is permanent repair expressed in every application? 2 Yes No
28 Do you utilize qualified temper bead welding procedures? 2 Yes No
29 Life assessment program for all high energy piping (including clam shell elbows)? 1 Yes No
30 Do you monitor temperature for MS & RH piping? 1 Yes No
31 Do you predict life for every pipe weld or weld joint on High Energy Piping (HEP) 1 Yes No
32
Do you check all HEP components for long seam welds even if drawings indicate the
component is seamless?
1 Yes No
TOFD = time of flight diffraction NDE = nondestructive examination
11534825
35. Templates
2-9
Pressure Part Life Assessment
WT 3 2 1
33 Formal documentation of HEP inspection & analysis results 1 Yes No
34
Are follow up actions (based on inspection/analysis results) part of your High Energy Piping life
assessment program?
1 Yes No
35 Life assessment program in place for all high temperature headers? 2 >80% 60-80% <60
36 What percentage of headers have been inspected for ligament damage or borehole cracking? 2 >80% 60-80% <60
37 Do you monitor temperature for every header at multiple locations along its length? 2 Yes No
38 Formal documentation of inspection & analysis results? 2 Yes No
39
Are follow up actions (based on inspection/analysis results) part of your header life assessment
program?
2 Yes No
40 Life assessment program for all drums? 1 Yes No
41 Do you predict life for all economizer components? 1 Yes No
42 Do you monitor through-wall temperature gradients for economizers? 1 Yes No
43 Do you utilize low flow control valves on feedwater lines? 1 Yes No
44 Formal documentation of inspection & analysis results? 1 Yes No
45
Are follow up actions (based on inspection/analysis results) part of your low temp header, drum,
economizer life assessment program?
1 Yes No
46 Do you have procedures in place to keep from topping off a hot drum/economizer? 1 Yes No
47 Formal FAC program in place? 2 Yes Partial No
48 Formal documentation of inspection & analysis results? 2 Yes No
49
Are follow up actions (based on inspection/analysis results) part of your feedwater system life
assessment program?
2 Yes No
FAC = Flow-accelerated corrosion
11534825
36. Templates
2-10
Pressure Part Life Assessment
WT 3 2 1
50 Does your organization have a hanger life assessment program? Does it include the following? 2 Yes No
51 Do you take photos of hangers in hot/cold positions? 2 Yes No
52 Do you test actual load supported by hangers? 2 Yes No
53 Have you inspected hanger clamps, blocks, welds, attachments to piping? 2 Yes No
54 Do you chart hanger hot/cold locations? 2 Yes No
55
Do you perform a piping analysis which calculates loads, displacements and elastic as well as
creep stresses?
2 Yes No
56 Do you compare hanger observation results to design? 2 Yes No
57 Formal documentation of inspection and analysis results? 2 Yes No
58 Are follow up actions (based on inspection/analysis results) part of your hanger program? 2 Yes No
59
Monitors parameter-based limits (actionable guidance) being given to protect station equipment
(e.g., thick-walled components, drum, start-up vessel, headers, etc.)
1 Yes No
60
Understand and Identify pressure part vulnerabilities and have Implemented defense strategies to
mitigate failures (e.g., see cyclic/temperature protection system inquiry in Appendix)
1 Yes No
11534825
37. Templates
2-11
Temperature Representation - Pressure Part Assessment
SUB SUP WT 3 2 1
61 X X Furnace exit gas temperature (FEGT) 2 Representative Needs Improvement Inadequate or N/A
62 X
Water wall outlet header steam
temperature rate of change
2 Representative Needs Improvement Inadequate or N/A
63 X
Water Wall Outlet Header Metal
Temperature
2 Representative Needs Improvement Inadequate or N/A
64 X X Superheat outlet header temperature 2 Representative Needs Improvement Inadequate or N/A
65 X X
SH inlet/outlet attemperator temps to
detect valve leak-by
2 Representative Needs Improvement Inadequate or N/A
66 X X
RH inlet/outlet attemperator temps to
detect valve leak-by
2 Representative Needs Improvement Inadequate or N/A
67 X X Reheat outlet header temperature 2 Representative Needs Improvement Inadequate or N/A
68 X
Drum temperature differentials (top-to-
bottom)
High stress w/ elevated differentials can
lead to drum humping
2 Representative Needs Improvement Inadequate or N/A
69 X X
Superheater tube metal temperatures
High differential temps from the header to
tube can result in cracking
2 Representative Needs Improvement Inadequate or N/A
70 X X Reheater Tube Metal Temperatures 2 Representative Needs Improvement Inadequate or N/A
71 X X Economizer Inlet Temperatures 2 Representative Needs Improvement Inadequate or N/A
72 X X Economizer Outlet Temperatures 2 Representative Needs Improvement Inadequate or N/A
73 X X Furnace Exit Gas Temperature (FEGT) 2
< 50°F (10°C)
Deviation from
design
< 75°F (24°C)
Deviation from
design
>75°F (>24°C)
Deviation from
design
SUB = Applicable to subcritical unit SUP = Applicable to supercritical unit
11534825
38. Templates
2-12
Temperature Representation: Pressure Part Assessment
SUB SUP WT 3 2 1
74 X
Water Wall Outlet Header Steam
Temperature Rate of Change
2 < 75°F/HR (<24°C/HR) >75°F/HR (>24°C/HR) >100°F/HR (>38°C)
75 X
Water Wall Outlet Header Metal
Temperature
2
<25°F (<-4°C) from max.
metal temp. limit
< 15°F (<-9°C) from
max. metal temp. limit
< 10°F (<-12°C)
from max. metal
temp. limit
76 X X Superheat Outlet Header Temp. 2
< 25°F(<-4°C) of max
limit
< 15°F(<-9°C) of max
limit
< 10°F(<-12°C) of
max limit
77 X X
SH inlet/outlet attemperator
temps to detect valve leak-by
2 Yes Needs Improvement No
78 X X
RH inlet/outlet attemperator
temps to detect valve leak-by
2 Yes Needs Improvement No
79 X X
Reheat Outlet Header
Temperature
2
< 25°F (<-4°C) of max
limit
< 15°F (<-9°C) of max
limit
< 10°F(<-12°C) of
max limit
80 X Drum Temperature 2
25-50°F (-4°C - 10°C)
(top to bottom)
50 -75°F (10°C - 24°C)
(top to bottom)
>75-100°F (24°C -
38°C) (top to
bottom)
81 X X Superheater Tube Metal Temps 2
< 25°F(<-4°C) of max
limit
< 15°F (<-9°C) of max
limit
< 10°F(<-12°C) of
max limit
82 X X
Reheater Tube Metal
Temperatures
2
< 25°F(<-4°C) of max
limit
< 15°F (<-9°C) of max
limit
< 10°F(<-12°C) of
max limit
83 X X Economizer Inlet Temperatures 2
< 25°F(<-4°C) of max
limit
< 15°F (<-9°C) of max
limit
< 10°F(<-12°C) of
max limit
84 X X Economizer Outlet Temperatures 2
< 25°F(<-4°C) of max
limit
< 15°F (<-9°C) of max
limit
< 10°F(<-12°C) of
max limit
SUB = Applicable to subcritical unit SUP = Applicable to supercritical unit
11534825
43. Templates
2-17
High-Level Flexibility Assessment Template 3 Operations
Operations Assessment
WT 3 2 1
1
Shift
Turnovers
2
Guided by a checklist & include a
thorough review of appropriate
documents describing the important
aspects of the facility status.
Complemented by a discussion among
oncoming and off going operators
assuring good communications.
Turn-over checklists and
discussions need improvement
Not guided by checklist
and/or turn-over
discussions are inadequate
2
Flexibility
Training
2
Provides adequate flexible operations
training on basic principles, plant design,
system, cycle, fundamentals, safety, and
environmental requirements.
Training is infrequent and needs
improvement
Minimal training on flexible
operations is conducted
3 Simulators 2
Use of simulator and drills for flexible
operations training
Some training scenarios are used
on simulators, but infrequently
No simulator training for
flexible operations
scenarios
4 Bottling up heat 2
Operations procedures include a process
for keeping the boiler's metal
components as hot as possible during
short/overnight shutdown periods.
This is an area that that is
understood by some, but not all
staff; Needs improvement
No actions are taken to
retain system heat
5
Corrosion
mitigation
(Boiler, Turbine, BOP
components)
2
To mitigate corrosion, operations
maintains boiler tube temperatures as
high as possible during overnight or short
cycling periods. Close dampers on the air
gas side to help hold in heat and
decrease boiler tube metal cool down
rates; For longer shutdown periods (one
week), drain boiler and purge tubes with
nitrogen or dehumidified air.
The stations corrosion mitigation
actions need improvement; minimal
efforts are done to address system
corrosion
No actions are taken to
mitigate corrosion
BOP = balance of plant
11534825
44. Templates
2-18
Operations Assessment
WT 3 2 1
6
Offline temperature
management
2
Use of a boiler circulating water
pump during shutdown periods to
keep uniform temperatures across
water-wall tubes
Needs improvement No
7
Representative
temperature management
of SH and RH
temperatures
2
Adequate thermocouples are
available to monitor and control
temperatures in areas subject to
overheating boiler tubes.
There are available thermocouples,
but representation needs
improvement.
Inadequate thermocouples
and/or alarming for boiler tube
metal monitoring and/or
actions
8
Operator guidance on
tube metal excursions
2
Clear operator direction has been
provided to operations on how to
respond to high temperatures
scenarios
Operator direction needs
improvement
9 OEM start-up curves 2
Station follows OEM start-up and
operating procedures
Operations does not always follow
OEM start-up and operating
procedures
No
10
Thermography to evaluate
boiler casing and
insulation
2
Station performs thermography
tests on the boiler casing during
operation to identify missing or
damaged insulation; write work
orders to replace/upgrade insulation
as needed during outages
Has been done in the past, but not
within past year.
Some areas need improvement
Not completed or addressed
in over two years
11
Startup
procedures
2
Startup procedures are used to
optimize startup time without
violating OEM temperature
restrictions for specific components.
Procedures need improvement; OEM
temperature restrictions are
sometimes exceeded to meet start-up
time demands.
Procedures need to be
updated. Operations regularly
exceeds OEM temperature
restrictions
11534825
45. Templates
2-19
Operations Assessment
WT 3 2 1
12
Light off process and
equipment
2
Light off process and equipment optimized
for firing configurations and flame stability
at low and reduced operating loads
Light off process needs
improvement
Light off process and equipment is
not optimized; Flame stability is an
issue
13
Boiler cleaning
effectiveness
2
Boiler cleaning effectiveness evaluated
after switching to flexible operations;
Adjusts cleaning cycles according to needs
Boiler cleaning
effectiveness needs
improvement
Boiler cleaning effectiveness is not
acceptable. Slagging and/or fouling
is a major concern
14
Training/familiarity with
infrequently used
procedures.
2
Provide additional training/familiarity with
infrequently used procedures. Procedures
have been reviewed for safety, economics,
repeatability, minimization of plant damage,
and environmental performance
Training needs
improvement
Training is inadequate and needs
attention to detail to improve safety
and overall performance
15 New Procedures 2
Station develops new procedures based on
modifications, upgrades, control changes,
equipment changes; emergency action
plans with reduced staffing
Procedures need
improvement;
Procedures have not been
evaluated or updated following a
change in operational mission
and/or an equipment upgrade
16
Mitigating Air Heater
Cold-end corrosion
2
Station closely monitors exit gas
temperatures to stay above the acid dew
point and thermocouples are
representative
Cold end corrosion of the
air heaters needs
improvement
This is a significant issue that
needs to be addressed.
11534825
46. Templates
2-20
Operations Assessment: Air/Gas Systems
WT 3 2 1
17
APH ΔP Management to avoid gas
mal-distribution and/or plugging
2 Low DP (or design) Moderate DP High DP
18 APH Cleaning System 2 Good Performance Needs Improvement Unacceptable
19 APH, Cold-End Temperature Control 2 Above Dewpoint Near Dewpoint Below Dewpoint
20
Impact on Furnace Exit Gas
Temperature (FEGT)
2 Managed for Overheat Mitigation
Unrepresentative
Some control
Not Managed
Uncontrolled
21 Minimum Airflow 2
Representative and accurate
Measurement
Some control
Not Managed
Uncontrolled
22
Boiler O2
Controlled
Minimum to Maximum O2
Set-Points
2 Controlled to Curve Needs Improvement Uncontrolled
23
Burner Air Register & Sleeve
controls
2
Good Condition
Good Control
Needs Improvement
Poor Condition
Poor Control
24
Combustion Air – Fan Performance
(PA, FD)
2
Dampers controllable;
Acceptable capacity across load
range
Needs improvement
Poor control; insufficient
capacity control
25 Mill Minimum temperature control 2 Good control Periodic issues (e.g., wet coal) Poor control
26
SCR temperature measurement (via
representative grid)
2 Good control (no issues) Periodic issues (e.g., seasonal) Poor control
27 SCR minimum inlet gas temperature 2 Good control (no issues) Periodic issues (e.g., seasonal) Poor control
28 Exit Gas Temperature 2 Good control (no issues) Periodic issues (e.g., seasonal) Poor control
29 Water Wall Temps – FW Control 2 Good Control Needs Improvement Poor Control
APH = Air preheater FW = Feedwater FD = Forced draft
PA = Primary Air SCR = Selective Catalytic Reduction
11534825
47. Templates
2-21
Operations Assessment: Fuel Systems
WT 3 2 1
30 Hot air temperature control to mills 2 Adequate Needs Improvement Poor
31 Flame Quality Scanner Performance 2 Acceptable Needs Improvement Unacceptable
32 Coal Quality Impacts 2 Managed; No issues Needs Improvement Unacceptable
33 Fuel and Ash Management 2 Managed; No issues Needs Improvement Non-Optimal
34 Mill Capacity 2 Acceptable Needs Improvement Unacceptable
35 No. of Mills in-service at varying loads 2 Acceptable Needs Improvement Unacceptable
36 Mill Performance; Air/Fuel Distribution 2 Acceptable Needs Improvement Unacceptable
37 Optimal Igniter Performance (Fuel Oil, Gas) 2 Acceptable Needs Improvement Unacceptable
38 Flame Scanners 2 Acceptable Needs Improvement Unacceptable
39
Burner components, mechanical condition and
control (including tilts on a T-fired unit)
2 Acceptable Needs Improvement Unacceptable
40 Air Registers 2 Acceptable Needs Improvement Unacceptable
41 Mill and Fire Suppression System 2
Acceptable or Not an issue
(or N/A)
Needs Improvement Unacceptable
42 Coal Treatment Systems 2
Not Required
Or No Issues
Undetermined
Non-Optimal
Issues
11534825
48. Templates
2-22
Operations Assessment: Water Systems
WT 3 2 1
43 DCS Controls at minimum loads 2 Good Control Needs Improvement Poor Control
44 Minimum & Maximum Drum Level 2 Good Control Needs Improvement Poor Control
45 Minimum & Maximum Deaerator Level 2 Good Control Needs Improvement Poor Control
46 BFP Controls (on/off operations) 2 Good Control Needs Improvement Poor Control
47 FW Heater Level Controls 2 Good Control Needs Improvement Poor Control
48
Ensure Condenser Vacuum and Air In-Leakage
monitoring systems are in good working order
2 Minimum Needs Improvement High
49 Absolute Back Pressure 2 Good Needs Improvement Poor
50
Water chemistry controls and monitoring systems:
Condensate, Deaerator Inlet and Feedwater/Polisher
outlet are working properly
2 Good Control Needs Improvement Poor Control
51
Water chemistry controls and monitoring systems
working properly for Boiler Drum, Water and Steam
are working properly.
2 Good Control Needs Improvement Poor Control
52
FWH performance and final FW inlet temperature
monitoring for FAC control
2 Good Needs Improvement Poor
53
Other: Valves, Start-up Systems, Recirculation valve
and controls, Acoustic leak detection systems
2 Good; No issues Needs Improvement Poor
54 Filming Products Optimized (if in use) 2 Yes
Need Improvement
Or Undetermined
No
BFP = Boiler Feed Pump FWH = Feedwater Heater
11534825
49. Templates
2-23
Operations Assessment: Steam Control
WT 3 2 1
55
Main Steam Temperature, Minimum & Maximum
(with/without sliding press.)
2 Good control Needs Improvement Poor Control
56 RH Steam Temperature Maximum, Minimum 2 Good control Needs Improvement Poor Control
57 SH/RH, Temperature Differential 2 Good control Needs Improvement Poor Control
58 Boiler Pressure Control, Minimum & Maximum 2 Good control Needs Improvement Poor Control
59 Maximum SH/RH de-superheating spray flow rates 2 Good control Needs Improvement Poor Control
60 Boiler Expansion (joints, pipe hangers, etc.) 2 Good control Needs Improvement Poor Control
61 Boiler Tube and Header Metal Temperatures 2 Good control Needs Improvement Poor Control
62 Reduced Minimum Load Steam Temperature Control 2 Good control Needs Improvement Poor Control
63 Start-up system valves and controls 2 Good control Needs Improvement Poor Control
64 Main Steam and Reheat Attemperators 2 Good control Needs Improvement Poor Control
65 Steam Temperature Controls Tuning 2 Good control Needs Improvement Poor Control
66 Boiler Metal Temperatures (SH, RH) 2 Good control Needs Improvement Poor Control
67
Inspect Boiler Expansion, Movements: boiler, ducts,
piping – all hangars and interferences (if any)
2 Good control Needs Improvement Poor Control
68 Power Piping Inspection 2 Good control Needs Improvement Poor Control
69 Turbine steam Philosophy – first stage admission 2 Good control Needs Improvement Poor Control
11534825
50. Templates
2-24
Operations Assessment: Turbine/Generator Assessment
WT 3 2 1
70 Turbine Controls – Stop Valves 2 Good control Needs Improvement Poor Control
71 Turbine Controls – Control valves & governor valves 2 Good control Needs Improvement Poor Control
72
Turbine/Generator supervisory instrumentation
(Vibration, Differential, Expansion, Metal Temps,
Casing Expansion)
2 Good control Needs Improvement Poor Control
73 Turbine/Generator Bearing Oil System Controls 2 Good control Needs Improvement Poor Control
74
HP Bearing Vibration – Maximum
2
Sensors operable; No
issues
Needs Improvement No sensor or Issues exist
75
HP Bearing Temperature – Maximum
2
Sensors operable; No
issues
Needs Improvement No sensor or Issues exist
76
HP Stator Slot Temperatures – Maximum
2
Sensors operable; No
issues
Needs Improvement No sensor or Issues exist
77
HP & LP Hydrogen Gas Temperature – Maximum
2
Sensors operable; No
issues
Needs Improvement No sensor or Issues exist
78
LP Bearing Vibration – Maximum
2
Sensors operable; No
issues
Needs Improvement No sensor or Issues exist
79
LP Bearing Temperature – Maximum
2
Sensors operable; No
issues
Needs Improvement No sensor or Issues exist
11534825
51. Templates
2-25
WT 3 2 1
80
LP Stator Slot Temperatures – Maximum
2
Sensors operable; No
issues
Needs Improvement No sensor or Issues exist
81
Generator Protective Systems (Power Factor)
2
Sensors operable; No
issues
Needs Improvement No sensor or Issues exist
82
Generator Hydrogen
2
Sensors operable; No
issues
Needs Improvement No sensor or Issues exist
83
Generator Cooling Systems (Stator cooling)
2
Sensors operable; No
issues
Needs Improvement No sensor or Issues exist
84
Generator Automatic Voltage Regulator Tuning
2
Sensors operable; No
issues
Needs Improvement No sensor or Issues exist
11534825
52. Templates
2-26
Operations Assessment: Turbine
WT 3 2 1
85
Turbine steam Philosophy – first stage
admission
2 Sensors operable; No issues Needs Improvement No sensor or Issues exist
86 Turbine Controls – Stop Valves 2 Sensors operable; No issues Needs Improvement No sensor or Issues exist
87
Turbine Controls – Control valves & governor
valves
2 Sensors operable; No issues Needs Improvement No sensor or Issues exist
88
Turbine/Generator supervisory
instrumentation (Vibration, Differential,
Expansion, Metal Temps, Casing Expansion)
2 Sensors operable; No issues Needs Improvement No sensor or Issues exist
89
Turbine/Generator Bearing Oil System
Controls
2 Sensors operable; No issues Needs Improvement No sensor or Issues exist
90 HP & IP Bearing Vibration – Maximum 2 Sensors operable; No issues Needs Improvement No sensor or Issues exist
91 HP & IP Bearing Temperature – Maximum 2 Sensors operable; No issues Needs Improvement No sensor or Issues exist
92
HP & IP Thrust Bearing Temperature –
Maximum
2 Sensors operable; No issues Needs Improvement No sensor or Issues exist
93 HP & IP Thrust Bearing Position (Wear) 2 Sensors operable; No issues Needs Improvement No sensor or Issues exist
94 HP& IP Differential Expansion - Rotor Long 2 Sensors operable; No issues Needs Improvement No sensor or Issues exist
94 HP & IP Differential Expansion – Rotor Short 2 Sensors operable; No issues Needs Improvement No sensor or Issues exist
96 LP Bearing Vibration – Maximum 2 Sensors operable; No issues Needs Improvement No sensor or Issues exist
97 LP Bearing Temperature – Maximum 2 Sensors operable; No issues Needs Improvement No sensor or Issues exist
11534825
53. Templates
2-27
Operations Assessment: Auxiliary/Environmental Systems
WT 3 2 1
98 Crossover or Bypass Dampers Controls 2 No issues Needs Improvement Issues exist
99 Stack Plume at Low Load 2 No issues Needs Improvement Issues exist
100 Precipitators 2 No issues Needs Improvement Issues exist
101 Baghouse – Bag Condition 2 No issues Needs Improvement Issues exist
102 Ensure Operating Permit Allows Low Load Operation 2 No issues Needs Improvement Issues exist
Operations Assessment: Boiler Performance
Boiler Performance WT 3 2 1
103
Boiler Cleaning System
(soot blowers, on/offline cleaning process)
2 Good performance Needs Improvement Poor Performance
104
Burner Optimization Controls
(air-fuel distribution, tilts on T-fired units; air-fuel mgmt.)
2 Good performance Needs Improvement Poor Performance
105
Boiler Stoichiometry control; Air In-Leakage
Management
2 Good performance Needs Improvement Poor Performance
106 Boiler controls form mitigating thermal transients 2 Good performance Needs Improvement Poor Performance
107
Soot Blower (SB) Thermal Drains; SB header
temp./pressure monitoring
2 Good performance Needs Improvement Poor Performance
108 Steam Coils (for cold-end temperature control) 2 Good performance Needs Improvement Poor Performance
109 Dew point & corrosion control 2 Good performance Needs Improvement Poor Performance
110 O2
& CO monitoring 2 Good performance Needs Improvement Poor Performance
111 Flame Stability and Mill Configuration Planning 2 Good Performance Needs Improvement Poor Performance
11534825
54. Templates
2-28
Operations Assessment: Emissions Control
WT 3 2 1
112
NOX
Limits
2 No issues Needs Improvement Issues
113
SO2 -
SO3
Limits
2 No issues Needs Improvement Issues
114
NH3
Slip Limits
2 No issues Needs Improvement Issues
115
Opacity Limits
2 No issues Needs Improvement Issues
116
Minimum Temps at SCR inlet limits
2 No issues Needs Improvement Issues
117
ID Fan Capacity
(May impact availability of Boiler O2
) 2 No issues Needs Improvement Issues
118
Controls Optimization (capability to safely and
efficiently meet the missions required)
2 No issues Needs Improvement Issues
11534825
55. Templates
2-29
Operations Assessment: Alarms/Graphics
WT 3 2 1
119
Alarm
Rates
2
Average and the peak alarm rates are under
control for foreseeable plant operating
scenarios; Dynamic and state-based
techniques are used to improve the real time
performance.
Occasional alarm flooding Alarm flooding is common
120 Graphics 2
Effective graphics:
Gray backgrounds to minimize glare; No
animation; Black process lines, with major
lines shown slightly thicker; Limited use of
color.
Embedded trends of important process
parameters; A layout wherein the process
flow is from left to right whenever possible.
A layout that is generally consistent with the
operator’s mental model of the process;
Logical and consistent navigation methods;
Display access with a maximum of three
mouse clicks or keystrokes; Techniques used
to minimize the possibility of operator
mistakes and provide validation and security
measures; Proper layout to avoid
unnecessarily crossing lines; Measurement
units shown in low contrast lettering, if used
at all. (The operators know the units of
measurement.)
Needs Improvement
Graphics are somewhere in between
the Green and Red “effective vs.
ineffective” attributes
Attributes of Ineffective
graphics
Bright; flashing graphics.
Brightly colors; 3D
animations with spinning
components; color coding;
bright text; No trends; An
exact representation of the
P&ID with minor connections
and manual valves; Lines
that cross.
Inconsistent process flow
direction; Alarm colors used
for non-alarm-related
functionality; Haphazard,
inconsistent navigation from
screen to screen;
Inconsistent color coding of
various elements and
overuse of color.
11534825
62. Templates
2-36
High-Level Flexibility Assessment Template 4 Maintenance
Maintenance Assessment
WT 3 2 1
1
Thermal fatigue
mitigation
strategy
2
Carefully monitors operating parameters to
mitigate thermal fatigue. Overheating occurs, the
station will perform an engineering review of the
systems and equipment materials affected
The existing thermal fatigue
mitigation strategy needs
improvement.
There is no thermal fatigue
mitigation strategy; Or,
minimal monitoring/actions
are taken to mitigate future
temperature excursions.
2
Inspection
strategy
2
Parameters and procedures are periodically
evaluated and adhered to for improved plant
operations and forward planning for replacement
of critical components; Frequency of inspections
is optimized and aligned with engineering
An inspection strategy exists but
needs improvement; Frequency
and quality of major component
inspections in not aligned with
engineering.
No Inspection Strategy exists;
Inspection parameters,
procedures and teams need
guidance and direction
3 Risk ranking 2 Risk ranking utilized to prioritize projects
Sometimes risk ranking is utilized;
Needs improvement
Not applicable
4
Superheater
and reheater
header program
2
Station monitors temperatures follow operating
procedures, and periodically inspects all
headers; Ensures that all thermocouples are
installed and in good working order.
The inspection and monitoring
program need improvement
Monitoring is not
representative, and the
inspection program is
inadequate and/or doesn’t
exist.
5
Feedwater
heaters
2
Inspection frequency adequate; Monitor bolt and
seal conditions. Replace bolts, as necessary.
FW heater inspection program
needs improvement
FW inspection program does
not exist and/or is inadequate
6
Shorter
maintenance
intervals
optimized
2
Routinely reviews existing staffing levels and
scheduling options; Investigates the feasibility of
augmenting the maintenance staff with contract
support as needed; Arrange contractor
relationships ahead of time. Closely monitors
inventory levels.
Previews staffing levels
periodically; Periodically
investigates contract and
contractor relationships. Inventory
is managed, but not closely
monitored
Short maintenance intervals
are not optimized
11534825
63. Templates
2-37
Maintenance Assessment
WT 3 2 1
7
Outage/overhaul
intervals
2
Wear patterns are monitored, and outages
adjusted to required intervals needed for flexible
operations. Overhaul intervals and economic
outages are optimized.
Outage/overhaul intervals are not
optimized for flexible operations;
Needs Improvement
Outage/Overhaul intervals are
not optimized
8
Large motor
integrity program
2
PM frequency is adjusted as needed; Station has
verified that all motors are rated for the expected
number of starts and the frequency.
Some PMs adjusted and/or
investigated; Program needs
improvement
Motor integrity is unknown.
9
Keeping the
Maintenance
Program Current
2
Preventive maintenance is reviewed for critical
components and considers new stressors related
to flexible operations.
Maintenance program has had
some changes, but not all
stressors related to flexible
operations have been assessed
Maintenance program PMs
have not been updated for
flexible operations
10
Pumps and
auxiliaries
2
A more proactive maintenance regime has been
evaluated with the anticipation of wear and tear
with flexible operations
Maintenance regime acknowledges
the risk, but has not implemented
actions
Maintenance regime for
pumps and auxiliaries has not
changed for flexible
operations
11
Staffing versus
automation
optimized
2
To ensure timely and efficient operations for
flexibility, additional staff needed have been
evaluated to cut in, align, and isolate systems;
Furthermore, the alternative option of automating
some equipment, such as valves, dampers, and
drain lines has been addressed.
Some staffing and automation
have been evaluated. But, needs
improvement
Staffing vs. Automation is not
optimized.
11534825
64. Templates
2-38
Maintenance Assessment
WT 3 2 1
12
PM frequency and
spare parts levels
2
Adjusted and optimized for flexible operations
demands; Site maintenance strategy moved from
time-based to condition-based maintenance to
address operating costs, viability to reduce the risk
of over-maintaining or under-maintaining the plant.
Identified PMs and spare parts
for adjustment, but not
optimized
Not Addressed
13
Corrective work
vs. planned
maintenance work
balance
2
Planning and scheduling activities adjusted to
complete maintenance activities in a shorter time
frame; Proper inventory is available
Planning and scheduling
activity adjustment needs
identified, but not optimal;
Needs improvement
Corrective work vs.
planned work is not
balanced
14
Resource Sharing
and Planning
2
Rescheduling of personnel and overtime optimized;
Planning and scheduling activities are closely
coordinated with operations; Equipment
maintenance changes/needs and operators' skills
deterioration is taken into consideration
Resource sharing and planning
is utilized but planning and
scheduling activities needs
improvement to ensure a
proper balance of skill sets.
Resource sharing and
planning is non-optimal
or not applicable
15
Protective circuits
managed
2 Optimized PM programs and frequencies
PM Programs and frequencies
need improvement
PM program and
frequencies have not
been addressed
16
Electrical
switchgear
maintenance
2
Schedules ensure that the number of cycles of
operation is included in setting the inspection
frequency and maintenance is optimized
Electrical switchgear
maintenance program needs
improvement for flex-ops
Issues exist and no
adjustments have been
made for flexible
operations
17 Refractory 2
Increase of refractory repairs needed with flexible
operations has been addressed; Upgraded to a
more durable refractory product
Refractory repairs are being
addressed; However,
mitigation and management
strategy is needed
Issues with refractory
exist; PMs and material
are non-optimal
11534825
65. Templates
2-39
Maintenance Assessment
WT 3 2 1
18
Undersized boiler
drains and vents
optimized for various
modes of operation
2
Survey/study of boiler drains and vents
for proper flows have been addressed
(ensure proper sizing, slope, etc.);
Silencers added as needed.
Boiler drains and vents have been
identified as an area that needs
improvement
Boiler drains and vents
have not been
addressed and/or are
not optimized
19
Increased wear on
high-pressure and cold
reheat piping with
flexible operations
2
The need to inspect seamed welds and
fitting welds more frequently due to the
potential for creep damage has been
evaluated and addressed; Also, the
need for additional drain pots and traps.
Inspection process exists, but has
not been adjusted for flexible
operations
Potential for increased
wear has not been
considered.
20
Keep the Generator
maintenance program
current
2
Critical components have been
reviewed and adjusted for new
stressors; PMs and maintenance
program modified
Critical components are inspected,
but maintenance program has not
been updated; Needs to be
addressed
Generation program has
not been updated or
addressed for flexible
operations
21 Insulation 2
Program to repair/replace/increase
insulation to help retain heat as needed
has been implemented; Thermography
used to survey during operation to help
identify problem areas.
General inspections are completed
but are not documented and/or
planned of outages.
Insulation program
needs to be
implemented for flexible
operations
22
Wear on valve
components:
2
Addressed the need for harder valve
materials (valve seats and disks), to
shorten maintenance intervals; Also, the
type of valve actuator/operator to best
manage flexible operations has been
considered.
Valve materials and types have
been addressed but not formally
managed; Needs improvement
Valves wear and
management is an issue
11534825
66. Templates
2-40
Maintenance Assessment
WT 3 2 1
23 Valve leak-through 2
Monitored for proper operation; PM
frequency addressed and increased as
needed to address
PM frequency has been adjusted
to address but is not adequately
monitored
Valve leak through is an issue
that needs to be addressed
24
FD fan worn
components
2
Performs more frequent internal
inspections of fan casings to address worn
or corroded components; PMs updated
Inspections completed and issues
addressed but not PMs not
updated for flexible operations
FD fan Issues exist
25
Particulate control
systems (electrostatic
precipitator/baghouse)
2
Gas duct PMs adjusted to clean more
frequently to prevent excessive ash
buildup; Additional blowers added in
stagnant areas to stir up ash buildup
(where needed); Baghouse maintenance
and monitoring addressed. Bag materials
evaluated and/or upgraded as needed.
Impacts of flexible operations have
been assessed and are
understood, but program needs
improvement
Issues exist and are non-
optimal
26
Spare parts usage
pattern with flexible
operations
2
Update the maintenance basis, taking into
flexible operations stressors, PM
frequencies and spare parts. Cyclic
operation will increase the failure of
components (e.g., gaskets, switches,
actuators, motors, valves, door seals, valve
packing, thermocouples, control system
cards, valve limit switches)
Spare part usage pattern changes
have been identified, but inventory
is not optimized
Issues exist with managing
spare parts under flexible
operations
27
Operation of the
turning gear will
increase
2
Spare turning-gears and/or required parts
on hand to rebuild a unit, if needed; PMs
have been updated to address drive motor
cleaning and inspections.
Turning gear operations and/or
rebuilds are planned and PMs
adjusted, but all spare parts are not
on hand to rebuild if needed.
No spare parts on hand and
PMs have not been updated
for flexible operations
11534825
67. Templates
2-41
Maintenance Assessment
WT 3 2 1
28 Increased Starts 2
Increased starts (and rated capacity) of
large motors, BFP, and ID and FD fans
have been assessed; Frequency of the
inspection intervals and PMs have been
adjusted; Spare motors, or repair
components added to inventory as needed.
Motors have been assessed, but
PMs, inspection intervals and
spare parts inventory needs
improvement
Not addressed for flexible
operations
29
Safety and relief
valves
2
Inventory of spare safety and relief valves
on hand has been assessed and managed
accordingly
Safety and relief valve issues have
been addressed but need
improvement
Not addressed for flexible
operations
30
Maintenance and
operations
coordination
2
Operations and Maintenance personnel
aligned with actions and responsibilities
through training and interaction regarding
challenges with cyclic operations
31
Establish a formal
reliability, availability
and maintainability
(RAM) program
2
Does predictive maintenance accounting
for cycling damage to minimize cycling
related forced outage
Some accounting and predictive
maintenance is completed; Needs
improvement and expansion
No formal reliability,
availability and maintainability
program exists
32
Works with major
equipment
owners/engineers to
install thermocouples
on strategic locations
2
Examples: SH, RH tube metal
thermocouples; Drains to monitor
condensate accumulation
This needs improvement. Not all
components are protected
Not addressed or prioritized
11534825
70. Templates
2-44
High-Level Flexibility Assessment Template 5 Combustion and Boiler Performance
Combustion and Boiler Performance Assessment
WT 3 2 1
1
Measured Furnace Exit O2
at full load
(Low, High, Average); Basis for standard is typical bituminous
coal; Lower O2
operations may be feasible with varying fuel
types and system optimization.
2 >3% and/or <3.5%
Low-end >2% and/or
high end ˂4%
Low-end <2% and/or
high end >4%
2 Measured Boiler Outlet O2
actual (Low, High, Average); 2 >3% and/or <3.5%
Low-end >2% and/or
high end ˂4%
Low-end <2% and/or
high end >4%
3 Indicated Boiler Outlet Excess O2
(Low, High, Average) 2 On Curve
Within 10% of
operating curve set-
point
>10% from curve set-
point (across the
curve)
4
Deviation between actual boiler exit and actual furnace exit
values
2 0 - .5% >.5% - <1% >1%
5
Deviation between actual vs. indicated boiler exit values (also
stratification from side-to-side)
2 0 - .5% >.5% - <1% >1%
6 Clean Airflow Imbalance (Average) 1 ±2% ±5% ˃5%
7 Dirty Airflow Imbalance (Average) 1 ±5% ±8% ˃8%
8 Fuel Flow Imbalance (Average) 1 ±10% ˂15% ˃15%
9
Coal Fineness, % through 200m; Use Weighted Average values;
For flexible operations, “capacity vs. fineness” must be evaluated
to address ramp rate demand vs. storage capacity; depending
on fuel type this standard may need to be adjusted based on
capacity and performance variables.
2 ≥75% thru 200m >70% thru 200m <70% thru 200m
10
Mechanical mill blueprint established for achieving optimal mill
performance across the load range?
2 Yes Partial No
11
Fuel loading curves established for the mills. Operators clearly
understand optimal mill configurations; account primary airflow,
minimum coal feeder % and A/F ratio management
1 Yes Partial No
11534825
71. Templates
2-45
Combustion and Boiler Performance Assessment
WT 3 2 1
12
Coal Fineness Average, % through 50m
Use Weighted average values (all mills)
2 +99.5% thru 50m >99% thru 50m <99% thru 50m
13 Primary Air-Fuel Ratio: Optimized for mill type, piping size, etc. 2 Optimized Needs Improvement
Non-Optimal; Low
Velocities and/or
Burner Fires
14
Combustion air to the burners measured, managed and validated
to ensure optimal distribution and windbox pressures across the
load range.
Validated flow
measurement and
across the load range
Need improvement Non- Optimal
15
Mill outlet temperature control is contingent on having enough hot
air supplied by the air heater
2
No issues meeting
mill outlet
Temperature
Demands
Needs improvement
Cannot meet mill
outlet temperature
demands
16
Mechanical Burner Condition (including all combustion airflow
damper and/or tilt controls.
2
No blanked burners;
+/- ¼ - 1/2” tolerances
at burner front
No blanked burners;
+/- 1” tolerances at
burner front
Blanked burners
and/or tolerances
greater than 1”
17
Burner ignition optimized for optimal start-ups; Alternative fuels/
igniters may need to be considered
2
No Issues
Fast response and no
malfunctions
Needs improvement
Frequent
malfunctions
18
Flame Stability under Flexible Operations;
Integration of upgraded scanners and/or advanced sensors may
be required for decreasing flame intensity
2 Good Needs Improvement Poor
11534825
72. Templates
2-46
Combustion and Boiler Performance Assessment
WT 3 2 1
19
Heat Input Management: Achieving stability typically requires
reproducibility of heat input and demands coal quality
management in the coal yard w/ blending and proper coal
quality management required for flame stability when operating
at low loads
2 Good Needs Improvement Poor
20 Furnace Exit Gas Temperature (FEGT) & O2, CO 2
Match design value with
uniform temperatures
within 25°F ideally less
than 2,150°F
No point less than
2% oxygen; Temp.
balanced within 50-
75°F proximity of
design FEGT
Any point <2%
oxygen; Temp.
stratifications +75-
100°F of design FEGT
21 Steam Temperatures Optimized 2
No issues maintaining
steam temperatures
across the load range
Needs Improvement
Poor control of steam
temperature
22 Average SH Spray Flow Rates 2
Achieve Design Basis
(or <3 % of FW flow
rate on average)
>3% >4%
23 Average RH Spray Flow Rates (% of FW flow) 2 0 >1% >2%
24 APH Efficiency 2 ≥65% ≥60% ˂60%
25
APH X Ratio (This is ratio of heat capacity of air passing thru
the APH to heat capacity of flue gas passing through it; Lower
than design X-ratio leads to a higher than design gas outlet
temperature and is an indicator of excessive tempering air to
the mills and/or boiler setting air infiltration.
2 ˃0.9 <0.8 ˂0.7
11534825
73. Templates
2-47
Combustion and Boiler Performance Assessment
WT 3 2 1
26
Average APH Leakage; Too much leakage
can cool the cold end below the dewpoint and
induce corrosion and/or plugging issues
2 ˂10% ˂15% ˃15%
27
Air Heater Cold End Temperature Control
(ACET)l is contingent on adequate hot gas to
combat dew point plugging and/or corrosion.
2
ACET is always under
control and managed
properly with steam coil or
economizer bypass system
ACET needs
improvement
ACET is not controlled
28
Average Air and Gas APH Outlet
Temperatures (Corrected)
2
˂15 Deg. F (-9.4C)
from design
˃15 Deg. F (-9.4C)
from design
˃25 Deg. F (-3.9C) from
design
29 Soot blower Availability-IK (long retracts) 1 ˃85% ˃80% ˂80%
30 Soot blower Availability-IR (wall blowers) 1 ˃85% ˃80% ˂80%
31 Average Boiler Efficiency (depends on fuel) 1 Meets Boiler Design 1-1.5% below design >2% below design
32 Losses due to Unburned Carbon in Ash 2
˂3% bituminous coal (low -
medium ash)
<0.7% high volatile sub-
bituminous coal
˂5% bituminous coal (low
- medium ash)
<1.2% high volatile sub-
bituminous coal
˃5% bituminous coal
(low - medium ash) >1.2
% high volatile sub-
bituminous coal
33 Boiler Exit/SCR NOX 1
Meeting Design SCR Inlet
Temp. and NOX
removal
target
Below SCR Inlet
temperature and/or NOx
removal target required
for compliance
Below SCR Inlet
temperature with
Compounding issues
(e.g., NH3
slip, ABS
plugging, etc.)
34 Boiler Exit CO (PPM) 2 ˂100PPM ˂250PPM ˃250PPM
35
Average Fly ash Particle Sizing through 200
mesh
1 >90% <90% <85%
IK = Insertable Kinetic IR = Insertable Rotating
11534825
74. Templates
2-48
Combustion and Boiler Performance Assessment
WT 3 2 1
36 Coal treatment System 1 Optimized for fuel Periodically Tuned Not Optimized
37
FD Fan Dampers, % at Full Load
(summer months with highest ambient
temperature)
1 ˂75% ˃75% ˃85%
38
ID Fan Dampers, % at Full Load
(summer months with highest ambient
temperature)
1 ˂75% ˃75% ˃85%
39
Total System Air In-leakage (Furnace to ID
discharge)
2 ˂12% ˂15% ˃15%
40
Top Size of Raw Coal (Gauging
screen/crusher performance)
2 ˂1" ˂2" ˃2"
41
Site collects representative Coal Samples for
Analysis (coal sampler and/or representative
samples)
2 Yes (online sampler) Daily Grab Sample Not Daily
42 Ash Deposition and Corrosion Issues 3 No issues
Some issues but can be
managed
Site specific issues exist
that lead to reliability
concerns
11534825
77. Templates
2-51
High-Level Flexibility Assessment Template 6 Instrumentation, Controls
and Automation
Instrumentation and controls have a crucial role with enabling flexible operations. Furthermore,
the availability and optimization of operating performance regarding both flexibility and
efficiency, is contingent upon quality data assessments and implementation of advanced process
controls that cross over much of the generation sector.
This assessment (integrated with the other assessments) is intended to evaluate current status
and/or needs for improvement of instrumentation, controls and automation. The outcome of this
assessment will classify the Instrumentation, Controls and Automation as follows:
3 2 1
Advanced/Good Flexibility
• Fully automated start-up and
shutdown
• Advanced controls
• Advanced protection systems
• Diagnostics
• Energy management functions
• Integrated condition
monitoring
• Artificial Intelligence
• Digital Interconnection to
Internet of Things (IoT)
• Predictive maintenance
Flexibility Needs
Improvement
• Essentials to operate the
plant under flexible
conditions
• Monitoring of critical
components
• Critical Protection
Systems in place
Poor Flexibility
• Antiquated controls
need to be upgraded
• Software and/or
hardware issues exist
• Control loops are not
optimized
11534825
78. Templates
2-52
Instrumentation, Automation and Controls Assessment
WT 3 2 1
1
Controls system Capable of meet desired operating modes and load
control?
Controlling unit load to an electrical power output (MW) setpoint during load
changes is influenced by fuel control, transport and things such as grinding,
combustion, flame stability, heat absorption and boiler metal temperatures on a
PC fired unit
2 Yes Partial No
2 Pneumatic or antiquated control hardware installed? 2 No Partial Yes
3
Microprocessor-based distributed control system on the boilers master,
fuel, air and feedwater loops
2 Yes Partial No
4
Optimal Steam Temperature Control: To prevent damage to boiler and
turbine components and maintain turbine plant efficiency, steam temperature
controls must operate effectively under steady-state and dynamic process
conditions. At low loads, steam temperature control can become challenging
with variation of heat in the boiler. Thus, to maintain temperature control and
turbine efficiency, steam temperature controls must operate effectively under
both steady state and dynamic process conditions. This may require
improvements that implement cascade controls with model-based SH and RH
temperature control, Linearization through adaption of control parameters
and/or feedforward model designs to improve disturbance rejection (e.g., soot-
blowing) and changes in firing combinations.
2 Yes Partial No
5
Spray water control optimized for flexible operations (including start-up,
minimum load and/or ramp rates)
2 Yes Partial No
6
Feedwater control optimized for flexible operations (including start-up,
minimum load and/or ramp rates)
2 Yes Partial No
7
Enthalpy control optimized for flexible operations (including start-up,
minimum load and/or ramp rates)
2 Yes Partial No
11534825
79. Templates
2-53
Instrumentation, Automation and Controls Assessment
WT 3 2 1
8 Drum level control optimized for flexible operations (including start-up,
minimum load and/or ramp rates)
At low loads, drum level control in subcritical recirculation boilers can
deteriorate due to various reasons, including:
- Changeover of steam supply to the turbine driven feedwater pump
- Changes in water circulation (nature circulation boilers) due to fluctuation
in furnace wall heat absorption that result from variations in gas flows in
the furnace and mill combinations and loads.
- Change in process response at low steam flows and with changes in
steam pressure (e.g., sliding pressure operation)
- Change in feedwater temperature
- Reduced accuracy of differential pressure sensors that measure feedwater
flow and steam flow that result from square root nonlinearities at low flows.
- Relatively large fuel flow changes when starting and stopping mills at lower
loads because of smaller number of mills in service.
2 Yes Partial No
9
Primary air pressure Control optimal for the load range
- Hot primary air (PA) duct pressure influences in-service mill airflow controls
and the position of the hot air control dampers. Mill airflow controls can
affect boiler airflow and unit load control. Setpoint modifications can be
beneficial when ramping performance around minimum (or reduced
minimum) load.
2 Yes Partial No
10
Air- Fuel (and furnace pressure) control must be optimal for the load
range
- Burner flame stability at low loads demands proper mill configuration to
avoid too high or low of feed rates that can result in a negative impact.
Furthermore, fuel surging can also have a negative impact on boiler
pressure control. Developing a process control strategy around taking mills
in/out of service through operator management or automation is
necessary.
Yes Partial No
11534825
80. Templates
2-54
Instrumentation, Automation and Controls Assessment
WT 3 2 1
11
O2
, air controls optimized for flexible operations (including start-up, minimum load and/or
ramp rates)
2 Yes Partial No
12
Circulation control optimized for flexible operations (including start-up, minimum load
and/or ramp rates)
2 Yes Partial No
13 Start-up automation: Firing Rate; HP Bypass; Start-up fuel control; flow control valves 2 Yes Partial No
14
Advanced unit controls evaluated (e.g., feed-forward model-based approaches proven to
improve dynamic behavior; simulation utilization for minimization of online optimization time and
requirements)
2 Yes Partial No
15
Review of unit instrumentation and critical KPIs across Operating Range: conducted to
ensure that coverage of operating ranges is adequate to remain reliable and accurate
throughout the new operating range.
2 Yes Partial No
16
Control system tuning: Determine the expected operating modes and ranges. Tune them for
stable, reliable operation across the ranges. For increased I&E calibrations, additional PMs
should be expected. Consider additional instrumentation and duel ranges.
2 Yes Partial No
17
Modulating control loop tuning for the load range
- Control systems for utility generating units typically contain 50-100 modulating control loops,
each with tunable feedback-controller parameters and in some cases, tunable feedforward
and gain-scheduling functions. Tunable parameters are typically optimized for mid-high loads
consistent with the design range for normal unit operation and in many cases tuning settings
may not be complete for low loads or appropriate across the load range.
2 Yes Partial No
18
Start-up Automation: Sliding pressure offers advantages over throttle control (constant
pressure) during startup by establishing a flow to the turbine earlier. It also retains higher
temperatures on shutdown; Automate as much as possible, develop startup procedures, track
times taken for each step during each startup, and update procedures with best practices.
2 Yes Partial No
19
Accurate temperature protection systems for thick-walled components are key for start-
up and shut down
2 Yes Partial No
11534825