Epps project revised
•Download as DOCX, PDF•
1 like•156 views
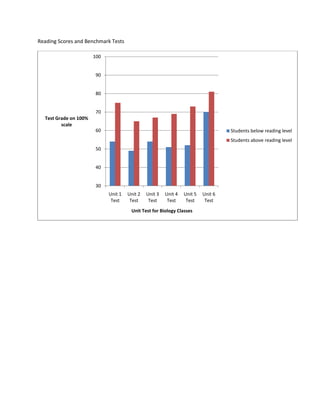
This document contains graphs and charts about reading test scores and biology class performance. It shows the distribution of reading levels among biology students, with most students reading below a 10th grade level. Test scores decreased for students with more absences. The final graph compares class average test scores to averages for students with 3 or more absences, showing lower scores for students with more missed classes.
Report
Share
Report
Share

Recommended
POLS 2306 (Fall 2012)
This document provides information about an introductory Texas politics course being taught at UT Tyler in fall 2012. It outlines the instructor's contact information, required course materials, course structure including 5 units and exams, grading policies, academic dishonesty policies, and important dates for the semester. Students will learn about Texas government and be expected to identify key officials and understand the budget and judicial processes by the end of the course.
POLS 2305 (Fall 2012)
This document provides information about an introductory American government course at UT Tyler, including contact information for the instructor, required course materials, grading policies, academic integrity policies, and important dates. The course will be conducted in 5 units, with one exam covering each unit's material. Students' grades will be based on reading quizzes, exercises, and exam scores. Late or make-up work will not be accepted.
Data Overview- HPatton
Finch Elementary is a Title I school located in Atlanta, GA serving 483 students in grades K-5. 98% of students are African American and qualify for free or reduced lunch. The document analyzes reading assessment data from 2010-2011 and 2011-2012 to identify areas for improvement and increasing reading proficiency. Scores on state CRCT exams and internal diagnostic tests show a need to develop new strategies to strengthen reading instruction at Finch Elementary.
How to pass csir net in lifesciences
This document provides advice for taking the CSIR UGC NET exam. It recommends attempting the maximum number of questions possible without being afraid of negative marking. Candidates do not need to pass each part individually. The document also provides estimated cutoff percentages for different categories and advises focusing on common topics that have repeated questions in previous exams. Students are told to solve previous year papers and subscribe to a YouTube channel for more exam preparation videos.
Logic: Language and Information 1
My Verified Certificate for Logic: Language and Information 1 by The University of Melbourne and offered through Coursera.
Extra credit 2011 2012
This document outlines two extra credit opportunities for Ms. Donohue's class: Classroom Supply Extra Credit and Novel Extra Credit. For Classroom Supply Extra Credit, students can receive points for donating classroom supplies like copy paper, dry erase markers, or latex gloves, with a maximum of 25 points. For Novel Extra Credit, students can receive 20 points for donating their copy of one of the specified class novels.
Physics Syllabus
Michelle Hurst is the science teacher for the upcoming year. She has over 10 years of teaching experience and degrees in interdisciplinary sciences. The physics class will involve hands-on labs where students work in groups, but must also complete individual projects. The goal is to help students develop skills like problem solving and teamwork for college and careers. Attached are the course overview, guidelines, and rules which students and parents should review.
Grammar book
This document summarizes several Spanish grammar topics in 3 paragraphs or less:
1) It discusses reflexive verbs and how they reflect an action back on the subject (e.g. ducharse is to shower oneself). It also covers tu commands and using the yo form with an -s for negatives.
2) Common expressions using gustar and other similar verbs are explained (e.g. me gusta means I like). Imperfect verbs and their uses for ongoing or repeated actions are also summarized.
3) The differences between que and cual are outlined. Forms of the verb ser for I/you/he/we are listed. Direct and indirect objects are defined along with their placement
Epps project revised
This document contains graphs and charts about reading test scores and biology class performance. It shows test scores over six units decreasing for most students. It also shows over 500 biology students reading below a 10th grade level in 2011. Additional charts break down reading levels and compare test scores to class attendance, finding lower scores for students missing more classes.
Orakom
The document describes the basic operations in a CPU datapath:
1) Fetching data from memory
2) Storing data to memory
3) Exchanging data between registers
4) Performing arithmetic and logical operations in the datapath
It explains how instruction execution involves the exchange of data between registers, the bus, and memory to perform load, store, move, and arithmetic operations. The key components of the datapath that enable this are registers, an ALU, and buses to connect them.
Animasi pada-presentasi (1) call uhamka
The document discusses the advantages and disadvantages of computer-assisted language learning (CAL). It outlines several key advantages of CAL, including that it can increase student interest and motivation, individualize learning, accommodate different learning styles, and provide immediate feedback. However, the document also notes some disadvantages, such as CAL programs being less portable than traditional books and requiring computer access. It also points out potential increased costs and the need for teachers and students to have basic technology skills. The document concludes by emphasizing the importance of understanding both the strengths and weaknesses of CAL.
Grammar book
This document provides information on several Spanish grammar topics in 3 paragraphs or less:
1) It discusses question words like qué and cuál, forms of the verb ser for expressing "to be", and the verb gustar for expressing likes.
2) It covers the imperfect tense, common triggers used with that tense, and the construction "acabar de" for expressing recent actions.
3) The final paragraph discusses reflexive verbs, tu commands, double object pronouns, and their placement.
BÀI TẬP BỔ TRỢ TIẾNG ANH LỚP 9 CẢ NĂM - GLOBAL SUCCESS - NĂM HỌC 2024-2025 - ...
BÀI TẬP BỔ TRỢ TIẾNG ANH LỚP 9 CẢ NĂM - GLOBAL SUCCESS - NĂM HỌC 2024-2025 - ...Nguyen Thanh Tu Collection
https://app.box.com/s/tacvl9ekroe9hqupdnjruiypvm9rdaneBÀI TẬP BỔ TRỢ TIẾNG ANH 8 CẢ NĂM - GLOBAL SUCCESS - NĂM HỌC 2023-2024 (CÓ FI...
BÀI TẬP BỔ TRỢ TIẾNG ANH 8 CẢ NĂM - GLOBAL SUCCESS - NĂM HỌC 2023-2024 (CÓ FI...Nguyen Thanh Tu Collection
https://app.box.com/s/y977uz6bpd3af4qsebv7r9b7s21935vdPCOS corelations and management through Ayurveda.
This presentation includes basic of PCOS their pathology and treatment and also Ayurveda correlation of PCOS and Ayurvedic line of treatment mentioned in classics.
Chapter wise All Notes of First year Basic Civil Engineering.pptx
Chapter wise All Notes of First year Basic Civil Engineering
Syllabus
Chapter-1
Introduction to objective, scope and outcome the subject
Chapter 2
Introduction: Scope and Specialization of Civil Engineering, Role of civil Engineer in Society, Impact of infrastructural development on economy of country.
Chapter 3
Surveying: Object Principles & Types of Surveying; Site Plans, Plans & Maps; Scales & Unit of different Measurements.
Linear Measurements: Instruments used. Linear Measurement by Tape, Ranging out Survey Lines and overcoming Obstructions; Measurements on sloping ground; Tape corrections, conventional symbols. Angular Measurements: Instruments used; Introduction to Compass Surveying, Bearings and Longitude & Latitude of a Line, Introduction to total station.
Levelling: Instrument used Object of levelling, Methods of levelling in brief, and Contour maps.
Chapter 4
Buildings: Selection of site for Buildings, Layout of Building Plan, Types of buildings, Plinth area, carpet area, floor space index, Introduction to building byelaws, concept of sun light & ventilation. Components of Buildings & their functions, Basic concept of R.C.C., Introduction to types of foundation
Chapter 5
Transportation: Introduction to Transportation Engineering; Traffic and Road Safety: Types and Characteristics of Various Modes of Transportation; Various Road Traffic Signs, Causes of Accidents and Road Safety Measures.
Chapter 6
Environmental Engineering: Environmental Pollution, Environmental Acts and Regulations, Functional Concepts of Ecology, Basics of Species, Biodiversity, Ecosystem, Hydrological Cycle; Chemical Cycles: Carbon, Nitrogen & Phosphorus; Energy Flow in Ecosystems.
Water Pollution: Water Quality standards, Introduction to Treatment & Disposal of Waste Water. Reuse and Saving of Water, Rain Water Harvesting. Solid Waste Management: Classification of Solid Waste, Collection, Transportation and Disposal of Solid. Recycling of Solid Waste: Energy Recovery, Sanitary Landfill, On-Site Sanitation. Air & Noise Pollution: Primary and Secondary air pollutants, Harmful effects of Air Pollution, Control of Air Pollution. . Noise Pollution Harmful Effects of noise pollution, control of noise pollution, Global warming & Climate Change, Ozone depletion, Greenhouse effect
Text Books:
1. Palancharmy, Basic Civil Engineering, McGraw Hill publishers.
2. Satheesh Gopi, Basic Civil Engineering, Pearson Publishers.
3. Ketki Rangwala Dalal, Essentials of Civil Engineering, Charotar Publishing House.
4. BCP, Surveying volume 1
Chapter 4 - Islamic Financial Institutions in Malaysia.pptx
Chapter 4 - Islamic Financial Institutions in Malaysia.pptxMohd Adib Abd Muin, Senior Lecturer at Universiti Utara Malaysia
This slide is special for master students (MIBS & MIFB) in UUM. Also useful for readers who are interested in the topic of contemporary Islamic banking.
What is Digital Literacy? A guest blog from Andy McLaughlin, University of Ab...
What is Digital Literacy? A guest blog from Andy McLaughlin, University of Aberdeen
How to Add Chatter in the odoo 17 ERP Module
In Odoo, the chatter is like a chat tool that helps you work together on records. You can leave notes and track things, making it easier to talk with your team and partners. Inside chatter, all communication history, activity, and changes will be displayed.
Wound healing PPT
This document provides an overview of wound healing, its functions, stages, mechanisms, factors affecting it, and complications.
A wound is a break in the integrity of the skin or tissues, which may be associated with disruption of the structure and function.
Healing is the body’s response to injury in an attempt to restore normal structure and functions.
Healing can occur in two ways: Regeneration and Repair
There are 4 phases of wound healing: hemostasis, inflammation, proliferation, and remodeling. This document also describes the mechanism of wound healing. Factors that affect healing include infection, uncontrolled diabetes, poor nutrition, age, anemia, the presence of foreign bodies, etc.
Complications of wound healing like infection, hyperpigmentation of scar, contractures, and keloid formation.
How to deliver Powerpoint Presentations.pptx
"How to make and deliver dynamic presentations by making it more interactive to captivate your audience attention"
More Related Content
Viewers also liked
Epps project revised
This document contains graphs and charts about reading test scores and biology class performance. It shows test scores over six units decreasing for most students. It also shows over 500 biology students reading below a 10th grade level in 2011. Additional charts break down reading levels and compare test scores to class attendance, finding lower scores for students missing more classes.
Orakom
The document describes the basic operations in a CPU datapath:
1) Fetching data from memory
2) Storing data to memory
3) Exchanging data between registers
4) Performing arithmetic and logical operations in the datapath
It explains how instruction execution involves the exchange of data between registers, the bus, and memory to perform load, store, move, and arithmetic operations. The key components of the datapath that enable this are registers, an ALU, and buses to connect them.
Animasi pada-presentasi (1) call uhamka
The document discusses the advantages and disadvantages of computer-assisted language learning (CAL). It outlines several key advantages of CAL, including that it can increase student interest and motivation, individualize learning, accommodate different learning styles, and provide immediate feedback. However, the document also notes some disadvantages, such as CAL programs being less portable than traditional books and requiring computer access. It also points out potential increased costs and the need for teachers and students to have basic technology skills. The document concludes by emphasizing the importance of understanding both the strengths and weaknesses of CAL.
Grammar book
This document provides information on several Spanish grammar topics in 3 paragraphs or less:
1) It discusses question words like qué and cuál, forms of the verb ser for expressing "to be", and the verb gustar for expressing likes.
2) It covers the imperfect tense, common triggers used with that tense, and the construction "acabar de" for expressing recent actions.
3) The final paragraph discusses reflexive verbs, tu commands, double object pronouns, and their placement.
Viewers also liked (7)
Recently uploaded
BÀI TẬP BỔ TRỢ TIẾNG ANH LỚP 9 CẢ NĂM - GLOBAL SUCCESS - NĂM HỌC 2024-2025 - ...
BÀI TẬP BỔ TRỢ TIẾNG ANH LỚP 9 CẢ NĂM - GLOBAL SUCCESS - NĂM HỌC 2024-2025 - ...Nguyen Thanh Tu Collection
https://app.box.com/s/tacvl9ekroe9hqupdnjruiypvm9rdaneBÀI TẬP BỔ TRỢ TIẾNG ANH 8 CẢ NĂM - GLOBAL SUCCESS - NĂM HỌC 2023-2024 (CÓ FI...
BÀI TẬP BỔ TRỢ TIẾNG ANH 8 CẢ NĂM - GLOBAL SUCCESS - NĂM HỌC 2023-2024 (CÓ FI...Nguyen Thanh Tu Collection
https://app.box.com/s/y977uz6bpd3af4qsebv7r9b7s21935vdPCOS corelations and management through Ayurveda.
This presentation includes basic of PCOS their pathology and treatment and also Ayurveda correlation of PCOS and Ayurvedic line of treatment mentioned in classics.
Chapter wise All Notes of First year Basic Civil Engineering.pptx
Chapter wise All Notes of First year Basic Civil Engineering
Syllabus
Chapter-1
Introduction to objective, scope and outcome the subject
Chapter 2
Introduction: Scope and Specialization of Civil Engineering, Role of civil Engineer in Society, Impact of infrastructural development on economy of country.
Chapter 3
Surveying: Object Principles & Types of Surveying; Site Plans, Plans & Maps; Scales & Unit of different Measurements.
Linear Measurements: Instruments used. Linear Measurement by Tape, Ranging out Survey Lines and overcoming Obstructions; Measurements on sloping ground; Tape corrections, conventional symbols. Angular Measurements: Instruments used; Introduction to Compass Surveying, Bearings and Longitude & Latitude of a Line, Introduction to total station.
Levelling: Instrument used Object of levelling, Methods of levelling in brief, and Contour maps.
Chapter 4
Buildings: Selection of site for Buildings, Layout of Building Plan, Types of buildings, Plinth area, carpet area, floor space index, Introduction to building byelaws, concept of sun light & ventilation. Components of Buildings & their functions, Basic concept of R.C.C., Introduction to types of foundation
Chapter 5
Transportation: Introduction to Transportation Engineering; Traffic and Road Safety: Types and Characteristics of Various Modes of Transportation; Various Road Traffic Signs, Causes of Accidents and Road Safety Measures.
Chapter 6
Environmental Engineering: Environmental Pollution, Environmental Acts and Regulations, Functional Concepts of Ecology, Basics of Species, Biodiversity, Ecosystem, Hydrological Cycle; Chemical Cycles: Carbon, Nitrogen & Phosphorus; Energy Flow in Ecosystems.
Water Pollution: Water Quality standards, Introduction to Treatment & Disposal of Waste Water. Reuse and Saving of Water, Rain Water Harvesting. Solid Waste Management: Classification of Solid Waste, Collection, Transportation and Disposal of Solid. Recycling of Solid Waste: Energy Recovery, Sanitary Landfill, On-Site Sanitation. Air & Noise Pollution: Primary and Secondary air pollutants, Harmful effects of Air Pollution, Control of Air Pollution. . Noise Pollution Harmful Effects of noise pollution, control of noise pollution, Global warming & Climate Change, Ozone depletion, Greenhouse effect
Text Books:
1. Palancharmy, Basic Civil Engineering, McGraw Hill publishers.
2. Satheesh Gopi, Basic Civil Engineering, Pearson Publishers.
3. Ketki Rangwala Dalal, Essentials of Civil Engineering, Charotar Publishing House.
4. BCP, Surveying volume 1
Chapter 4 - Islamic Financial Institutions in Malaysia.pptx
Chapter 4 - Islamic Financial Institutions in Malaysia.pptxMohd Adib Abd Muin, Senior Lecturer at Universiti Utara Malaysia
This slide is special for master students (MIBS & MIFB) in UUM. Also useful for readers who are interested in the topic of contemporary Islamic banking.
What is Digital Literacy? A guest blog from Andy McLaughlin, University of Ab...
What is Digital Literacy? A guest blog from Andy McLaughlin, University of Aberdeen
How to Add Chatter in the odoo 17 ERP Module
In Odoo, the chatter is like a chat tool that helps you work together on records. You can leave notes and track things, making it easier to talk with your team and partners. Inside chatter, all communication history, activity, and changes will be displayed.
Wound healing PPT
This document provides an overview of wound healing, its functions, stages, mechanisms, factors affecting it, and complications.
A wound is a break in the integrity of the skin or tissues, which may be associated with disruption of the structure and function.
Healing is the body’s response to injury in an attempt to restore normal structure and functions.
Healing can occur in two ways: Regeneration and Repair
There are 4 phases of wound healing: hemostasis, inflammation, proliferation, and remodeling. This document also describes the mechanism of wound healing. Factors that affect healing include infection, uncontrolled diabetes, poor nutrition, age, anemia, the presence of foreign bodies, etc.
Complications of wound healing like infection, hyperpigmentation of scar, contractures, and keloid formation.
How to deliver Powerpoint Presentations.pptx
"How to make and deliver dynamic presentations by making it more interactive to captivate your audience attention"
The Diamonds of 2023-2024 in the IGRA collection
A review of the growth of the Israel Genealogy Research Association Database Collection for the last 12 months. Our collection is now passed the 3 million mark and still growing. See which archives have contributed the most. See the different types of records we have, and which years have had records added. You can also see what we have for the future.
ISO/IEC 27001, ISO/IEC 42001, and GDPR: Best Practices for Implementation and...
Denis is a dynamic and results-driven Chief Information Officer (CIO) with a distinguished career spanning information systems analysis and technical project management. With a proven track record of spearheading the design and delivery of cutting-edge Information Management solutions, he has consistently elevated business operations, streamlined reporting functions, and maximized process efficiency.
Certified as an ISO/IEC 27001: Information Security Management Systems (ISMS) Lead Implementer, Data Protection Officer, and Cyber Risks Analyst, Denis brings a heightened focus on data security, privacy, and cyber resilience to every endeavor.
His expertise extends across a diverse spectrum of reporting, database, and web development applications, underpinned by an exceptional grasp of data storage and virtualization technologies. His proficiency in application testing, database administration, and data cleansing ensures seamless execution of complex projects.
What sets Denis apart is his comprehensive understanding of Business and Systems Analysis technologies, honed through involvement in all phases of the Software Development Lifecycle (SDLC). From meticulous requirements gathering to precise analysis, innovative design, rigorous development, thorough testing, and successful implementation, he has consistently delivered exceptional results.
Throughout his career, he has taken on multifaceted roles, from leading technical project management teams to owning solutions that drive operational excellence. His conscientious and proactive approach is unwavering, whether he is working independently or collaboratively within a team. His ability to connect with colleagues on a personal level underscores his commitment to fostering a harmonious and productive workplace environment.
Date: May 29, 2024
Tags: Information Security, ISO/IEC 27001, ISO/IEC 42001, Artificial Intelligence, GDPR
-------------------------------------------------------------------------------
Find out more about ISO training and certification services
Training: ISO/IEC 27001 Information Security Management System - EN | PECB
ISO/IEC 42001 Artificial Intelligence Management System - EN | PECB
General Data Protection Regulation (GDPR) - Training Courses - EN | PECB
Webinars: https://pecb.com/webinars
Article: https://pecb.com/article
-------------------------------------------------------------------------------
For more information about PECB:
Website: https://pecb.com/
LinkedIn: https://www.linkedin.com/company/pecb/
Facebook: https://www.facebook.com/PECBInternational/
Slideshare: http://www.slideshare.net/PECBCERTIFICATION
How to Setup Warehouse & Location in Odoo 17 Inventory
In this slide, we'll explore how to set up warehouses and locations in Odoo 17 Inventory. This will help us manage our stock effectively, track inventory levels, and streamline warehouse operations.
Walmart Business+ and Spark Good for Nonprofits.pdf
"Learn about all the ways Walmart supports nonprofit organizations.
You will hear from Liz Willett, the Head of Nonprofits, and hear about what Walmart is doing to help nonprofits, including Walmart Business and Spark Good. Walmart Business+ is a new offer for nonprofits that offers discounts and also streamlines nonprofits order and expense tracking, saving time and money.
The webinar may also give some examples on how nonprofits can best leverage Walmart Business+.
The event will cover the following::
Walmart Business + (https://business.walmart.com/plus) is a new shopping experience for nonprofits, schools, and local business customers that connects an exclusive online shopping experience to stores. Benefits include free delivery and shipping, a 'Spend Analytics” feature, special discounts, deals and tax-exempt shopping.
Special TechSoup offer for a free 180 days membership, and up to $150 in discounts on eligible orders.
Spark Good (walmart.com/sparkgood) is a charitable platform that enables nonprofits to receive donations directly from customers and associates.
Answers about how you can do more with Walmart!"
Recently uploaded (20)
BÀI TẬP BỔ TRỢ TIẾNG ANH LỚP 9 CẢ NĂM - GLOBAL SUCCESS - NĂM HỌC 2024-2025 - ...
BÀI TẬP BỔ TRỢ TIẾNG ANH LỚP 9 CẢ NĂM - GLOBAL SUCCESS - NĂM HỌC 2024-2025 - ...
BÀI TẬP BỔ TRỢ TIẾNG ANH 8 CẢ NĂM - GLOBAL SUCCESS - NĂM HỌC 2023-2024 (CÓ FI...
BÀI TẬP BỔ TRỢ TIẾNG ANH 8 CẢ NĂM - GLOBAL SUCCESS - NĂM HỌC 2023-2024 (CÓ FI...
Film vocab for eal 3 students: Australia the movie
Film vocab for eal 3 students: Australia the movie
Chapter wise All Notes of First year Basic Civil Engineering.pptx
Chapter wise All Notes of First year Basic Civil Engineering.pptx
Chapter 4 - Islamic Financial Institutions in Malaysia.pptx
Chapter 4 - Islamic Financial Institutions in Malaysia.pptx
What is Digital Literacy? A guest blog from Andy McLaughlin, University of Ab...
What is Digital Literacy? A guest blog from Andy McLaughlin, University of Ab...
NEWSPAPERS - QUESTION 1 - REVISION POWERPOINT.pptx
NEWSPAPERS - QUESTION 1 - REVISION POWERPOINT.pptx
ISO/IEC 27001, ISO/IEC 42001, and GDPR: Best Practices for Implementation and...
ISO/IEC 27001, ISO/IEC 42001, and GDPR: Best Practices for Implementation and...
How to Setup Warehouse & Location in Odoo 17 Inventory
How to Setup Warehouse & Location in Odoo 17 Inventory
Walmart Business+ and Spark Good for Nonprofits.pdf
Walmart Business+ and Spark Good for Nonprofits.pdf
Epps project revised
- 1. Reading Scores and Benchmark Tests 100 90 80 70 Test Grade on 100% scale 60 Students below reading level Students above reading level 50 40 30 Unit 1 Unit 2 Unit 3 Unit 4 Unit 5 Unit 6 Test Test Test Test Test Test Unit Test for Biology Classes
- 2. Biology Students Ranked According to Reading Level Distribution of Reading Levels for Biology Students in 2011 Fall Classes 163 78 Students Below 10th Grade Reading Level Students Above 10th Grade 506 Reading Level Students Not Tested
- 3. All Biology Students Students Above a 9th Grade Reading Level Students Below a 9th Grade Reading Level Number of Students not Tested
- 4. Attendance Related to Test Scores 100 90 80 70 percent score for 60 test Class Average 50 Average for Students with 3 or 40 More Days Absent 30 20 Unit 1 Unit 2 Unit 3 Unit 4 Test Test Test test Unit Test for First Two Quarters in Biology