Download to read offline

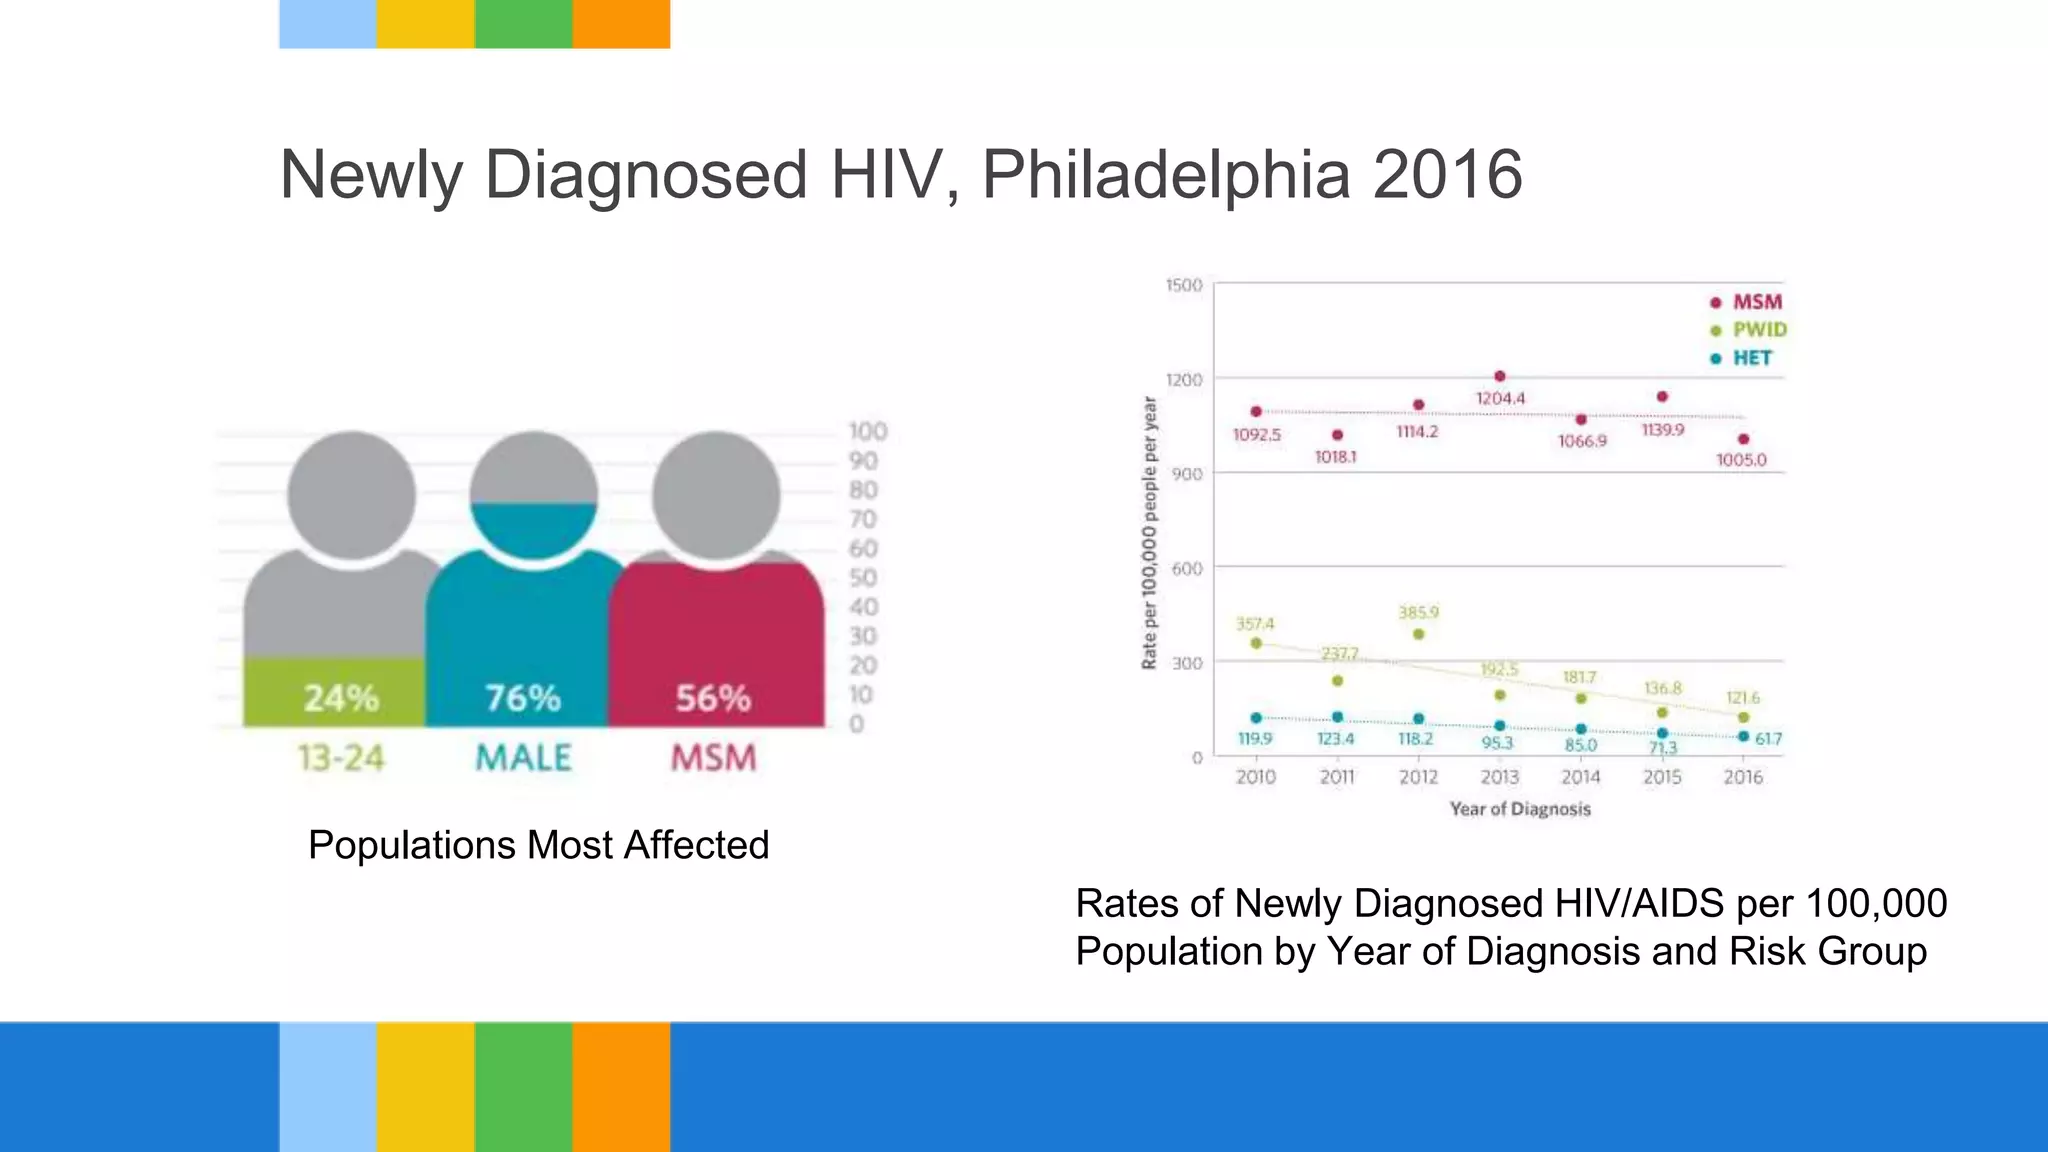

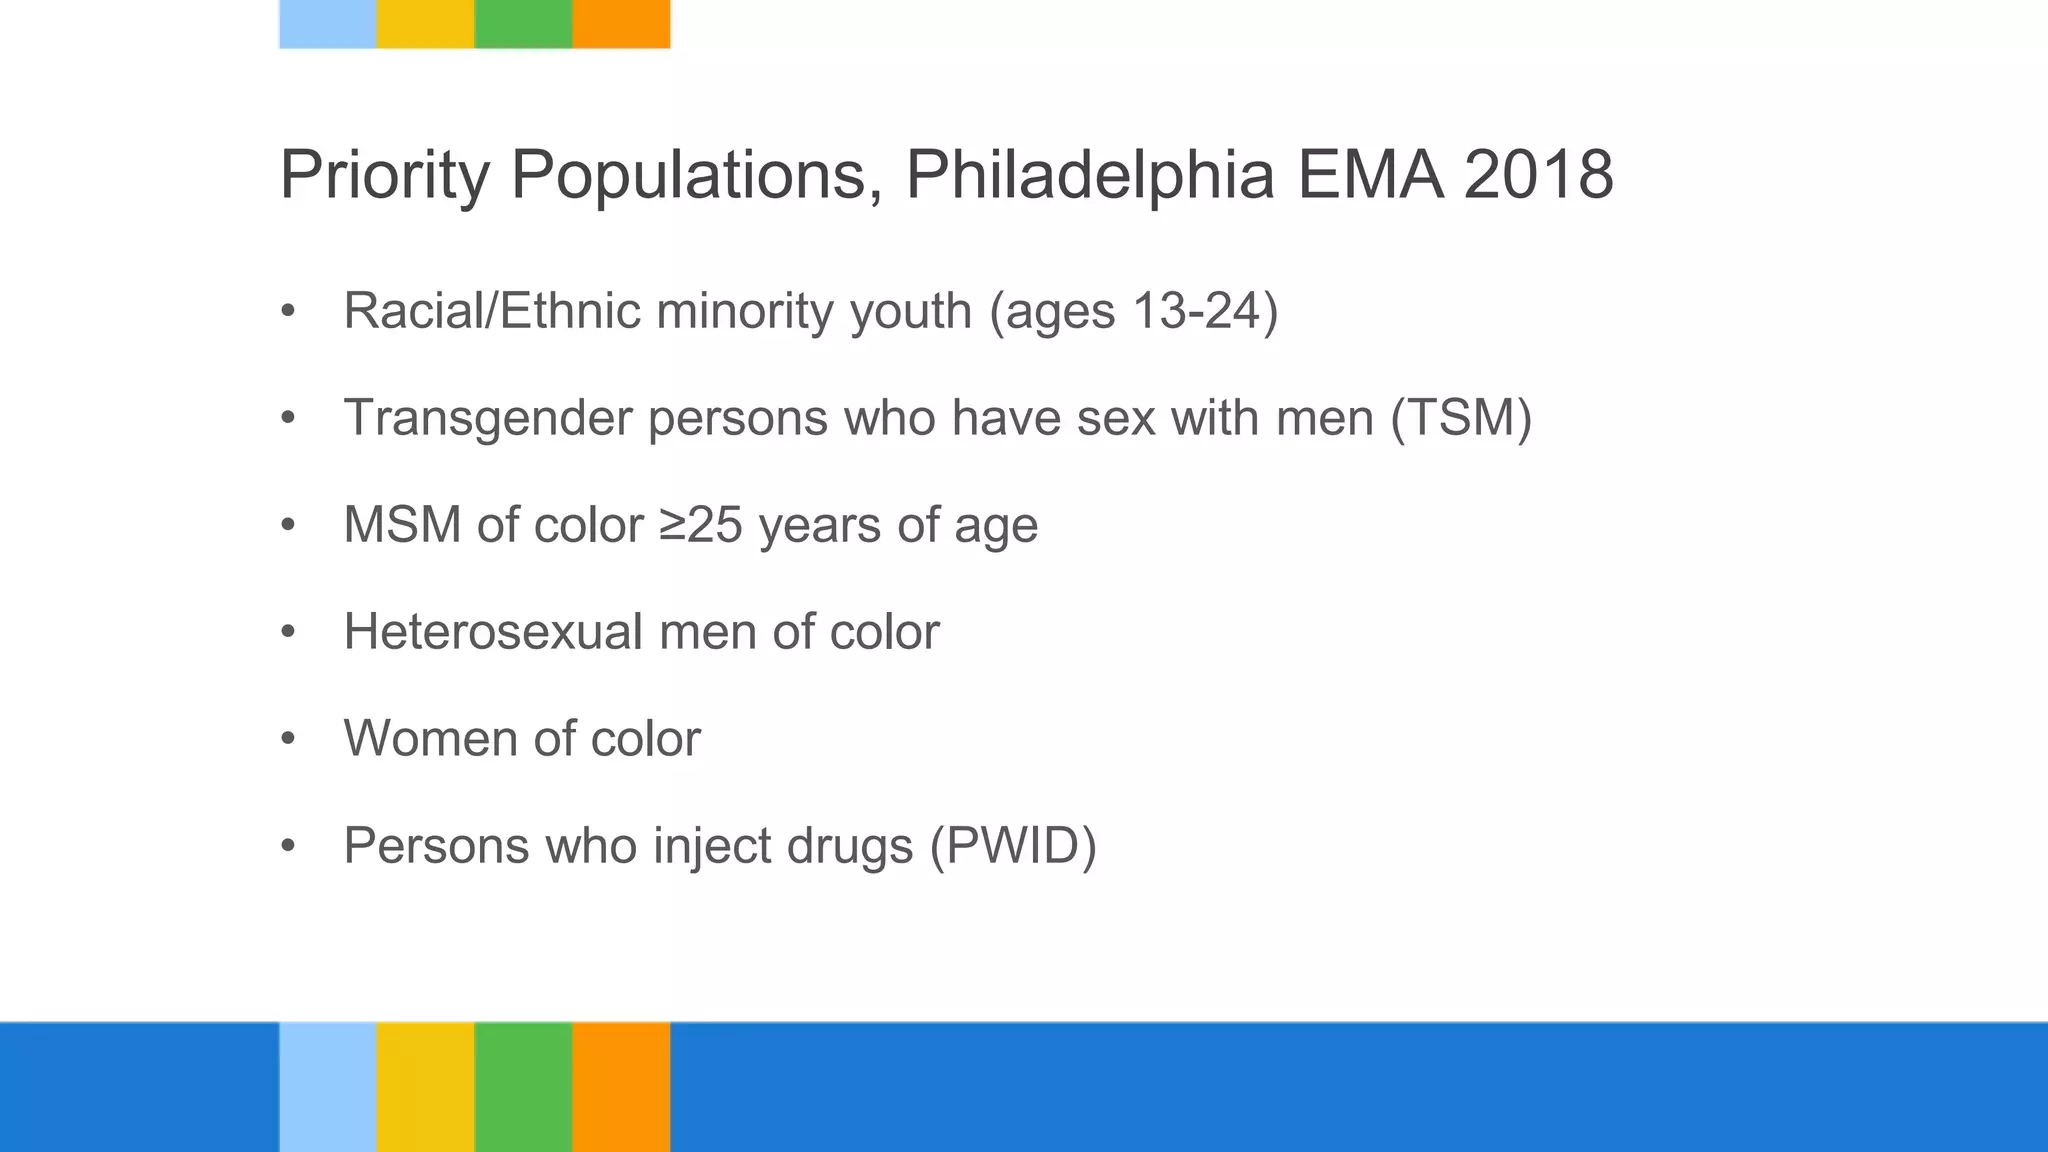
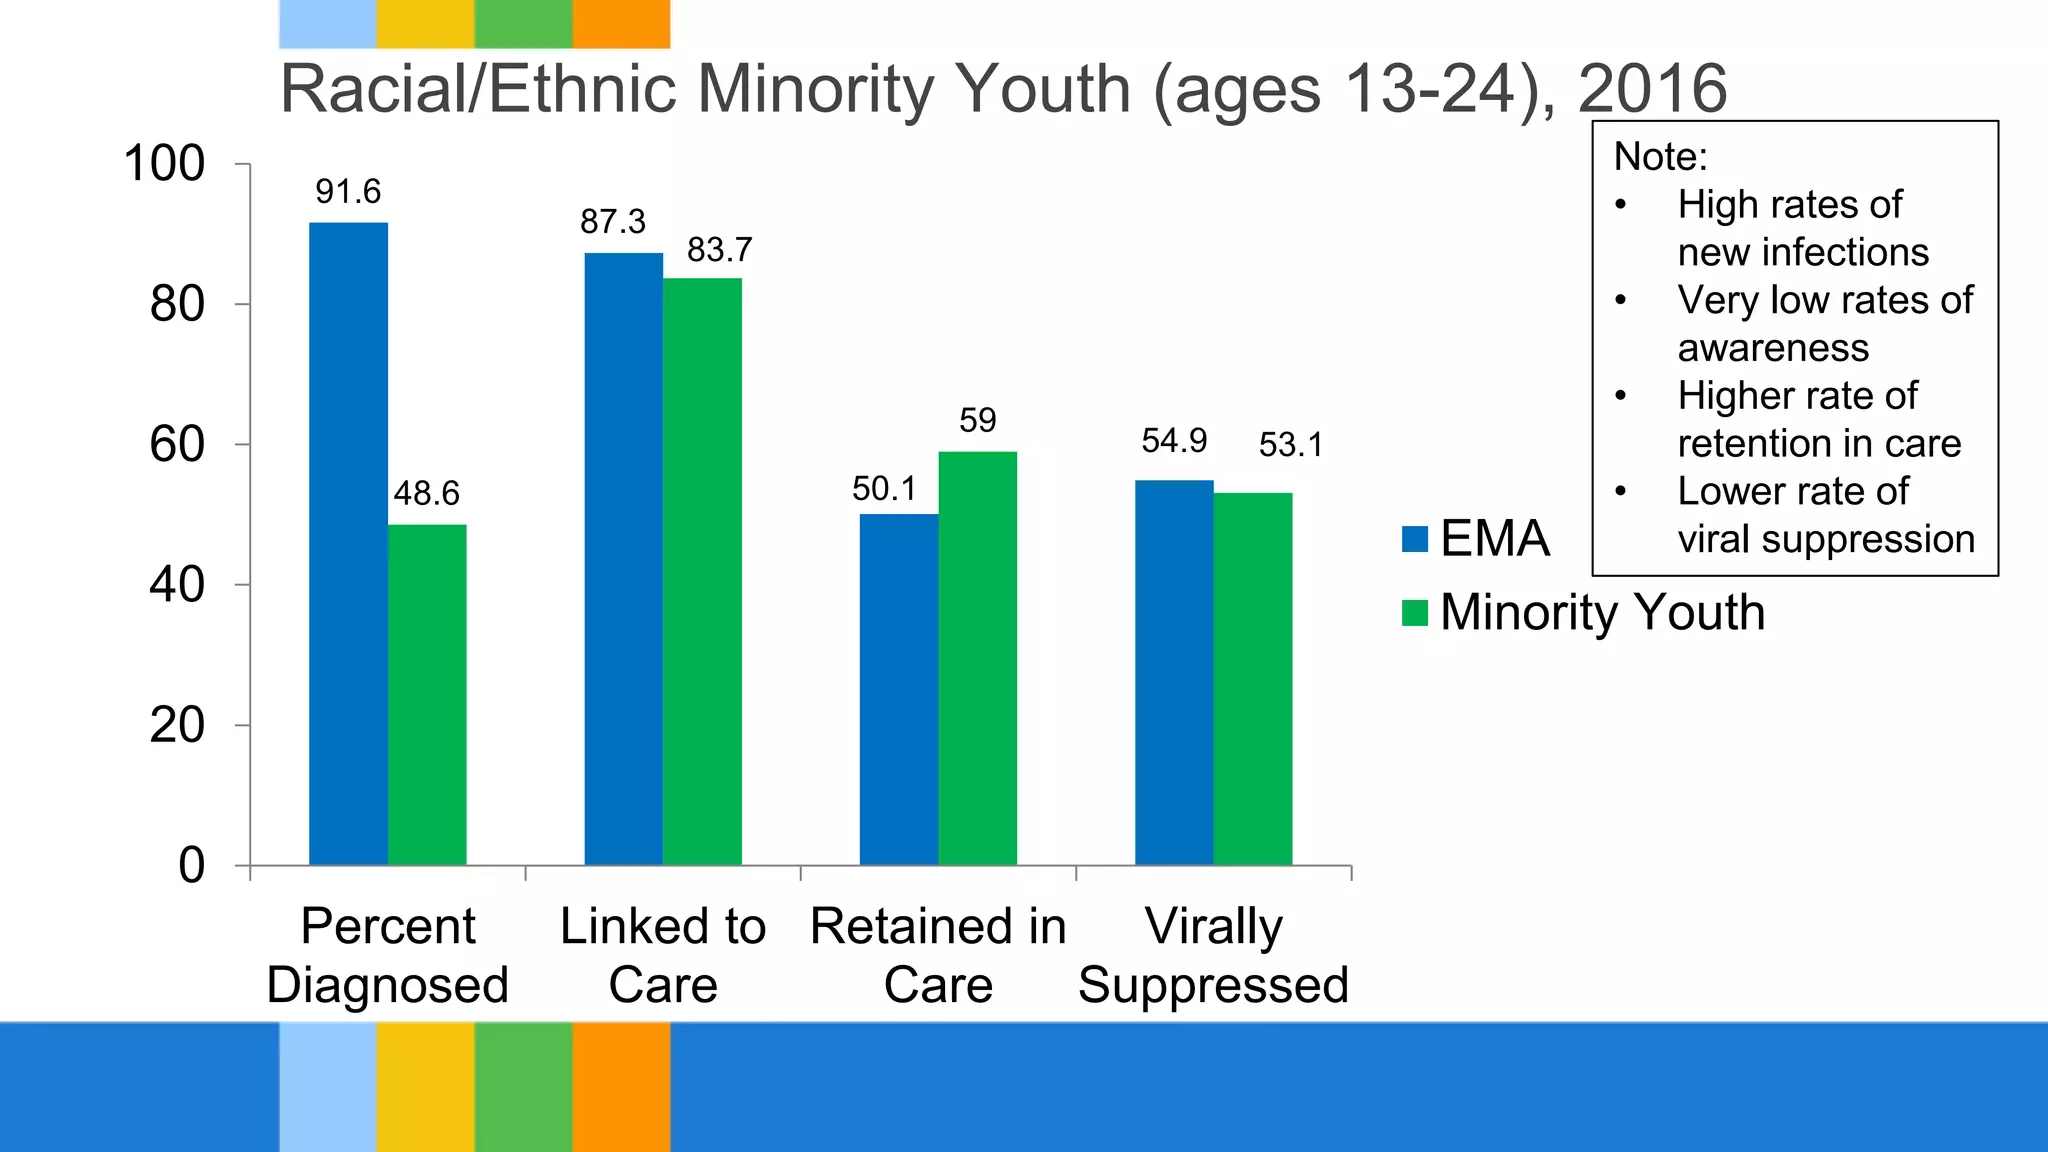
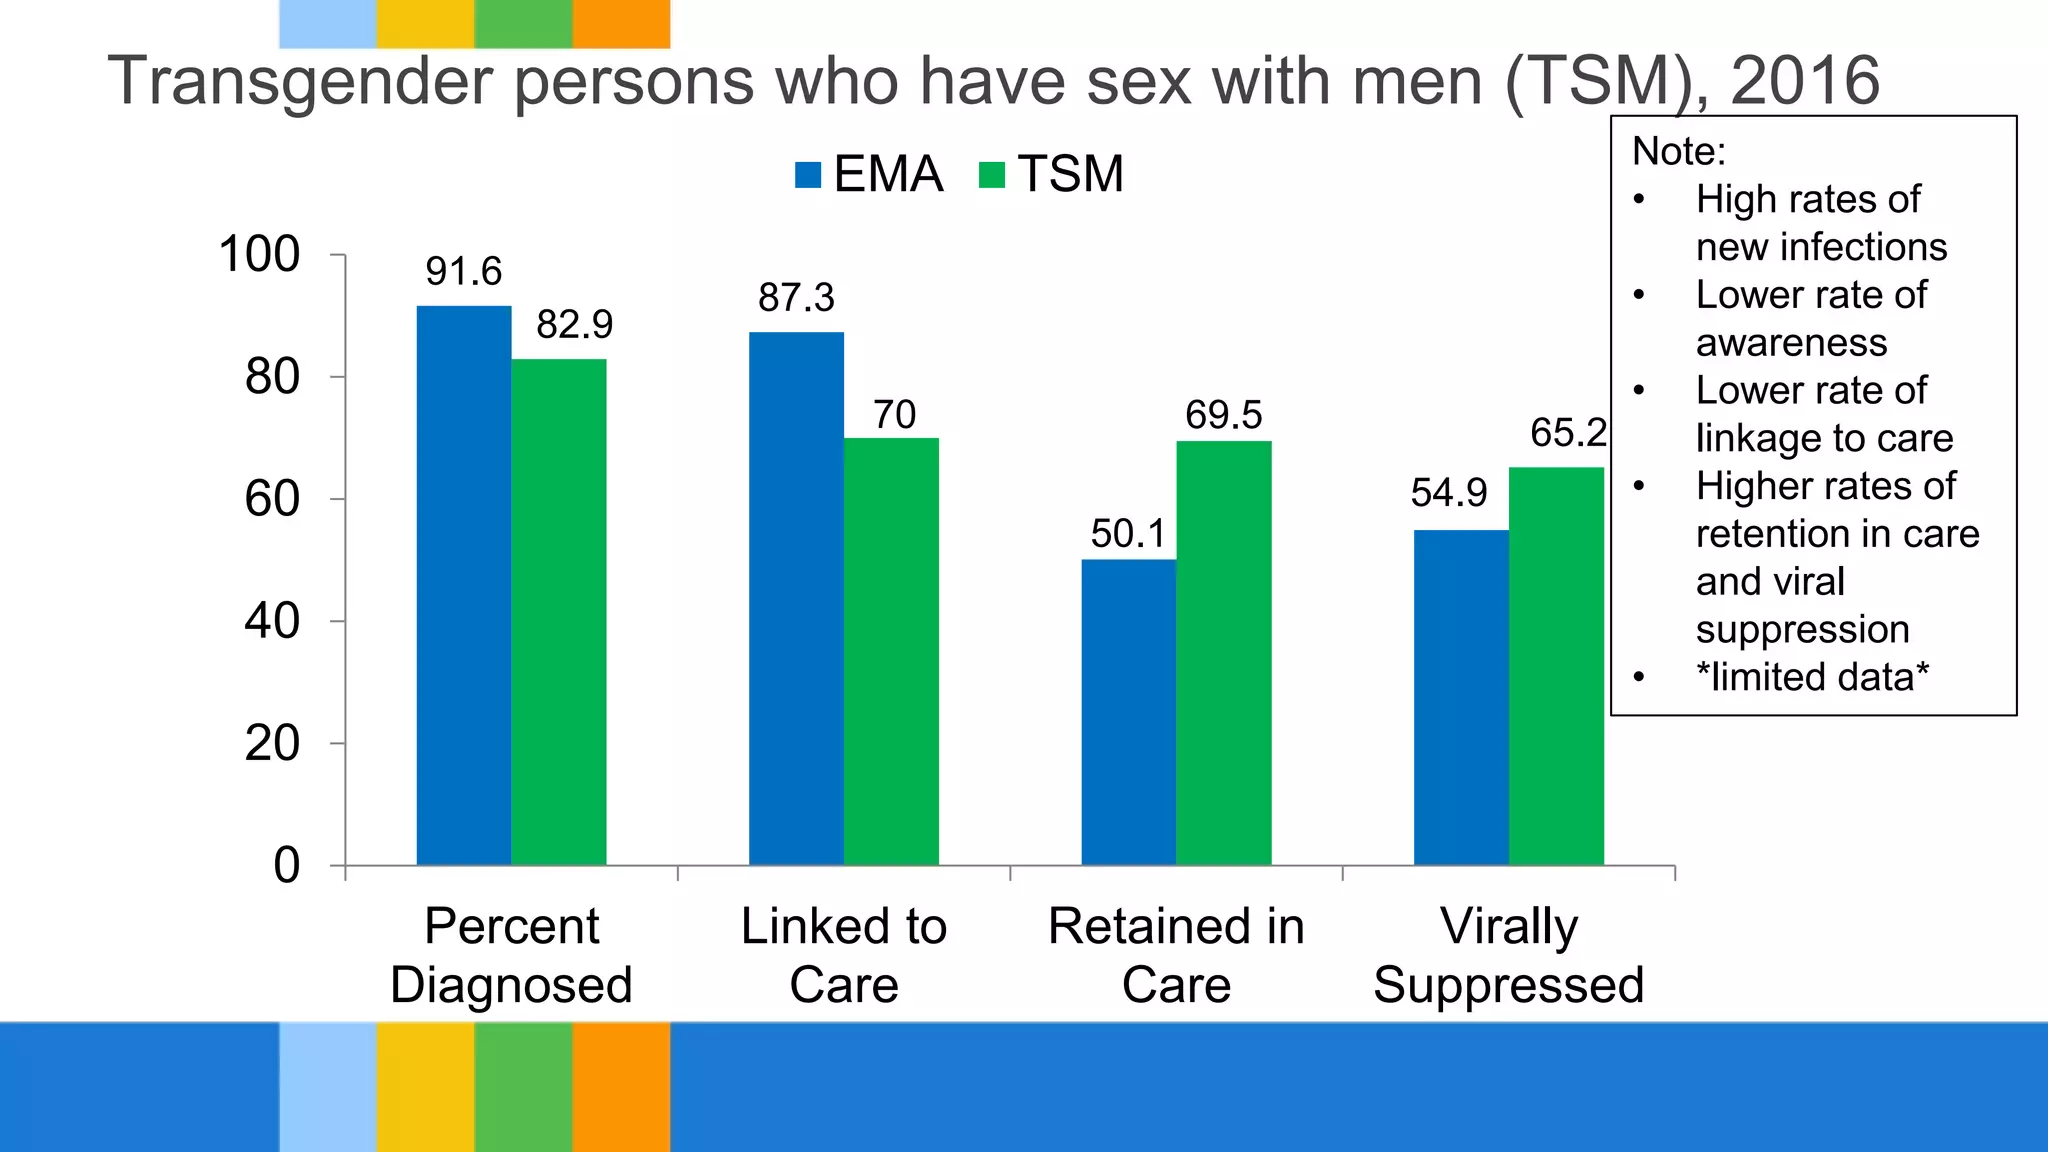
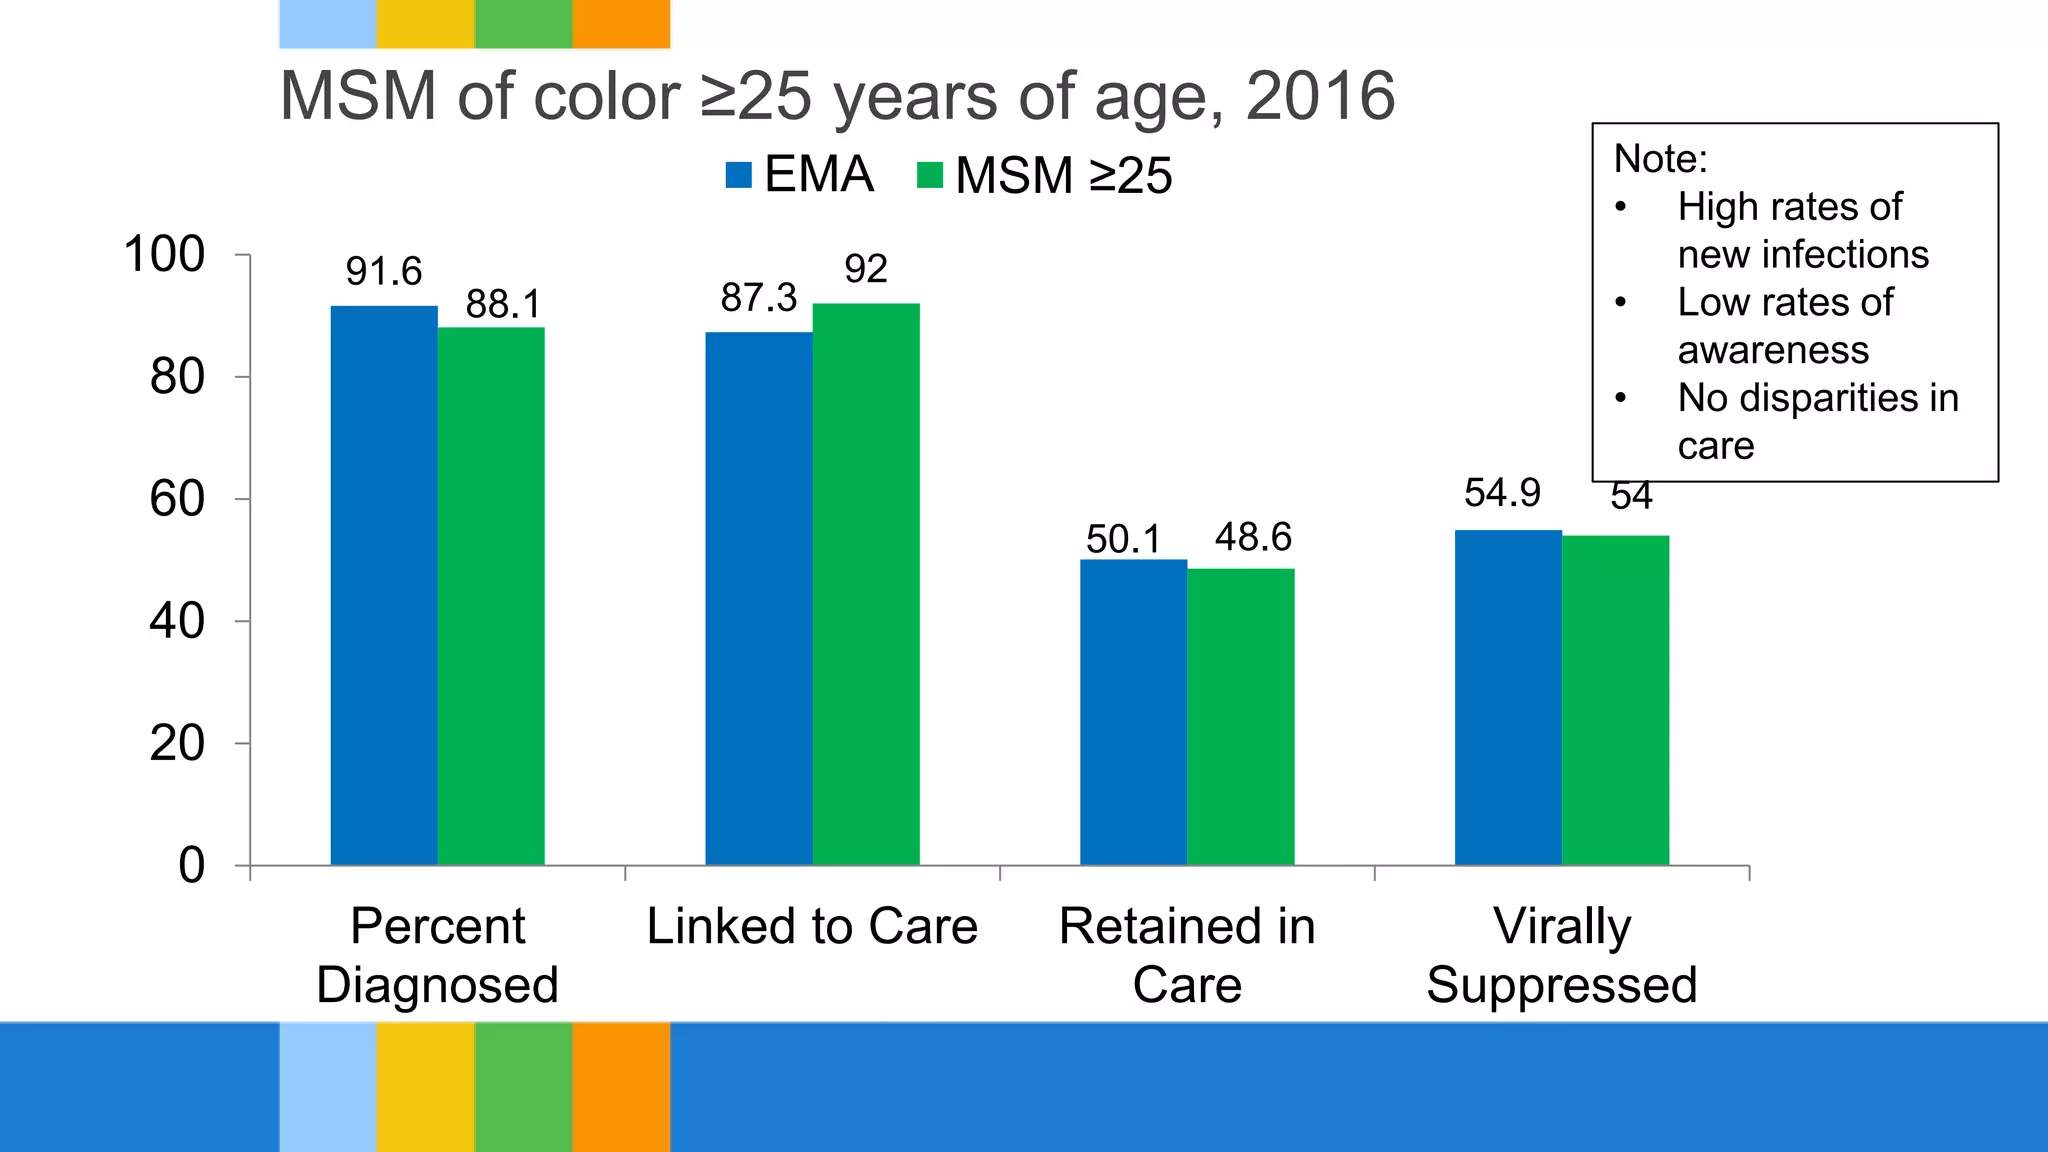

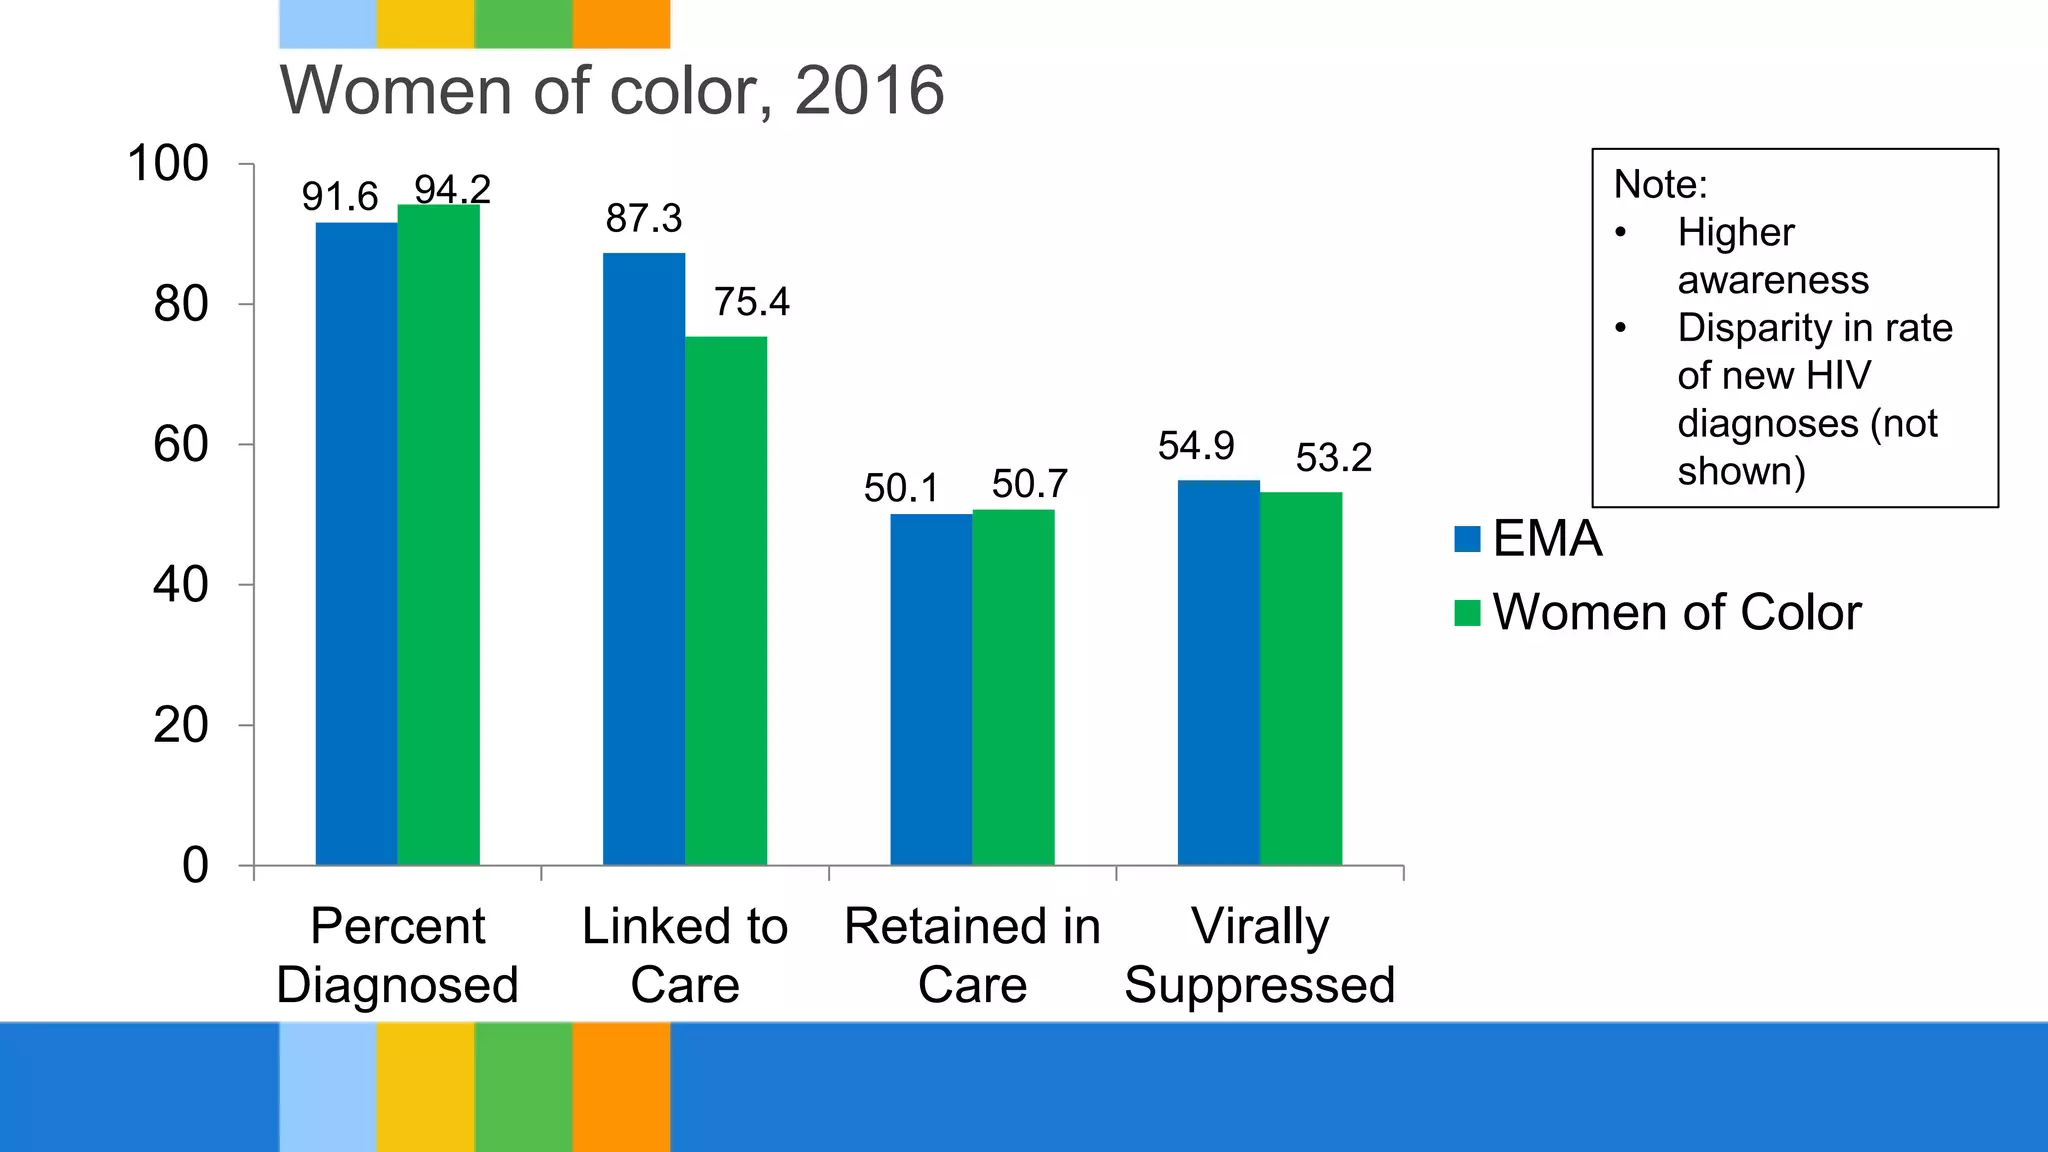
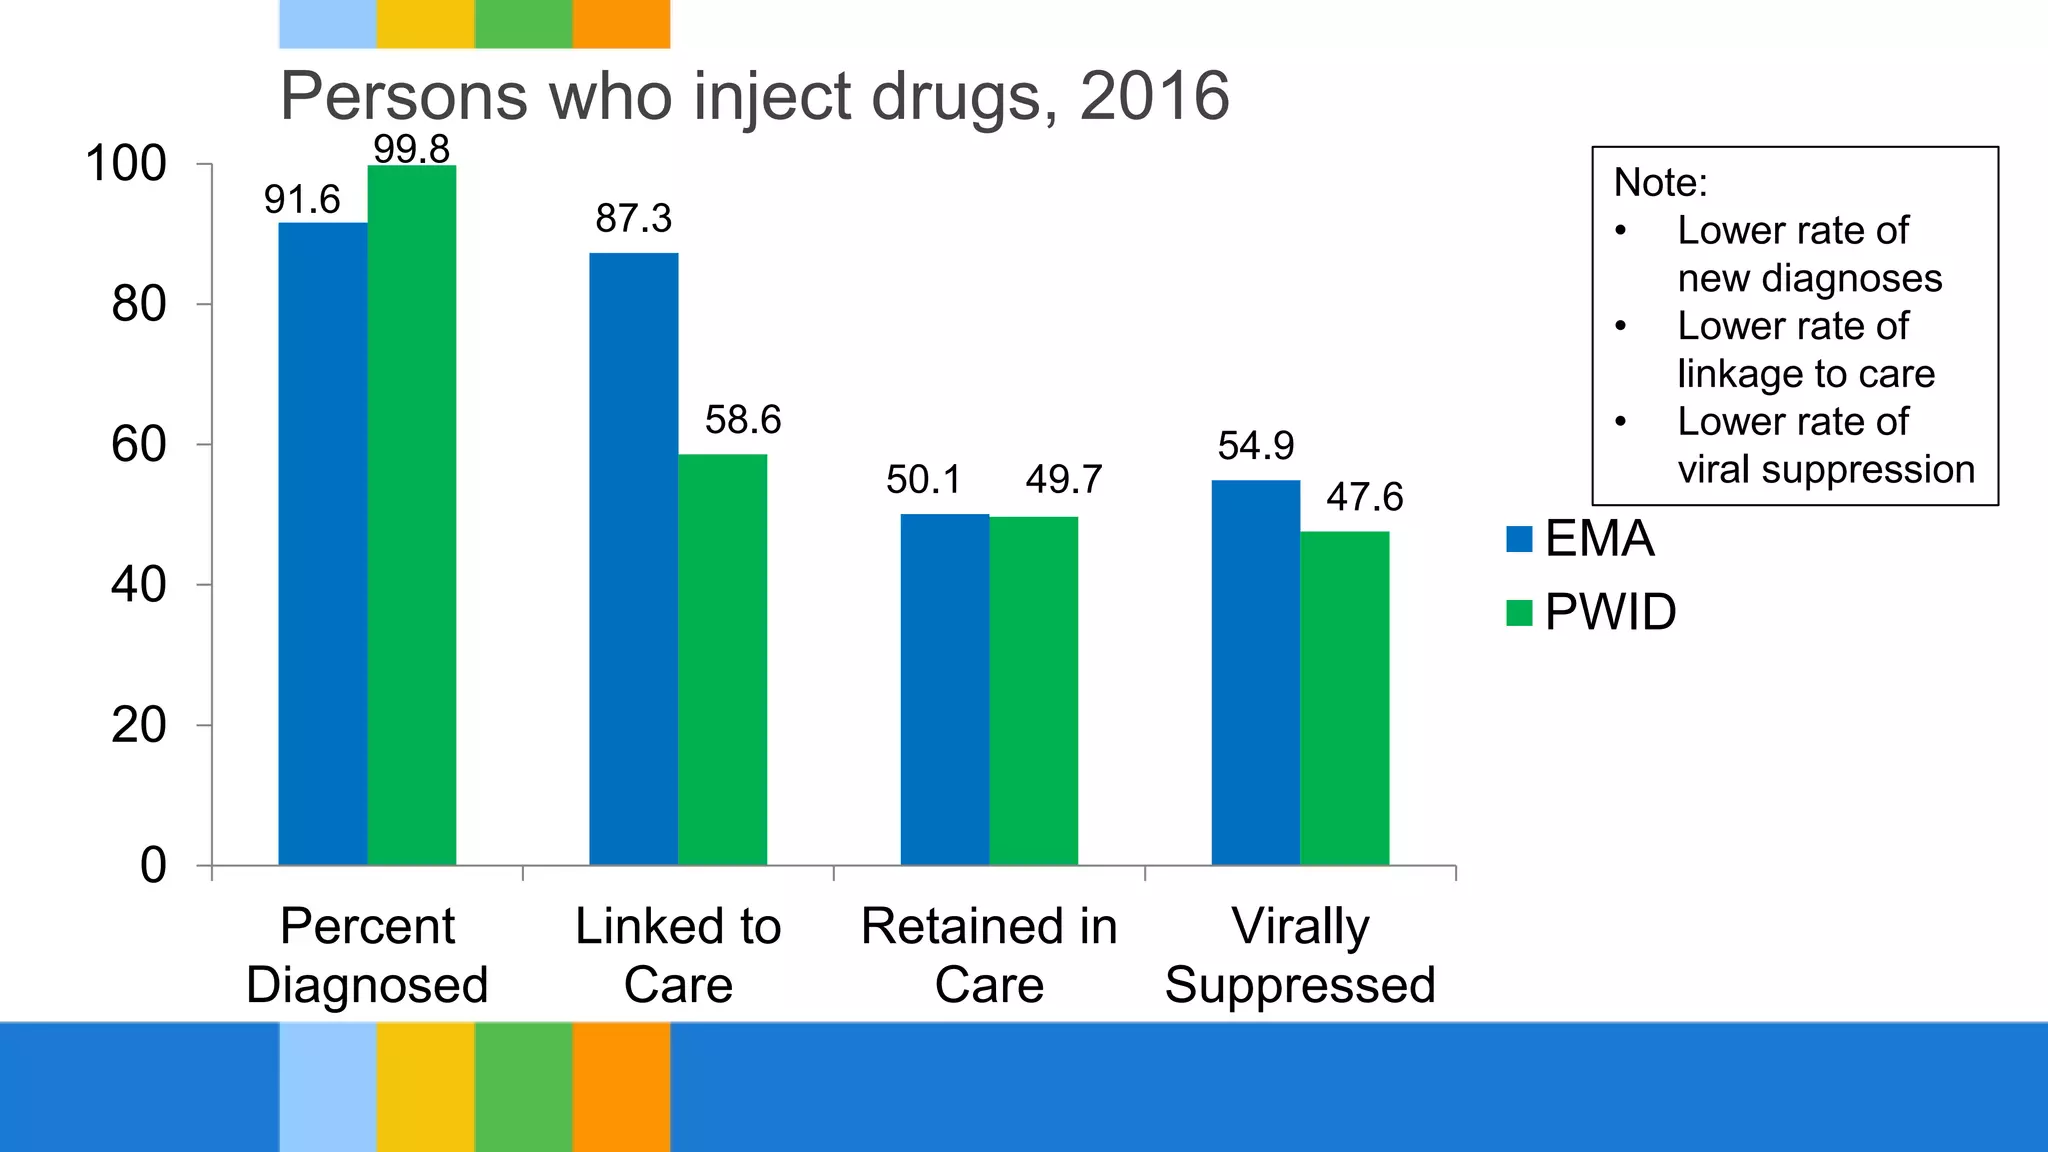

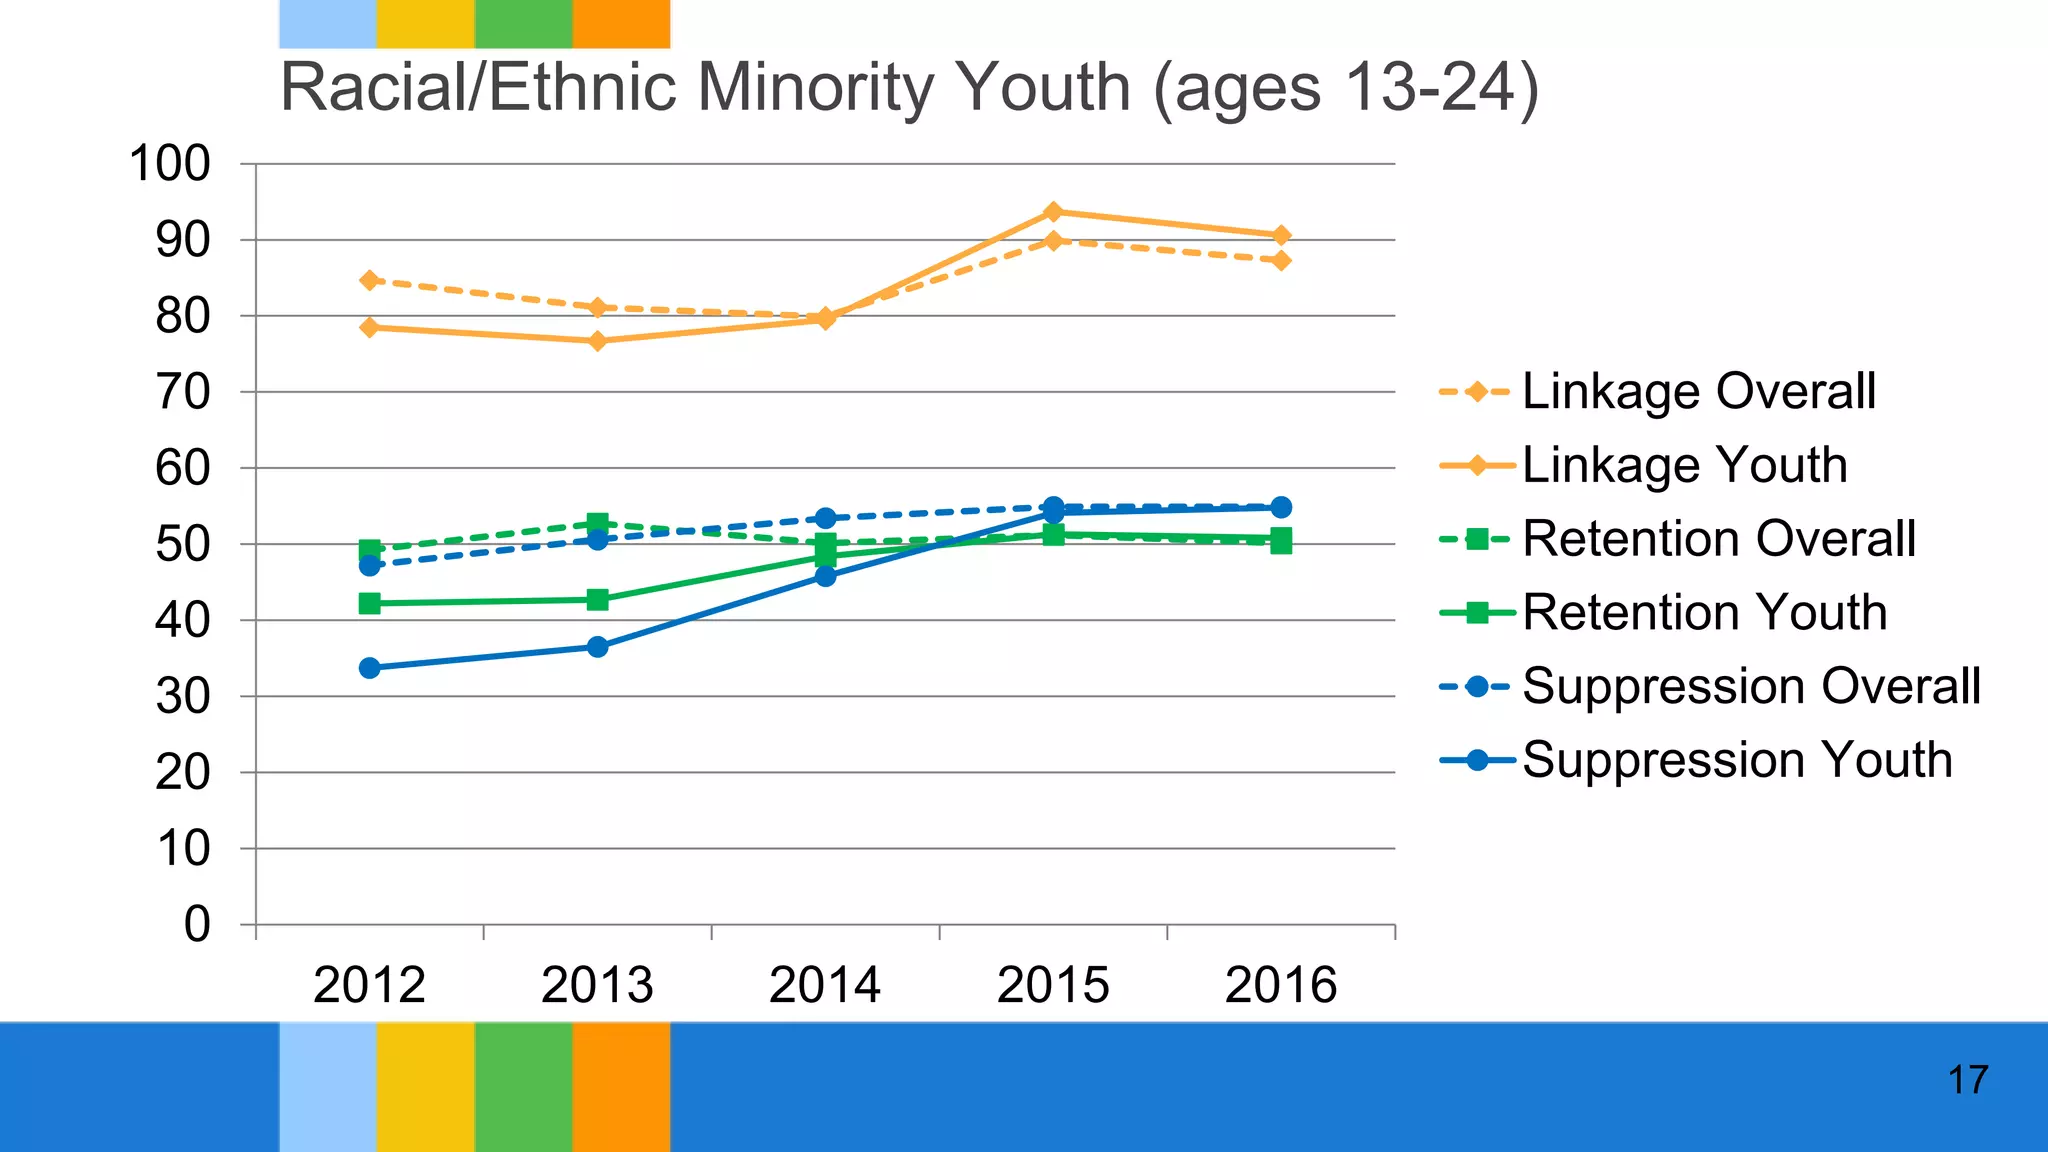
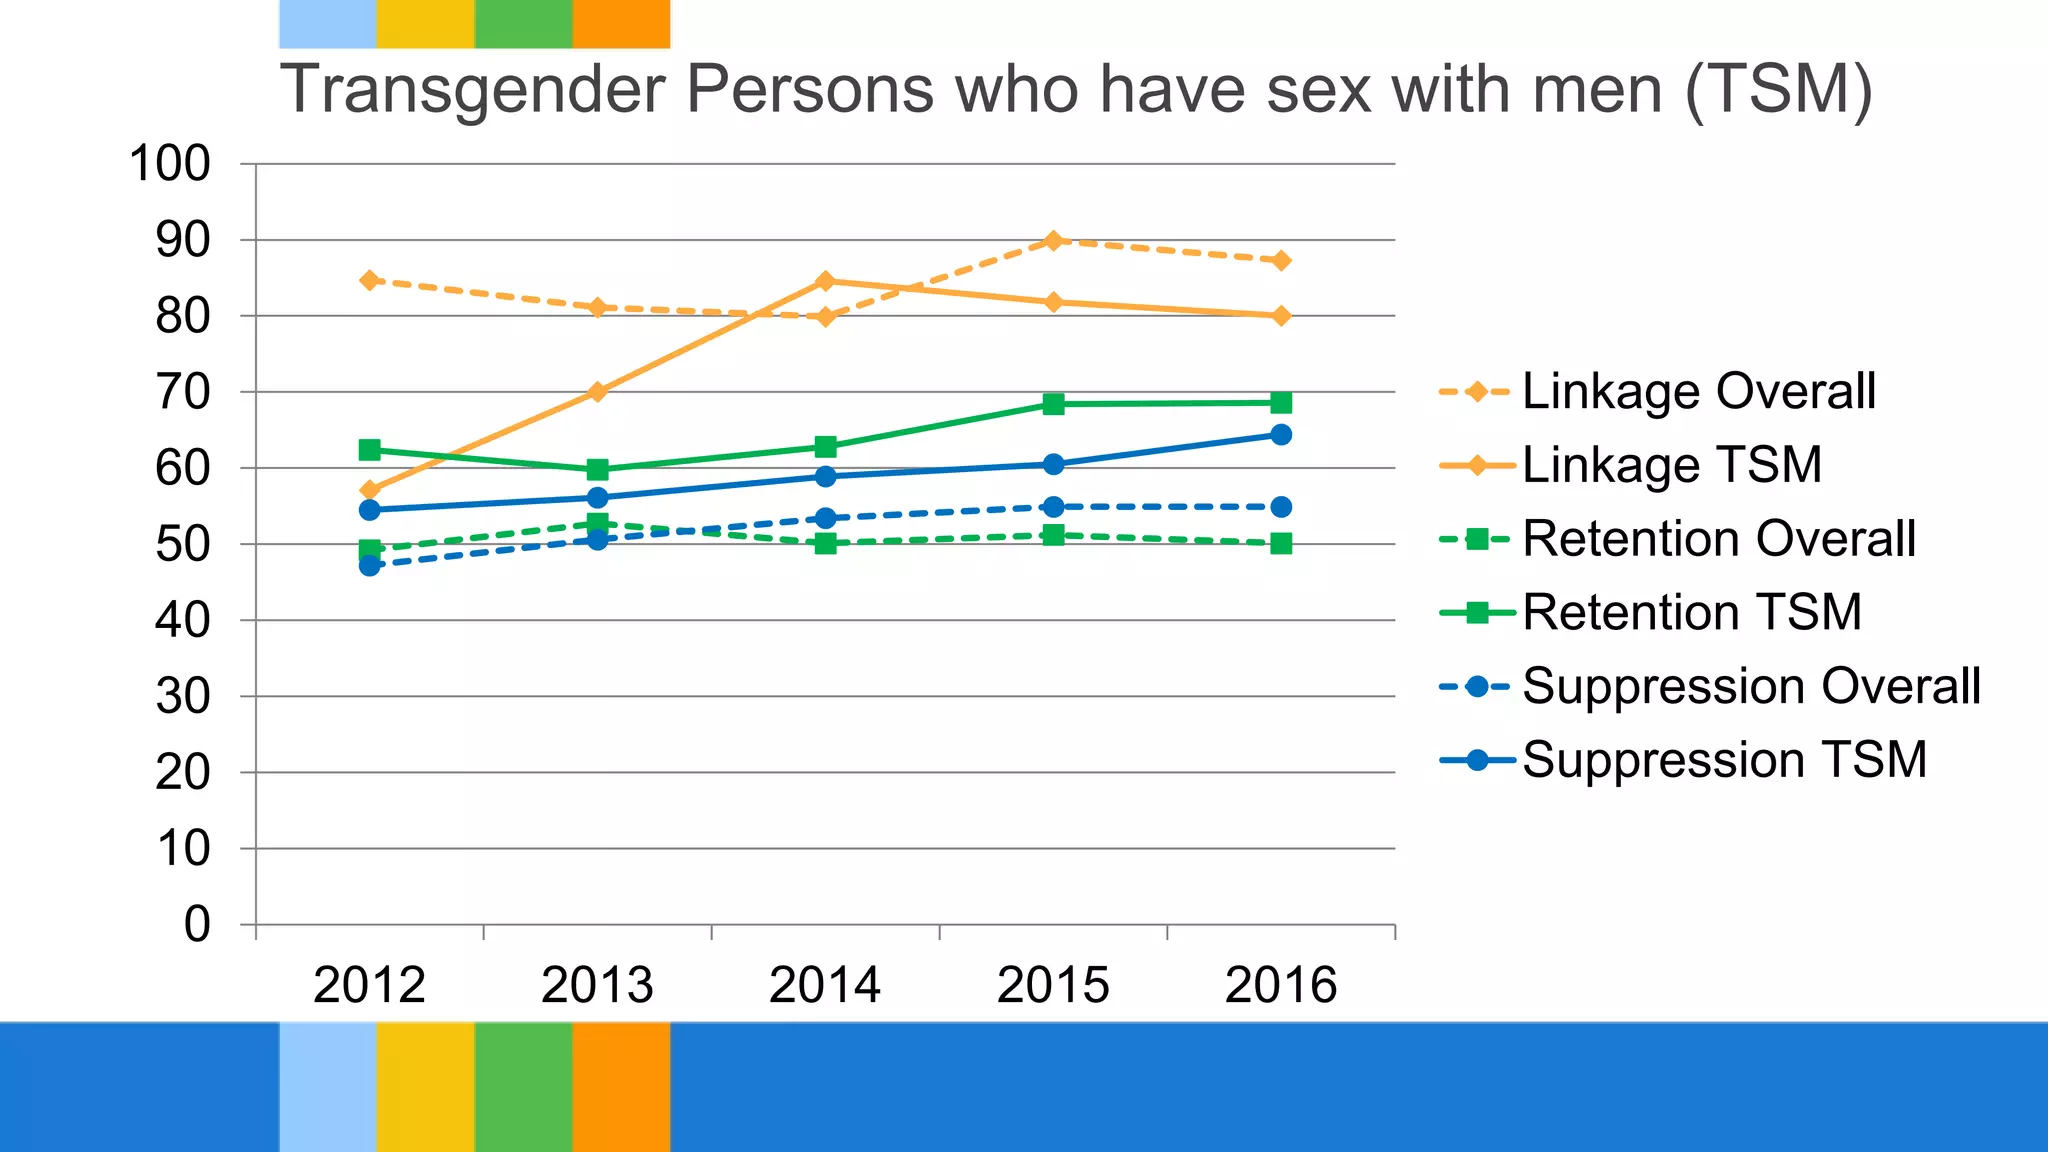
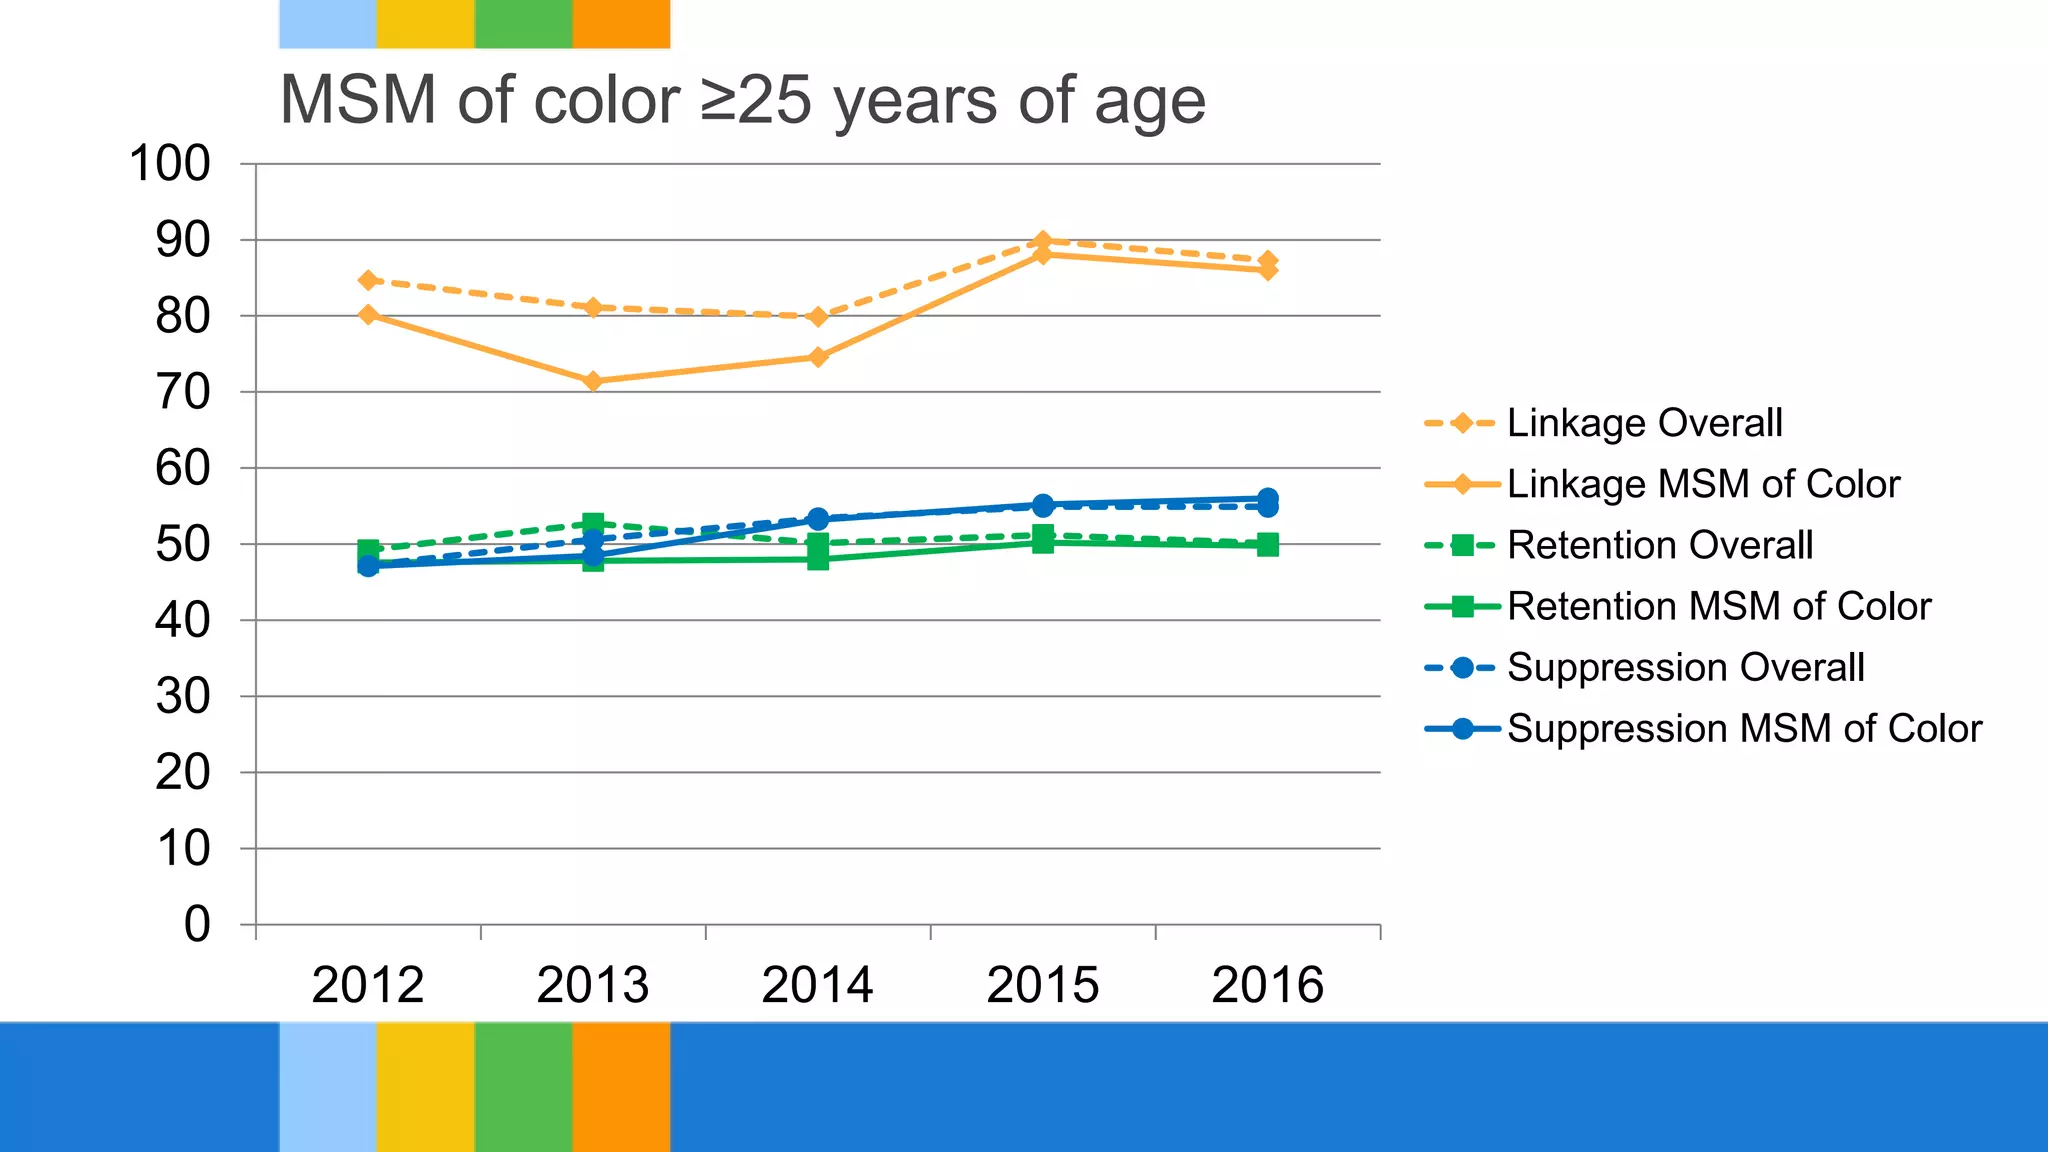
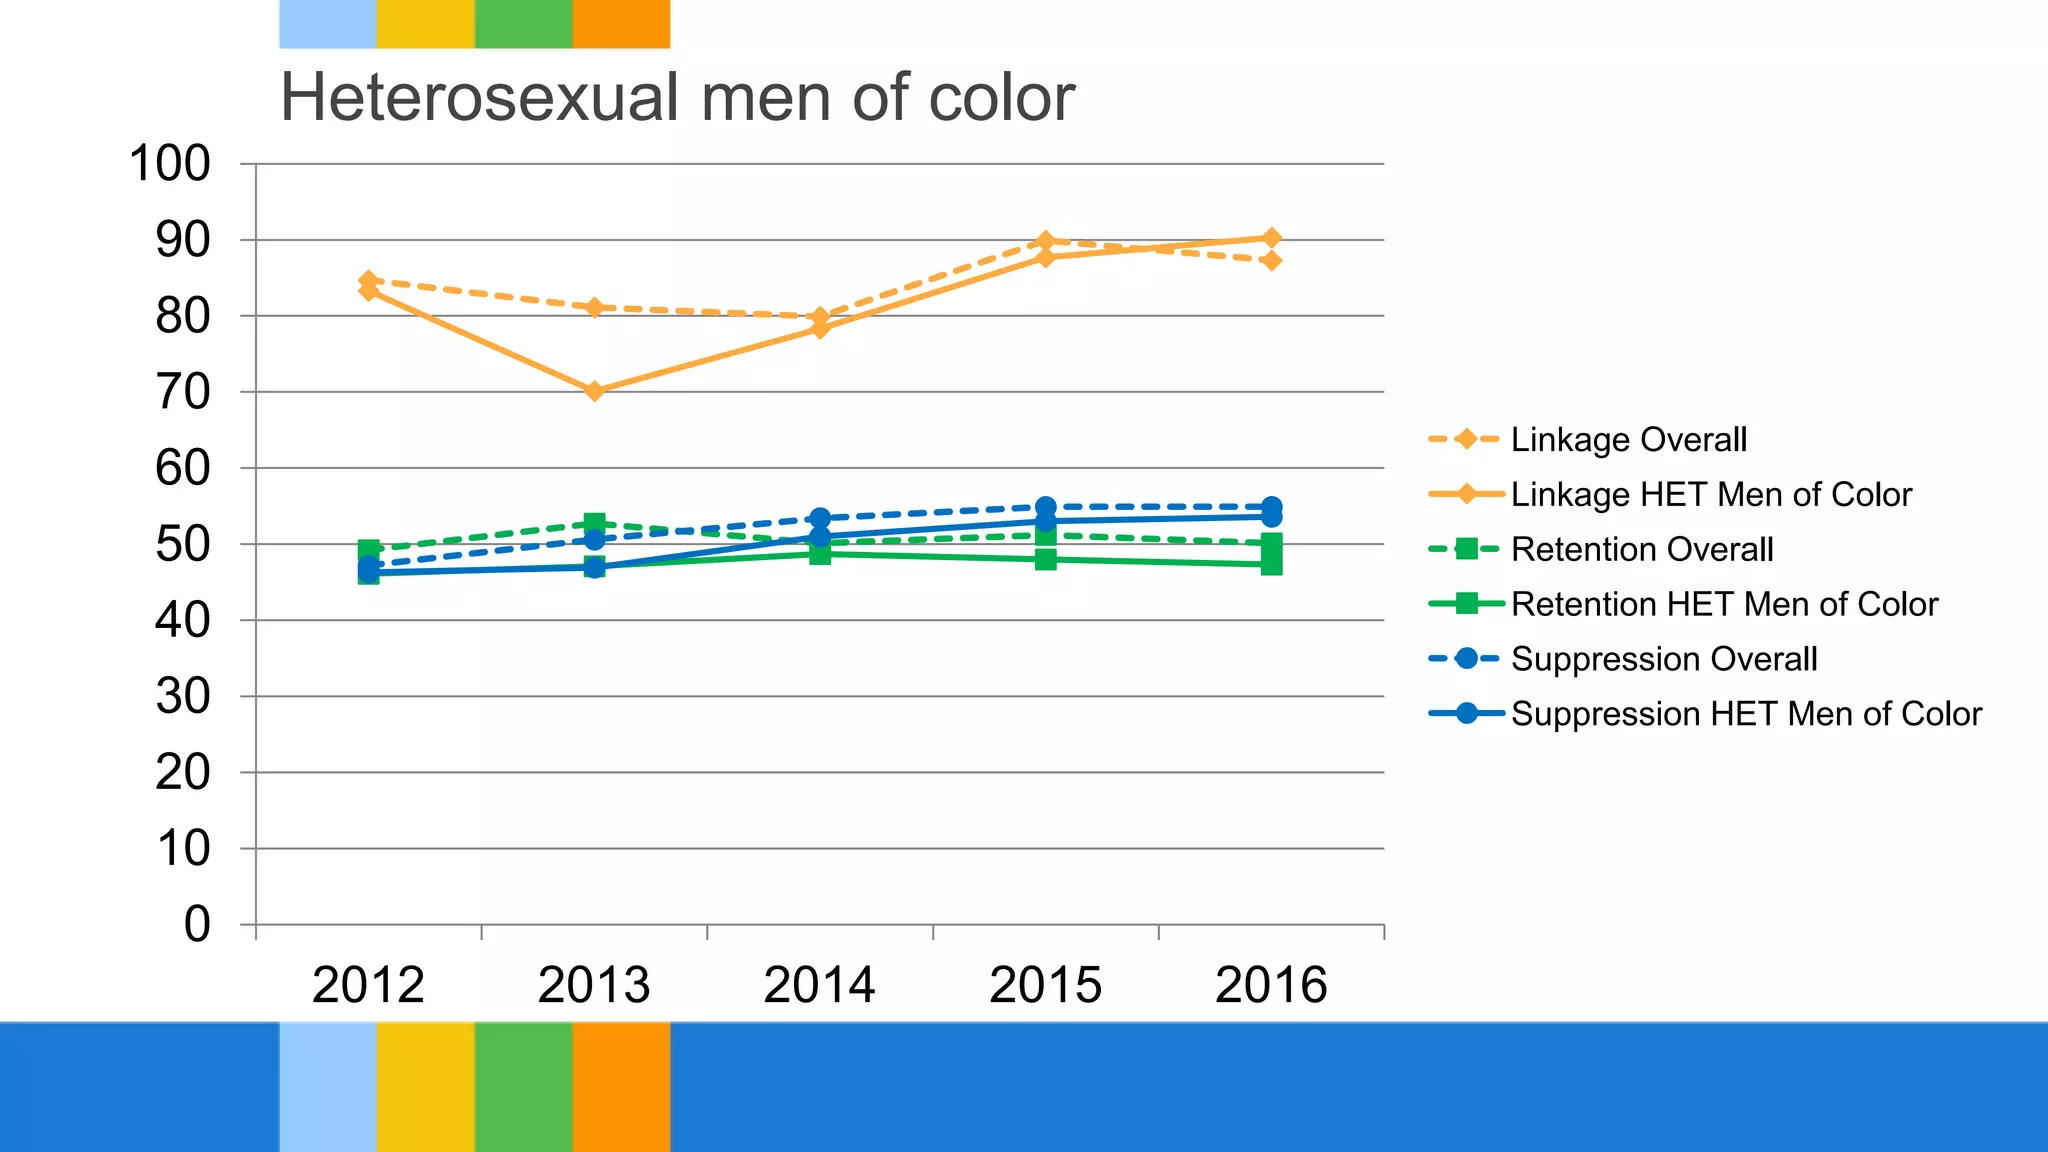
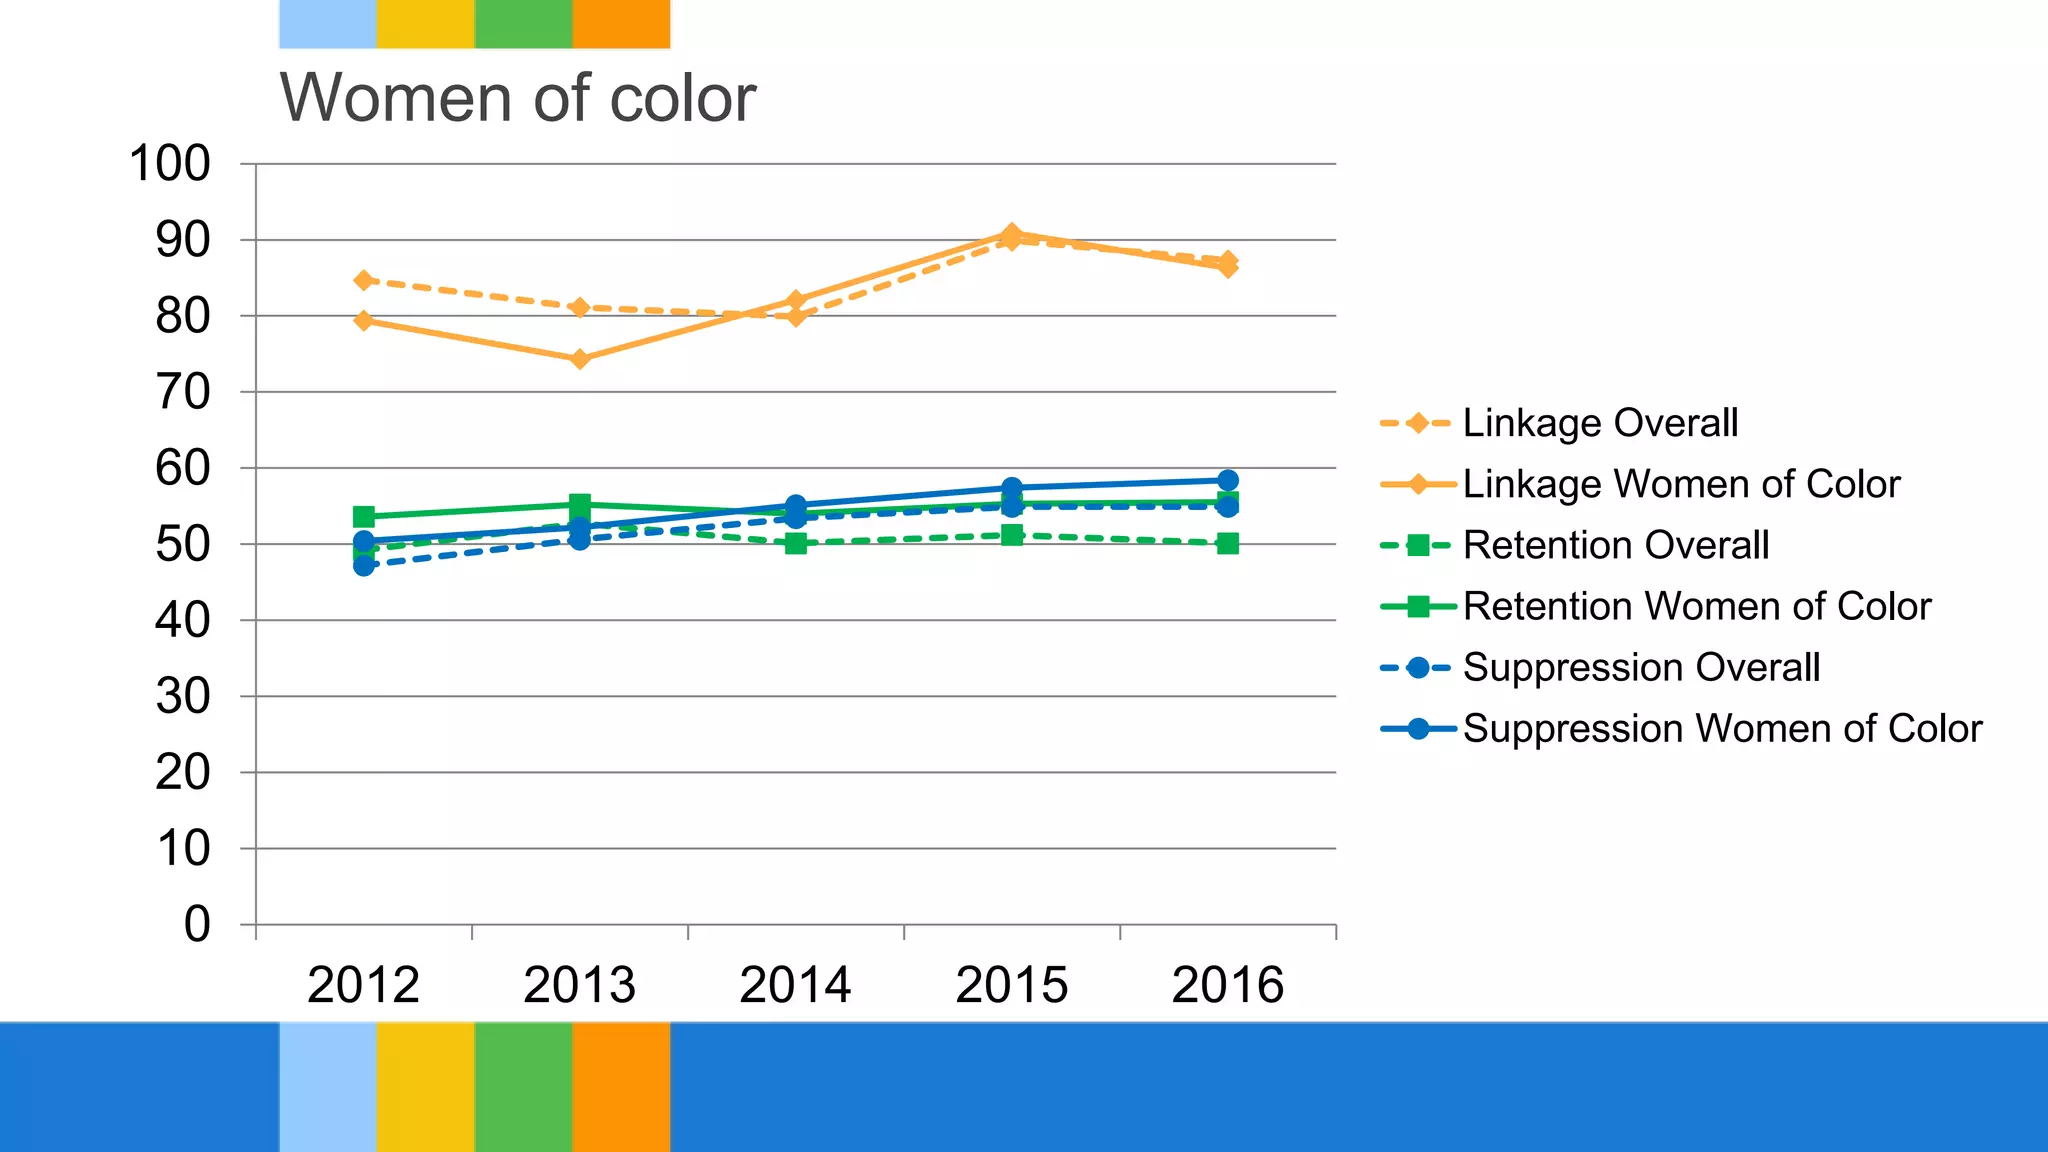
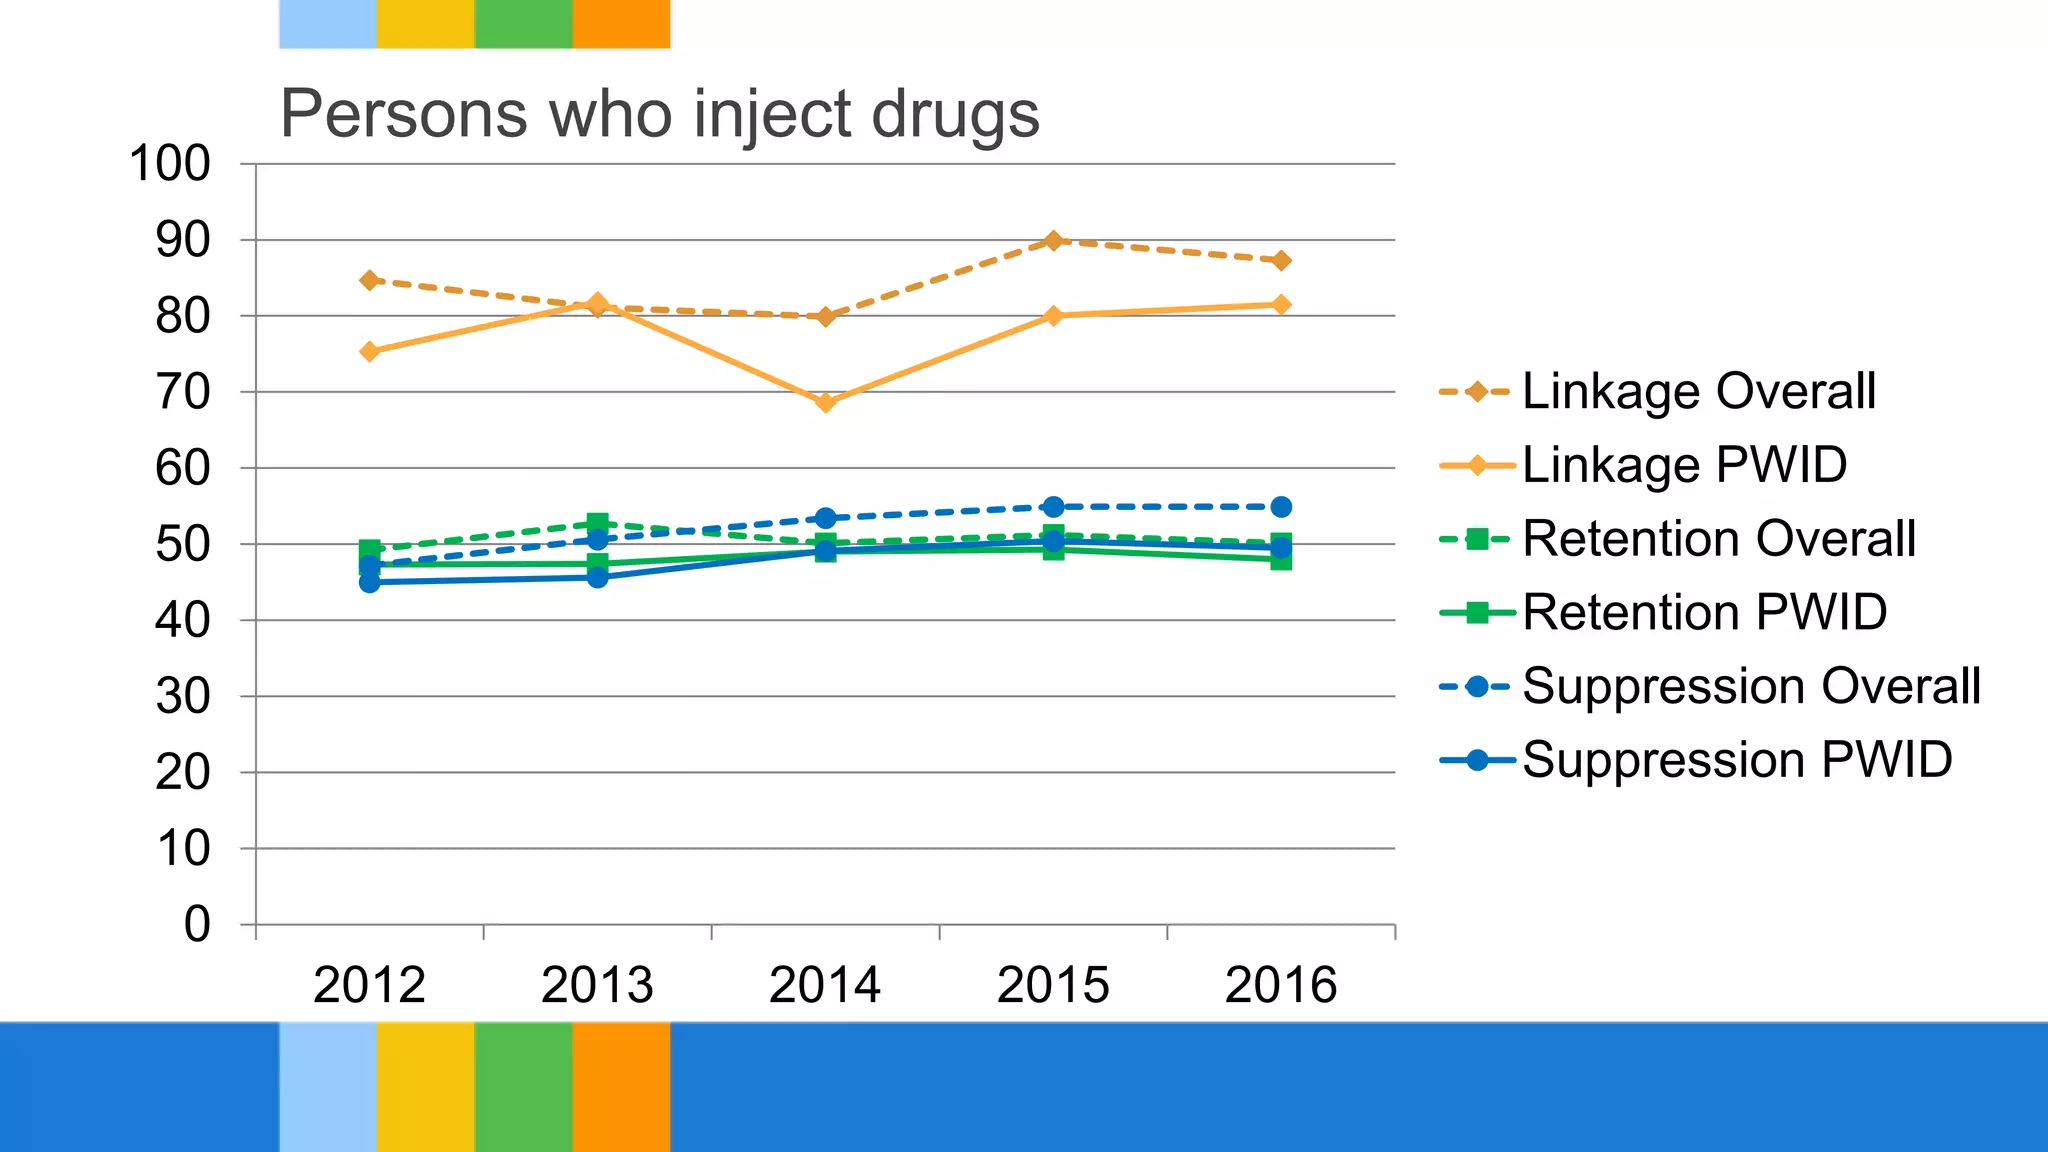

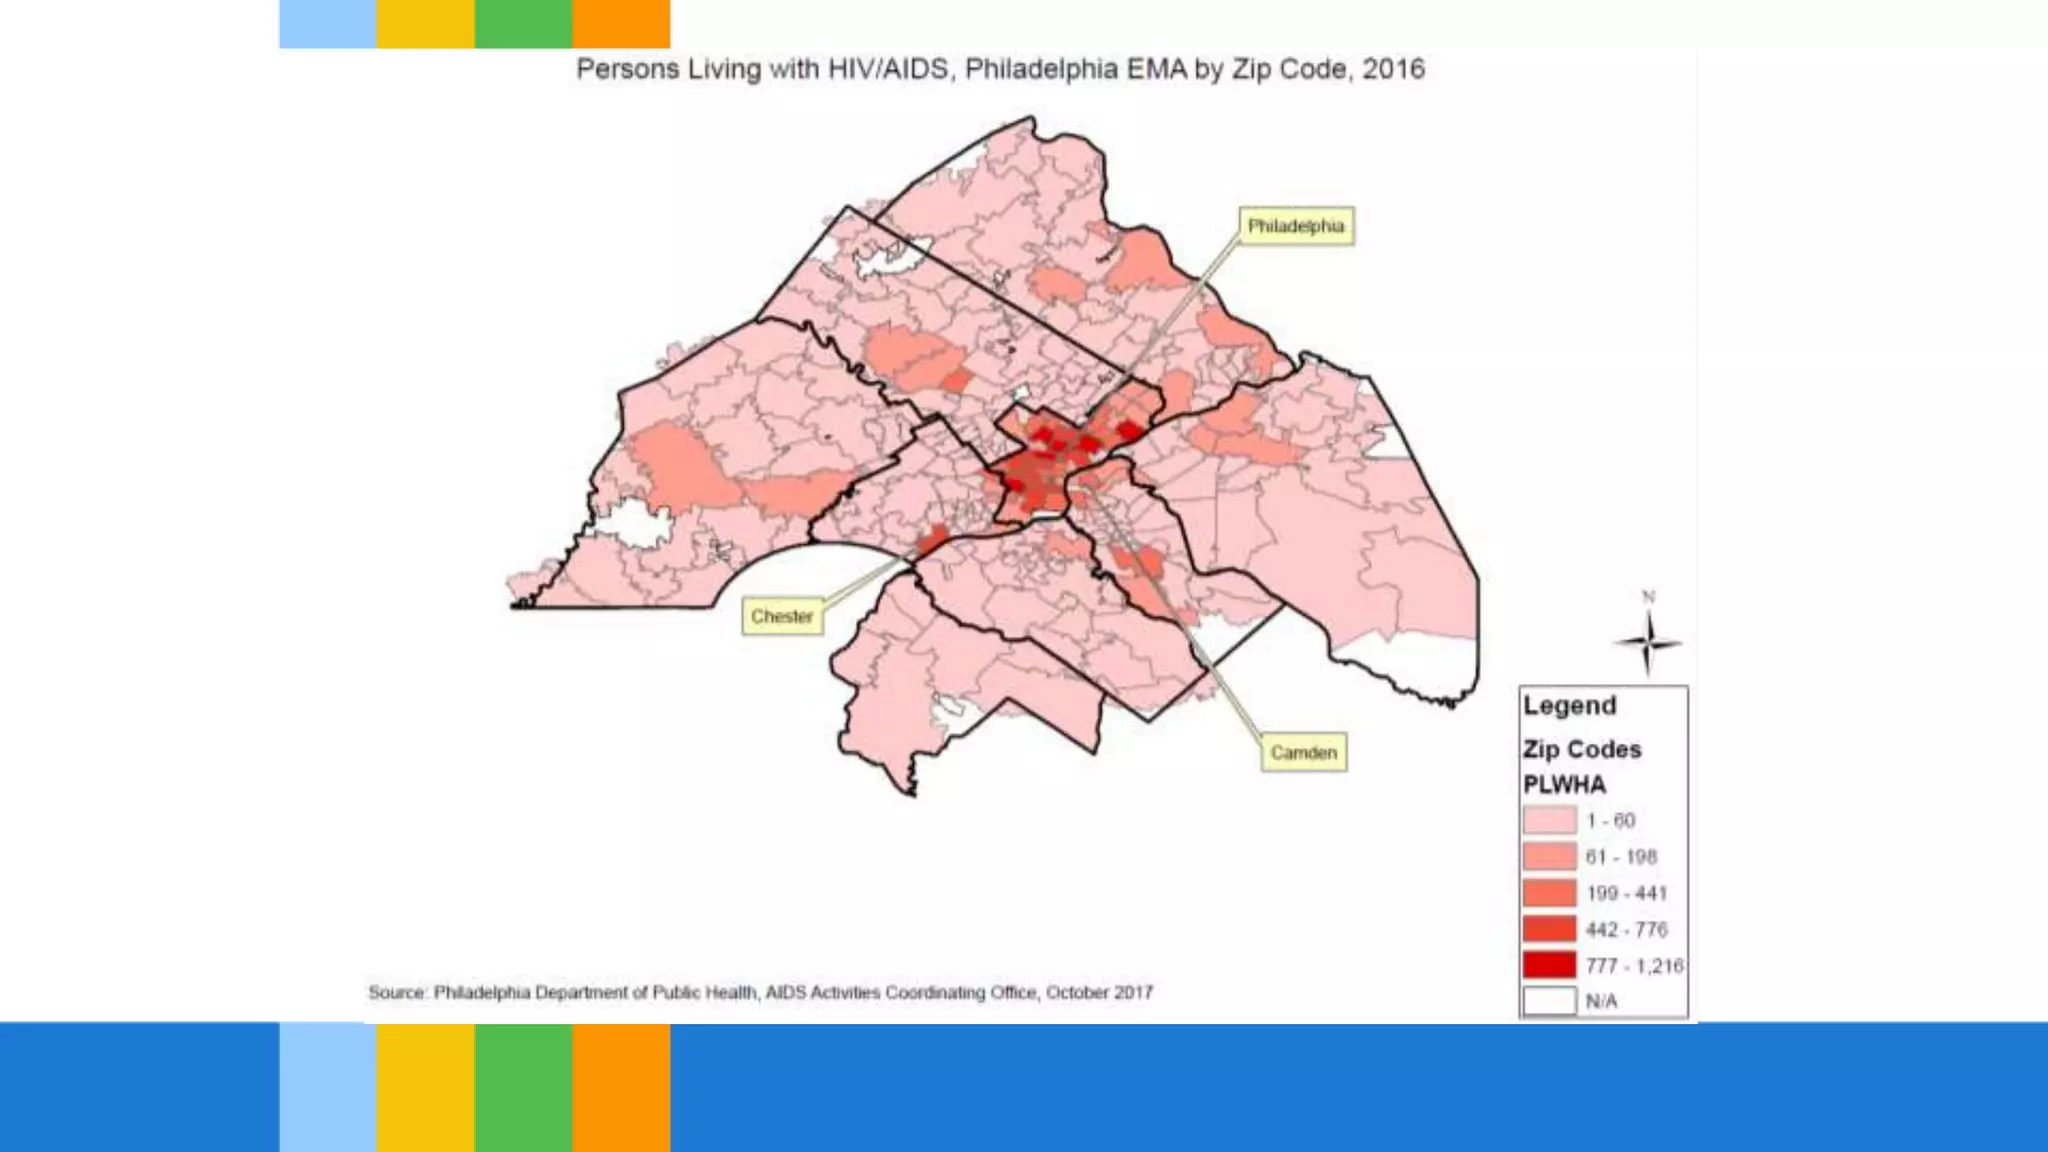
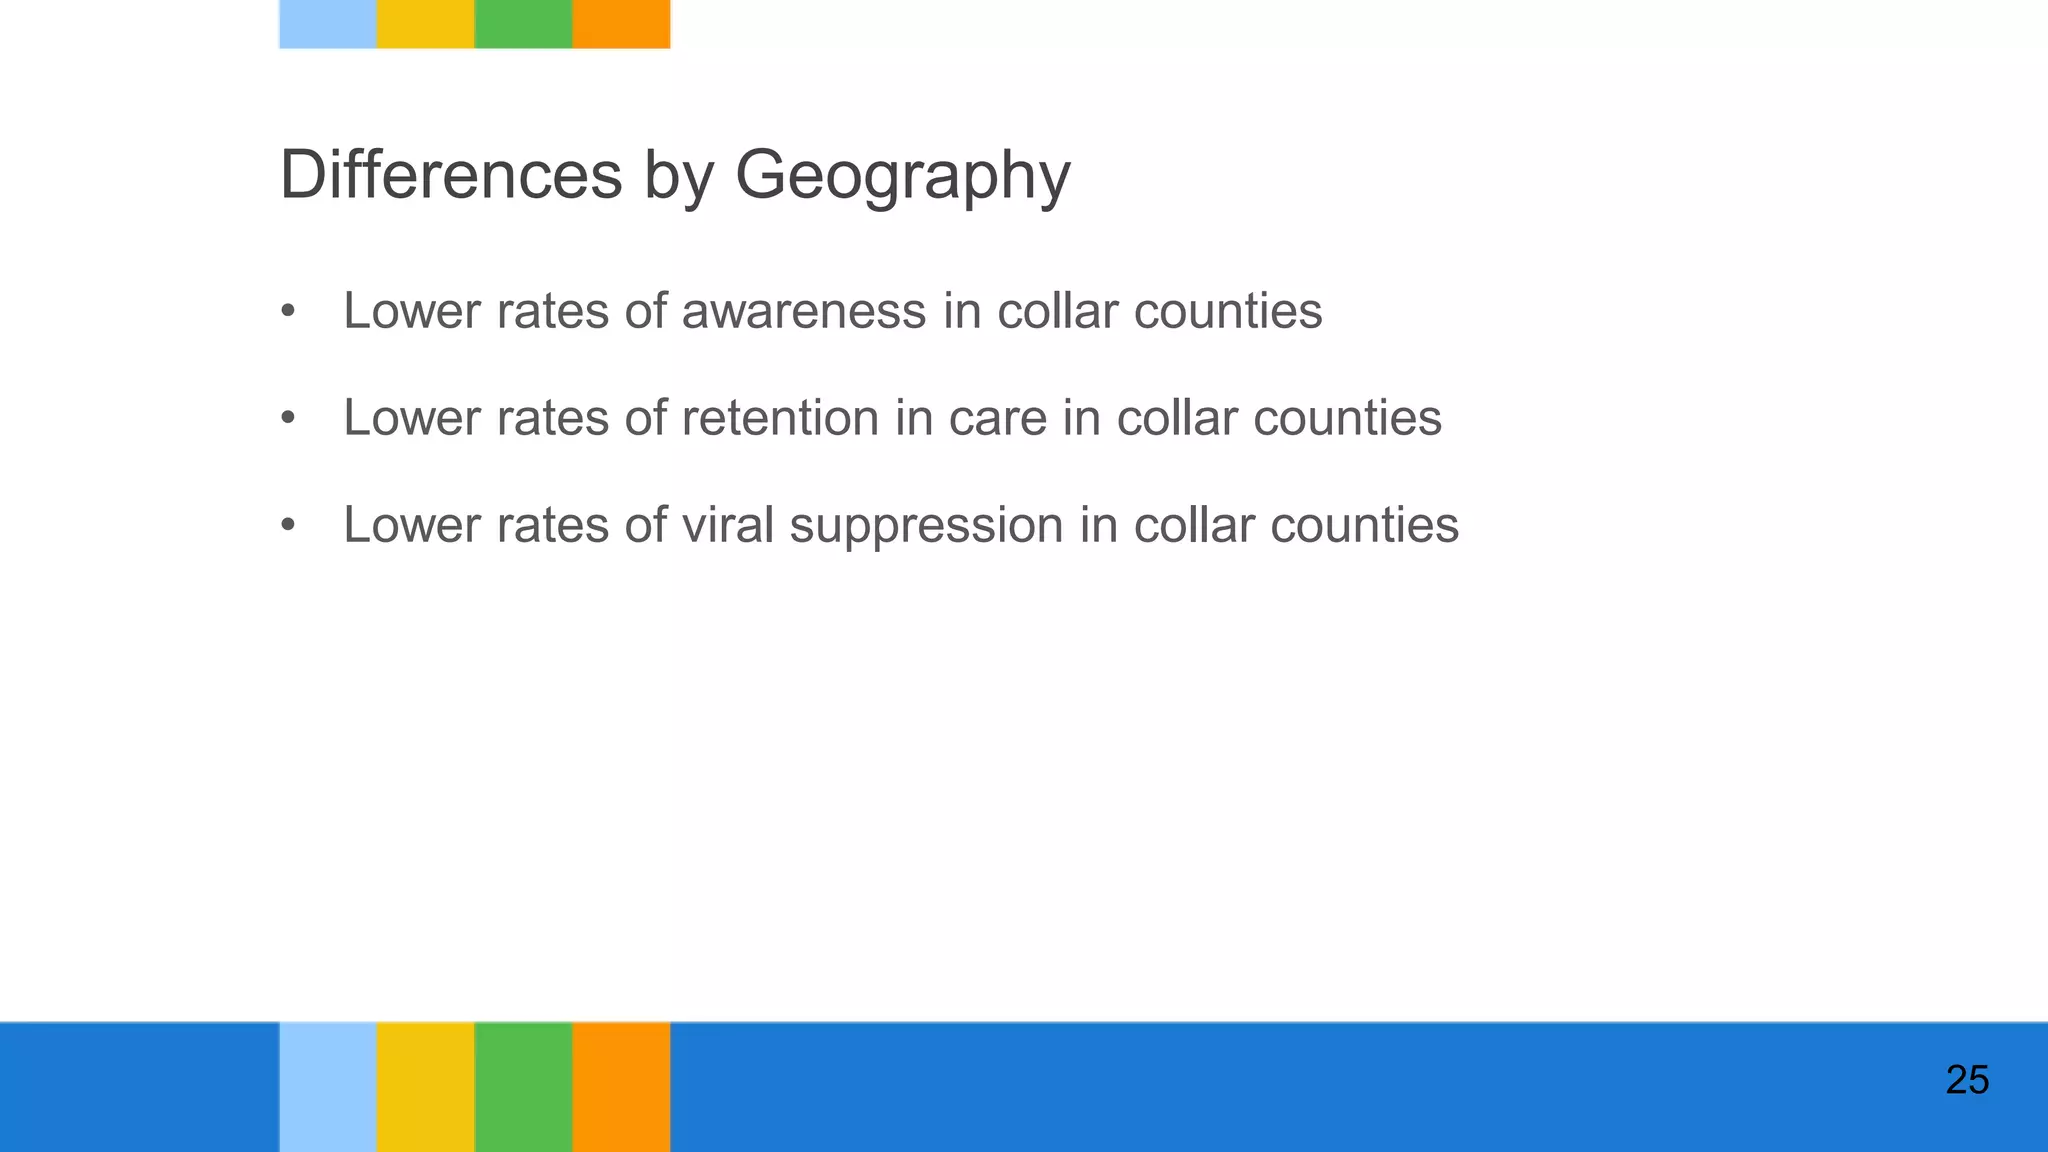
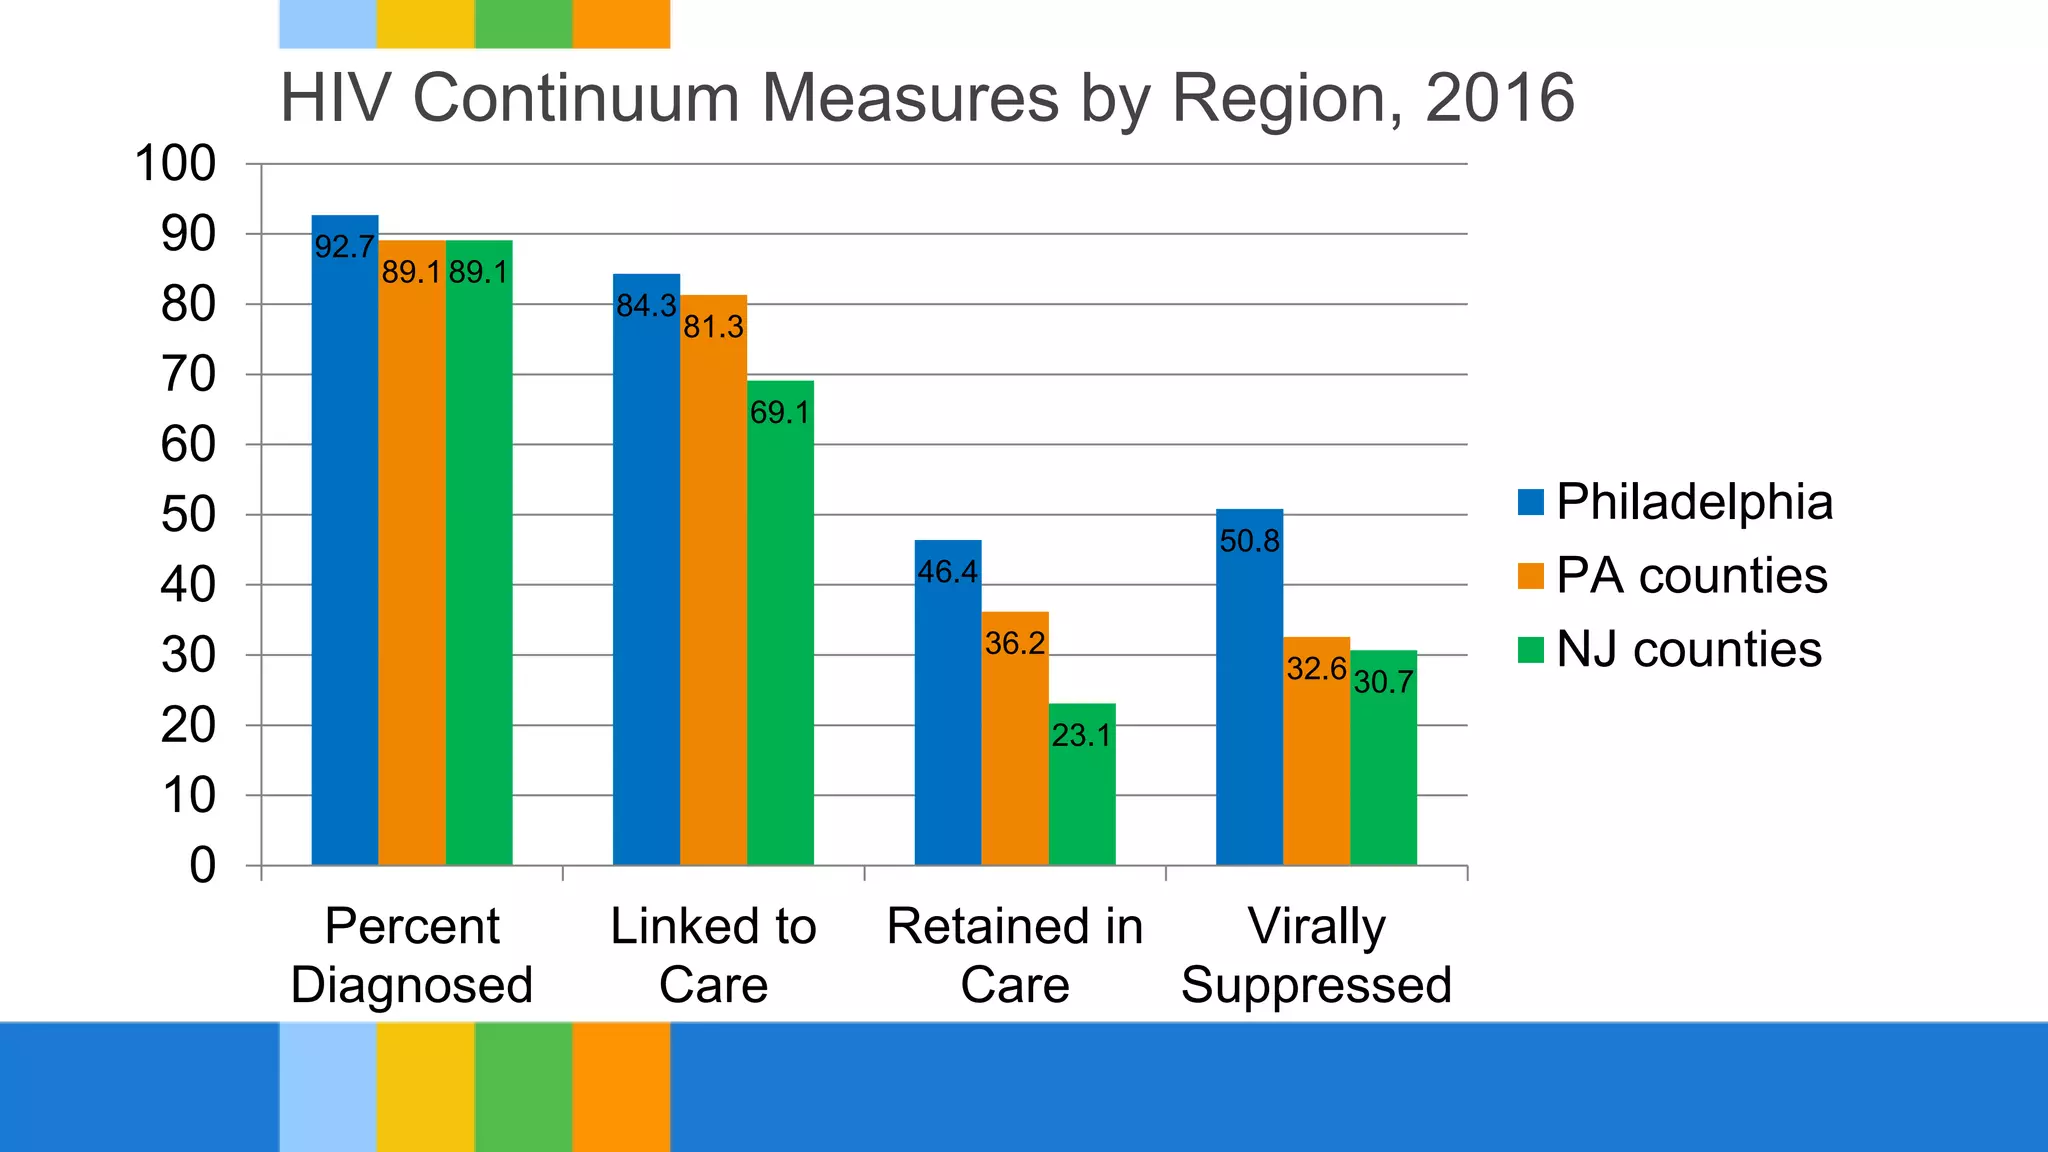

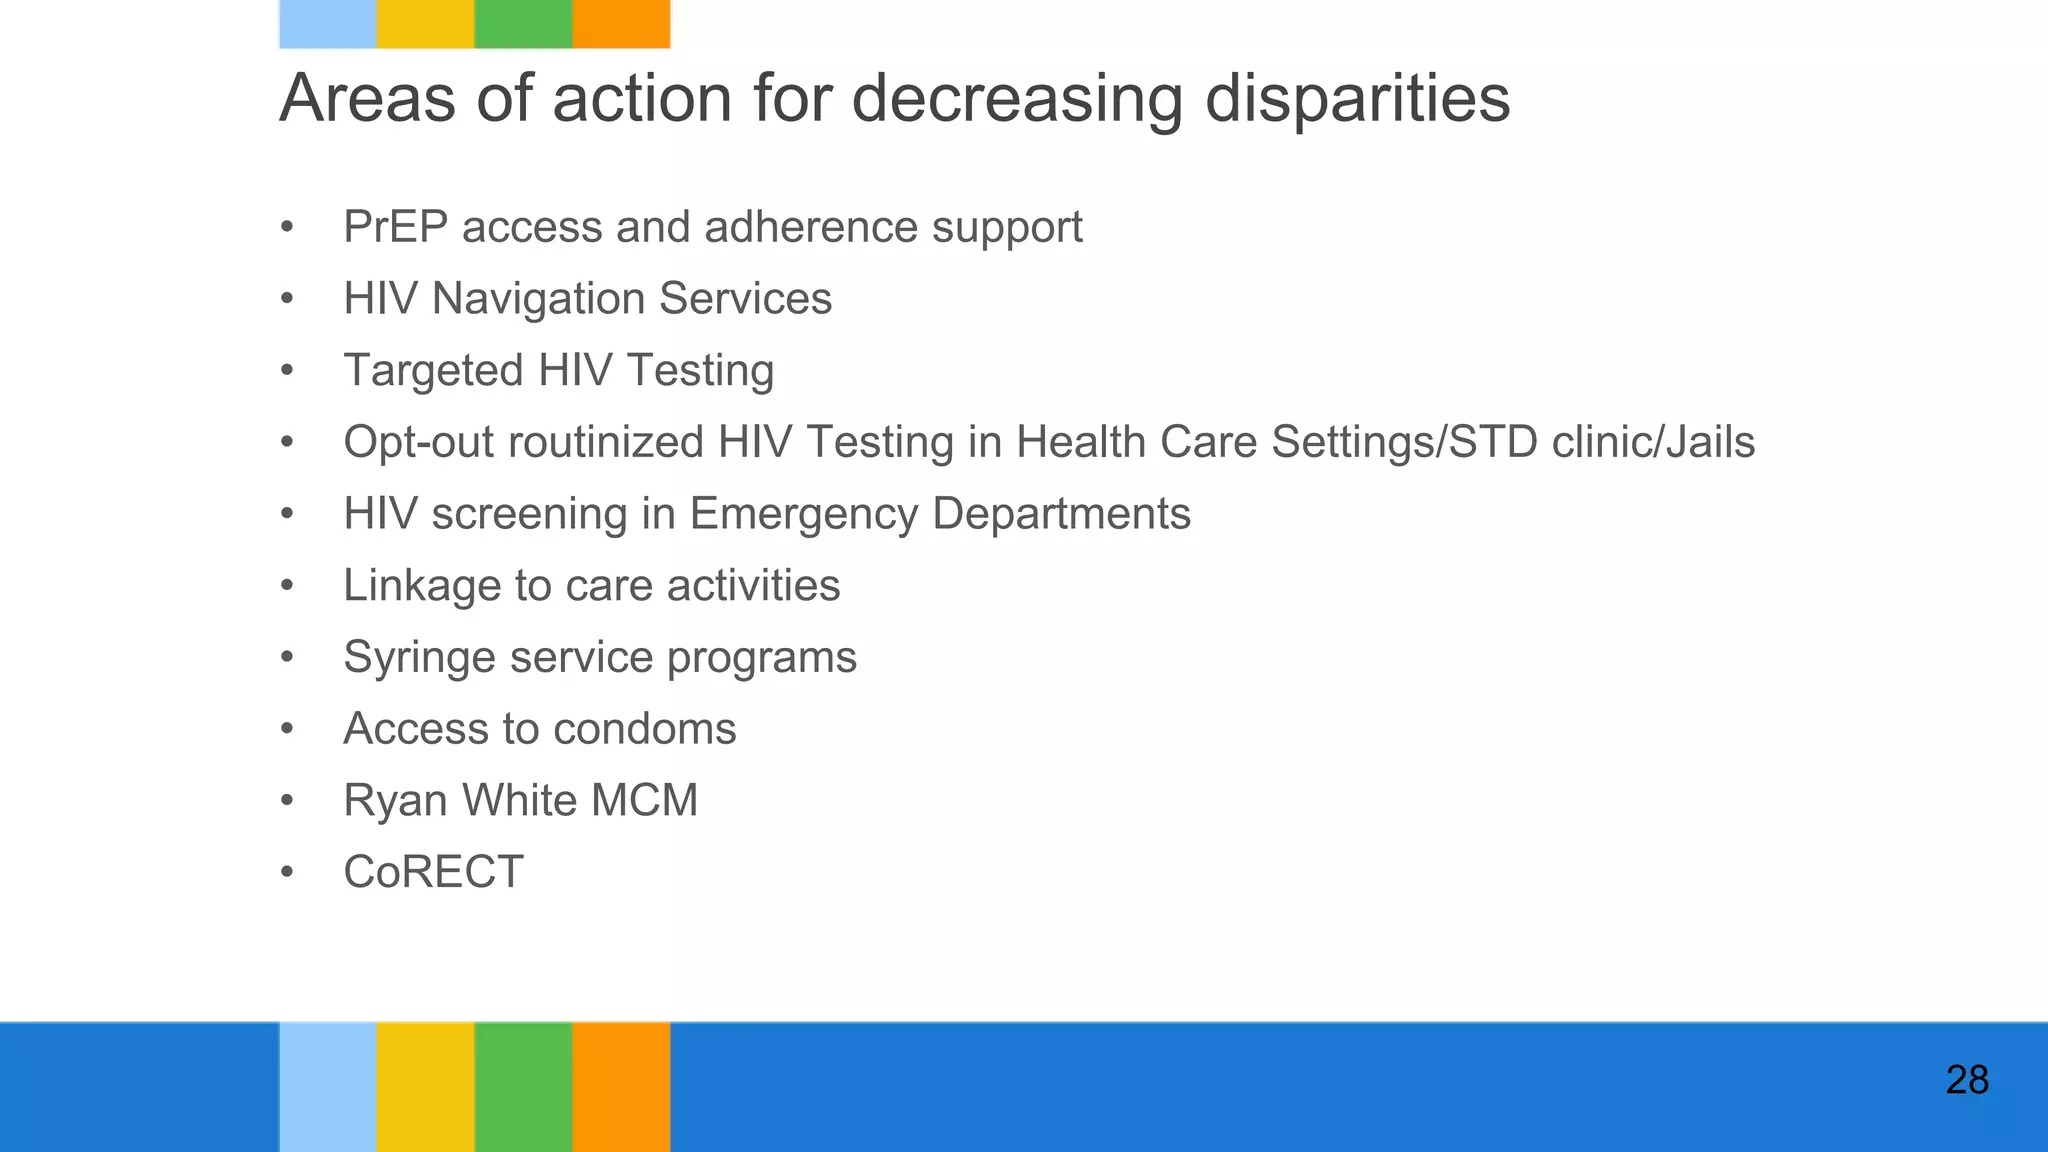
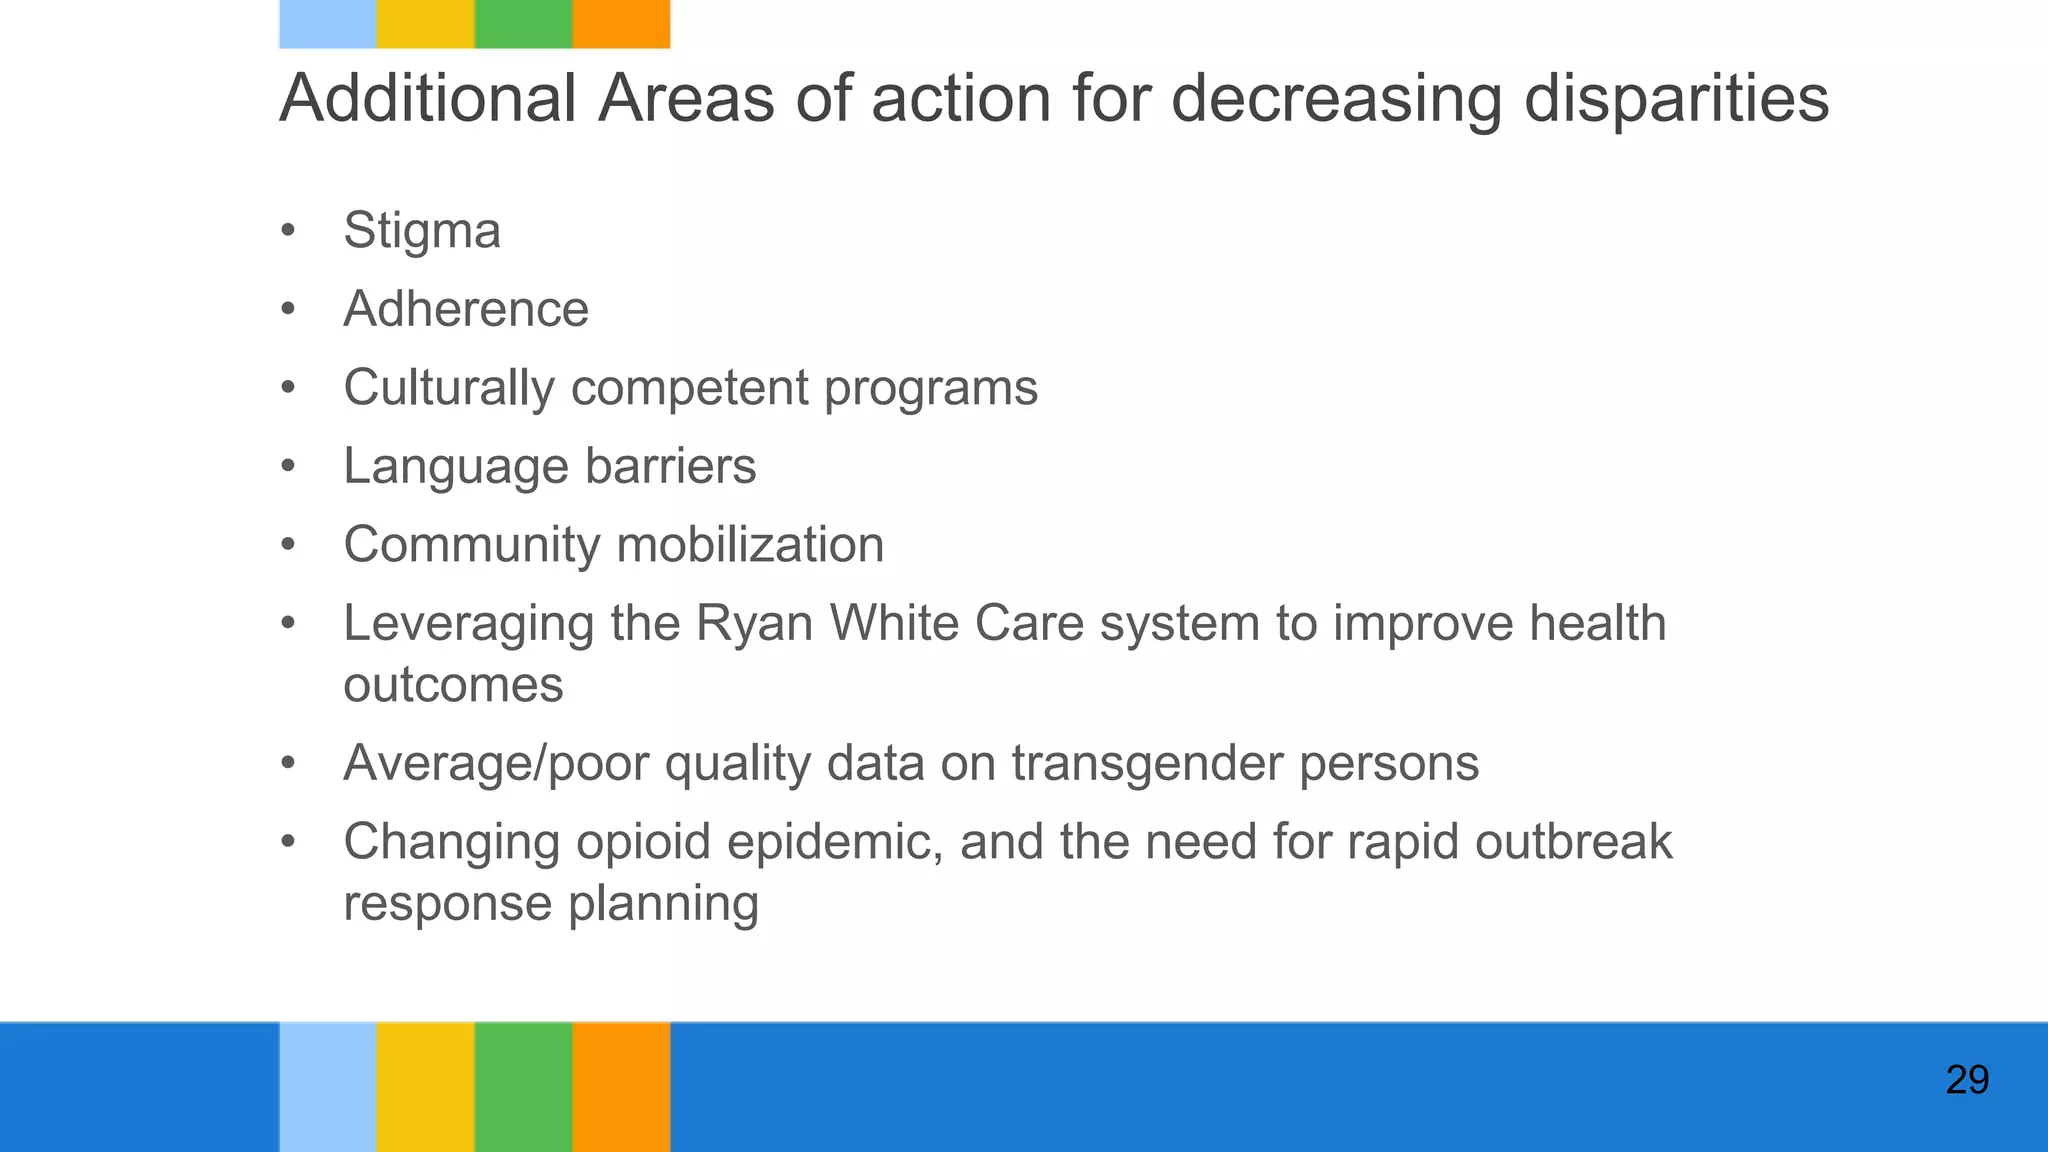

This document summarizes disparities in Philadelphia's HIV continuum of care. It identifies several priority populations that experience lower rates of HIV status awareness, retention in medical care, and viral load suppression. These include racial/ethnic minority youth, transgender persons who have sex with men, heterosexual men of color, and persons who inject drugs. The document also finds geographic disparities, with lower continuum measures in collar counties surrounding Philadelphia. It concludes by recommending several areas for action to decrease disparities, such as increasing PrEP access, HIV testing, and linkage to and retention in medical care.


