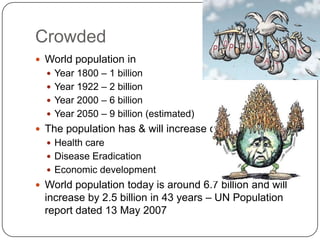
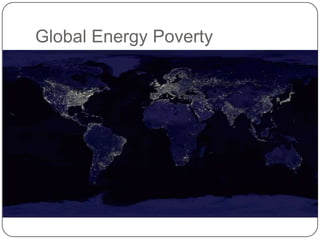
Environmental Management

            Introduction


nareshsukhani@gmail.com
Objective of this course...
 To understand the effects of the impacts of the
  modern human society upon the environment we
  live in
 Issues that effect the managers involving
   Networking or Politics
   Business itself, the projects, or the programs
   Resources like natural resources, facilities, money
   etc
 To explore ways to reduce our environmental
 footprint in day to day activities
What is Environmental Management
 It is the management of
   All the components of biological, physical and
    chemical in both biotic (living) and abiotic (non-
    living)
   The interaction of social, cultural, and economic
    environment with the bio-physical environment.
Why do we need to study this
course?
 We have just one planet which can sustain life and
  not 9
 The resources are limited
   Space on earth
   Non-renewable energy
   Natural resources
 The environment is depreciating in life sustaining
  capabilities at an ever increasing pace.
 At this rate, the day is not far when we reach a point
  of no return and face the wrath of global climatic
  change
 We need to understand our responsibility towards the
  environment and adopt an environment friendly
  system of working
Hot, Flat and Crowded
Crowded
 World population in
   Year 1800 – 1 billion
   Year 1922 – 2 billion
   Year 2000 – 6 billion
   Year 2050 – 9 billion (estimated)
 The population has & will increase due to
   Health care
   Disease Eradication
   Economic development
 World population today is around 6.7 billion and will
  increase by 2.5 billion in 43 years – UN Population
  report dated 13 May 2007
Crowded
 The maximum growth will happen in the lesser
  developed countries as their economies grow from
  5.4 billion in 2007 to 7.9 billion in 2050
 Developed countries population will remain more or
  less stable and shall hover around 1.2 billion
 Some facts
   Year 1800 – London was the largest city with pop. 1
      million
     Year 1900 – 111 cities with pop. 1 million
     Year 1995 – 300 cities with pop. 1 million
     5 cities with pop. over 10 million in 1975
     14 cities with pop. over 10 million in 1995
     26 cities with pop. over 10 million in 2015 (estimated) –
      UN pop. Fund statistics
     Mumbai has a pop. of over 19 million
What are the effects of Crowding
   Loss of arable land
   Over fishing
   Water shortage
   Air & water pollution
   Stress on cities infrastructure
   Per capita decrease in facilities like health care

 By 2030 number of cities dwellers expected to rise to
  5 billion – Associated Press 27/06/2007
 These increases will happen more in smaller cities
  than in the larger ones around 45% growth in pop.
 Terrorism will no longer be a problem, demographics
  will
Population Growth
A Beach in China
Aamchi Mumbai...
Flat
 Personal computer invented in around 1975.
 By 1977 PC were being mass produced
 PC enabled users to become authors of their own
    content
   Then came the Internet, WWW & Web browser
   Software and transmission protocols started
    flattening the world by enabling outsourcing
   Geopolitical flatteners are the fall of Berlin Wall on
    Oct 03, 1990 & collapse of communist Soviet
    Union
   These factors made the world seamless making
    the world entirely flat.
Flat
 200 million people improved their economic
  conditions in 1980’s and 1990’s in China and
  India, raising them from poverty
 10 of millions added to the middle class


 This created more demand for products like cell
  phones, computers, gas stoves, refrigerators etc
 These products created demand for raw materials
  and led to increase of green houses gases (GHG)
  either during production, usage or upon
  discarding
Light Bulb Example
 In the next 12 years we shall have another 1
  billion people
 Now, if we give each of these people a 60 W
  incandescent light bulb
 The weight of individual light bulb is
  negligible, but 1 billion light bulbs will weigh
  around 20000 metric tonnes
 If we were to turn these light bulbs ON, all at one
  time for 4 hours a day, we would need 10000 MW
  of electricity which would need 20, 500 MW
  power plants. If these power plants are coal
  fired, imagine the amount of GHG emitted
Hot
 The global average temperatures have increased
    by 0.8C vis-à-vis 1750s
   It all started with the industrial revolution in late
    1700s when we went from manual or horse
    power to machine power, from agricultural to
    manufacturing societies
   Industrial revolution was the revolution of energy
   Steam engine –converted the chemical energy of
    coal/wood to mechanical energy of industrial
    machinery
   Eventually coal was started being preferred for
    wood as it generated twice as much energy as
    the same weight of food.
   This slowed down deforestation
Earth has a fever and needs
help!
Hot
 Coal was used for
     Industrial process
     Metallurgy
     Heating building
     Power steam engines
 Crude oil was commercially exploited in 1800s where
  is first replaced whale oil used for lighting lamps and
  then for heating, manufacturing and fuel for engines.
 In short, man needed these sources of energy for
     Light
     Heat
     Motive power, or
     Electricity
The Industrial Revolution
Transportation Revolution
 Early 20th century saw a “Transportation
    Revolution” - from the internal combustion
    engine
   The first gasoline powered automobile was made
    in 1885
   First mass produced automobile was the Old’s
    Mobile in 1902 by Ransom E. Olds.
   It was Henry Ford in 1896 who started working on
    an assembly line.
   The Ford’s T-Mobile which first rolled out in 1908
    and by 1927 when it stopped production 18
    millions cars had rolled out of the assembly line
Hot
 These cars, produced a lot of CO2 and required a
    lot of crude, iron steel & rubber which further
    emitted more GHG during their production.
   This triggered industrialisation and which resulted
    in urbanisation and suburbanisation
   We had now been sucked into a vicious cycle of
    energy dependency which produced lot of
    emissions and caused a lot of harm to the
    environment
   “We build an inefficient system with great
    efficiency”
   Soon the entire world copied America and Europe
    and followed the path of self destruction
Fuels
 Fuels from Hell
   Coal
   Oil
   Natural gas


 Fuels from Heaven
     Wind
     Hydro
     Solar
     Tidal
     Biomass
The Green House Effect
 Without GHG the earth’s average temperature is
    estimated to be 15C cooler. A 5-6 C drop in
    temperature brings in an Ice-age
   Composition of Earth’s atmosphere has remained
    more or less constant for over 20 million years
   But in the last 100-200 years, things have changed
   Concentration of CO2 for 10000 years have been 280
    ppm as evident from polar ice core samples
   Since, 1950’s this has increased
   2007 CO2 concentration was 384ppm and climbing 2
    ppm per year
   Average global temperatures have increased 0.8 C
Concentration of GHGs
Green House Gases
Green House Gases
 Global green house gases emissions due to
 human activities have grown since pre-industrial
 time, with an increase of 70% between 1970 &
 2004
CO2 & CH4
 CO2 sources
   Fossil fuels, deforestation, forest fires, agriculture,
   large scale cattle grazing
 CH4 sources
   Solid waste land fills, animal defecation, coal
   minng, rice farming, cattle belching
 CH4 is 21 times more potent in trapping heat than
 CO2
When Hot meets Flat and Crowded

    Convergence of Global Warming, Over
      population and Global Flattening
s
Convergence of Hot, Flat and
Crowded
 Energy demand and supply
 Petro-dictatorship
 Climate change
 Energy poverty
 Biodiversity loss
Energy Demand and Supply
 Fuels from Hell are expensive, dirty, and not really
    abundant
   The demand for fossil fuels grew by 5% per year
    between 1951-1970 in the developed nations
   Developing nations, the demand is growing almost
    close to their rate of economic growth
   Global consumption of energy will double between
    now and 2050
   In 2004 – the first demand let energy shortage
    occurred, causing price hikes
   Price increase in 1973, 1980 & 1990 were mainly due
    to the wars and revolution in the east
   But by 2004, with countries like China & India
    creating surplus demands for oil, ahead of
    supply, pushed demand to 3 million barrels per day
    from the estimated 1.5 million barrels per day
Petro-Dictatorship
Petro-dictatorship
 “As price of oil goes up, pace of freedom goes
  down”
 Hence, you will observe cash rich/oil rich
  countries mostly have dictators ruling
 In 2006, Russian President (now Prime Minister)
  Vladimir Putin, turned off gas supply to
  Ukraine, because the newly elected Ukrainian
  President was pro-western
 Petro-dictatorship is best seen in the Middle-
  East, Saudi Arabia, Venezuela
Climate Change
 Anthropogenic GHG like CO2 are long lived and
    stay in the atmosphere for over 1000 years
   Average global temperatures have risen by 0.8C
    than in 1750s
   11 of the last 12 warmest years (1995-2006)
    since 1850s
   A 2C rise in temperature may kill 10 million
    people
   5C rise in temperature may kill 100 million people
   Frequent hurricanes in the US like Katrina, floods
    in Bihar, droughts in sub-Saharan Africa are few
    examples
Energy Poverty
 The lack of the access to the basic energy, like
    electricity, requirements in certain parts of the
    world especially in the less developed nations
   Between 2003 and 2007 South Africa’s grid
    started to deteriorate and the early 2007 saw
    frequent blackouts
   SA imported 44590 generators in 2007 vis-`a-vis
    790 in 2003
   Businesses suffered
   Energy poverty is one of the main factors of over-
    crowding of urban areas in LDCs
Global Energy Poverty
Biodiversity Loss
 Disrupting ecosystems
 Half of the world’s tropical & temperate forests are
    gone
   Rate of deforestation is about an acre/second in
    tropics
   Half of wetlands are gone
   1/3rd of Mangroves are gone
   90% of predator fish are gone
   20% of coral are gone & 20% are threatened
   Species are disappearing 1000 times faster than
    before
   In 2006, we lost a close relative, the Yangtze River
    freshwater dolphin
   It is not the loss of a species but the loss of a genus
“We are running an uncontrolled
experiment on the only home we
have”
All these problems were increasing till we reached a
tipping point after the year 2000
Thank You

nareshsukhani@gmail.com
The Kyoto Protocol
 International agreement linked to the United
  Nations Framework Convention on Climate
  Change
 Binding targets for 37 industrialised nations and
  EU for reducing GHGs
 Protocol has 3 mechanisms
   Emissions trading
   Clean development mechanism
   Joint Implementation

Environmental management intro

  • 1.
    Environmental Management Introduction nareshsukhani@gmail.com
  • 2.
    Objective of thiscourse...  To understand the effects of the impacts of the modern human society upon the environment we live in  Issues that effect the managers involving  Networking or Politics  Business itself, the projects, or the programs  Resources like natural resources, facilities, money etc  To explore ways to reduce our environmental footprint in day to day activities
  • 3.
    What is EnvironmentalManagement  It is the management of  All the components of biological, physical and chemical in both biotic (living) and abiotic (non- living)  The interaction of social, cultural, and economic environment with the bio-physical environment.
  • 4.
    Why do weneed to study this course?  We have just one planet which can sustain life and not 9  The resources are limited  Space on earth  Non-renewable energy  Natural resources  The environment is depreciating in life sustaining capabilities at an ever increasing pace.  At this rate, the day is not far when we reach a point of no return and face the wrath of global climatic change  We need to understand our responsibility towards the environment and adopt an environment friendly system of working
  • 5.
  • 6.
    Crowded  World populationin  Year 1800 – 1 billion  Year 1922 – 2 billion  Year 2000 – 6 billion  Year 2050 – 9 billion (estimated)  The population has & will increase due to  Health care  Disease Eradication  Economic development  World population today is around 6.7 billion and will increase by 2.5 billion in 43 years – UN Population report dated 13 May 2007
  • 7.
    Crowded  The maximumgrowth will happen in the lesser developed countries as their economies grow from 5.4 billion in 2007 to 7.9 billion in 2050  Developed countries population will remain more or less stable and shall hover around 1.2 billion  Some facts  Year 1800 – London was the largest city with pop. 1 million  Year 1900 – 111 cities with pop. 1 million  Year 1995 – 300 cities with pop. 1 million  5 cities with pop. over 10 million in 1975  14 cities with pop. over 10 million in 1995  26 cities with pop. over 10 million in 2015 (estimated) – UN pop. Fund statistics  Mumbai has a pop. of over 19 million
  • 8.
    What are theeffects of Crowding  Loss of arable land  Over fishing  Water shortage  Air & water pollution  Stress on cities infrastructure  Per capita decrease in facilities like health care  By 2030 number of cities dwellers expected to rise to 5 billion – Associated Press 27/06/2007  These increases will happen more in smaller cities than in the larger ones around 45% growth in pop.  Terrorism will no longer be a problem, demographics will
  • 9.
  • 11.
  • 12.
  • 13.
    Flat  Personal computerinvented in around 1975.  By 1977 PC were being mass produced  PC enabled users to become authors of their own content  Then came the Internet, WWW & Web browser  Software and transmission protocols started flattening the world by enabling outsourcing  Geopolitical flatteners are the fall of Berlin Wall on Oct 03, 1990 & collapse of communist Soviet Union  These factors made the world seamless making the world entirely flat.
  • 14.
    Flat  200 millionpeople improved their economic conditions in 1980’s and 1990’s in China and India, raising them from poverty  10 of millions added to the middle class  This created more demand for products like cell phones, computers, gas stoves, refrigerators etc  These products created demand for raw materials and led to increase of green houses gases (GHG) either during production, usage or upon discarding
  • 17.
    Light Bulb Example In the next 12 years we shall have another 1 billion people  Now, if we give each of these people a 60 W incandescent light bulb  The weight of individual light bulb is negligible, but 1 billion light bulbs will weigh around 20000 metric tonnes  If we were to turn these light bulbs ON, all at one time for 4 hours a day, we would need 10000 MW of electricity which would need 20, 500 MW power plants. If these power plants are coal fired, imagine the amount of GHG emitted
  • 18.
    Hot  The globalaverage temperatures have increased by 0.8C vis-à-vis 1750s  It all started with the industrial revolution in late 1700s when we went from manual or horse power to machine power, from agricultural to manufacturing societies  Industrial revolution was the revolution of energy  Steam engine –converted the chemical energy of coal/wood to mechanical energy of industrial machinery  Eventually coal was started being preferred for wood as it generated twice as much energy as the same weight of food.  This slowed down deforestation
  • 19.
    Earth has afever and needs help!
  • 20.
    Hot  Coal wasused for  Industrial process  Metallurgy  Heating building  Power steam engines  Crude oil was commercially exploited in 1800s where is first replaced whale oil used for lighting lamps and then for heating, manufacturing and fuel for engines.  In short, man needed these sources of energy for  Light  Heat  Motive power, or  Electricity
  • 22.
  • 23.
    Transportation Revolution  Early20th century saw a “Transportation Revolution” - from the internal combustion engine  The first gasoline powered automobile was made in 1885  First mass produced automobile was the Old’s Mobile in 1902 by Ransom E. Olds.  It was Henry Ford in 1896 who started working on an assembly line.  The Ford’s T-Mobile which first rolled out in 1908 and by 1927 when it stopped production 18 millions cars had rolled out of the assembly line
  • 24.
    Hot  These cars,produced a lot of CO2 and required a lot of crude, iron steel & rubber which further emitted more GHG during their production.  This triggered industrialisation and which resulted in urbanisation and suburbanisation  We had now been sucked into a vicious cycle of energy dependency which produced lot of emissions and caused a lot of harm to the environment  “We build an inefficient system with great efficiency”  Soon the entire world copied America and Europe and followed the path of self destruction
  • 25.
    Fuels  Fuels fromHell  Coal  Oil  Natural gas  Fuels from Heaven  Wind  Hydro  Solar  Tidal  Biomass
  • 26.
  • 27.
    The Green HouseEffect  Without GHG the earth’s average temperature is estimated to be 15C cooler. A 5-6 C drop in temperature brings in an Ice-age  Composition of Earth’s atmosphere has remained more or less constant for over 20 million years  But in the last 100-200 years, things have changed  Concentration of CO2 for 10000 years have been 280 ppm as evident from polar ice core samples  Since, 1950’s this has increased  2007 CO2 concentration was 384ppm and climbing 2 ppm per year  Average global temperatures have increased 0.8 C
  • 28.
  • 29.
  • 30.
    Green House Gases Global green house gases emissions due to human activities have grown since pre-industrial time, with an increase of 70% between 1970 & 2004
  • 31.
    CO2 & CH4 CO2 sources  Fossil fuels, deforestation, forest fires, agriculture, large scale cattle grazing  CH4 sources  Solid waste land fills, animal defecation, coal minng, rice farming, cattle belching  CH4 is 21 times more potent in trapping heat than CO2
  • 35.
    When Hot meetsFlat and Crowded Convergence of Global Warming, Over population and Global Flattening
  • 36.
  • 37.
    Convergence of Hot,Flat and Crowded  Energy demand and supply  Petro-dictatorship  Climate change  Energy poverty  Biodiversity loss
  • 38.
    Energy Demand andSupply  Fuels from Hell are expensive, dirty, and not really abundant  The demand for fossil fuels grew by 5% per year between 1951-1970 in the developed nations  Developing nations, the demand is growing almost close to their rate of economic growth  Global consumption of energy will double between now and 2050  In 2004 – the first demand let energy shortage occurred, causing price hikes  Price increase in 1973, 1980 & 1990 were mainly due to the wars and revolution in the east  But by 2004, with countries like China & India creating surplus demands for oil, ahead of supply, pushed demand to 3 million barrels per day from the estimated 1.5 million barrels per day
  • 39.
  • 40.
    Petro-dictatorship  “As priceof oil goes up, pace of freedom goes down”  Hence, you will observe cash rich/oil rich countries mostly have dictators ruling  In 2006, Russian President (now Prime Minister) Vladimir Putin, turned off gas supply to Ukraine, because the newly elected Ukrainian President was pro-western  Petro-dictatorship is best seen in the Middle- East, Saudi Arabia, Venezuela
  • 41.
    Climate Change  AnthropogenicGHG like CO2 are long lived and stay in the atmosphere for over 1000 years  Average global temperatures have risen by 0.8C than in 1750s  11 of the last 12 warmest years (1995-2006) since 1850s  A 2C rise in temperature may kill 10 million people  5C rise in temperature may kill 100 million people  Frequent hurricanes in the US like Katrina, floods in Bihar, droughts in sub-Saharan Africa are few examples
  • 43.
    Energy Poverty  Thelack of the access to the basic energy, like electricity, requirements in certain parts of the world especially in the less developed nations  Between 2003 and 2007 South Africa’s grid started to deteriorate and the early 2007 saw frequent blackouts  SA imported 44590 generators in 2007 vis-`a-vis 790 in 2003  Businesses suffered  Energy poverty is one of the main factors of over- crowding of urban areas in LDCs
  • 44.
  • 45.
  • 48.
    Biodiversity Loss  Disruptingecosystems  Half of the world’s tropical & temperate forests are gone  Rate of deforestation is about an acre/second in tropics  Half of wetlands are gone  1/3rd of Mangroves are gone  90% of predator fish are gone  20% of coral are gone & 20% are threatened  Species are disappearing 1000 times faster than before  In 2006, we lost a close relative, the Yangtze River freshwater dolphin  It is not the loss of a species but the loss of a genus
  • 49.
    “We are runningan uncontrolled experiment on the only home we have” All these problems were increasing till we reached a tipping point after the year 2000
  • 50.
  • 51.
    The Kyoto Protocol International agreement linked to the United Nations Framework Convention on Climate Change  Binding targets for 37 industrialised nations and EU for reducing GHGs  Protocol has 3 mechanisms  Emissions trading  Clean development mechanism  Joint Implementation