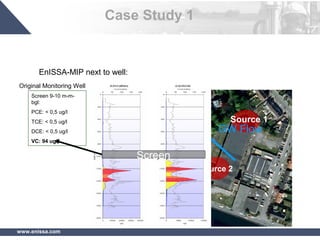
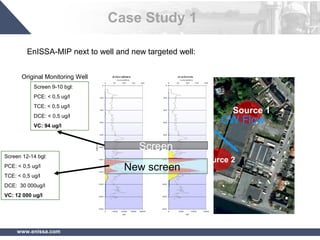
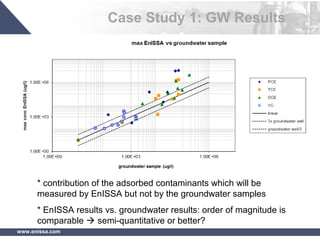
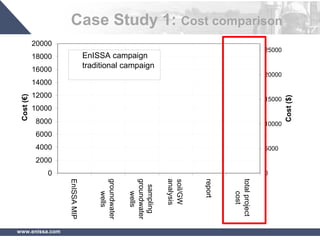
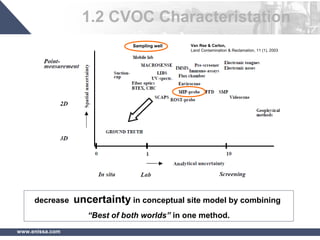
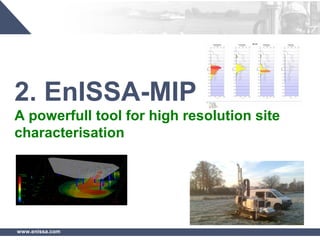
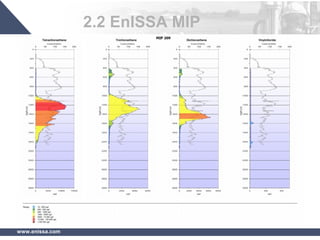
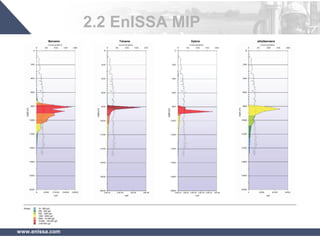
This document describes EnISSA MIP, an enhanced membrane interface probe technique that provides high resolution site characterization of chlorinated solvent contamination. EnISSA MIP combines membrane interface probing with a dedicated GC-MS for contaminant detection on a parts-per-billion level, allowing delineation of both source areas and plumes. This provides highly detailed contamination profiles with identification of individual compounds compared to conventional MIP techniques. Case studies demonstrate EnISSA MIP identified contamination missed by monitoring wells and provided data to strategically place new wells. It allows more complete conceptual site models at lower cost than traditional approaches.
![www.enissa.com
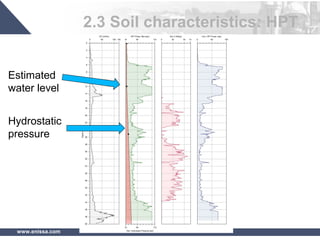
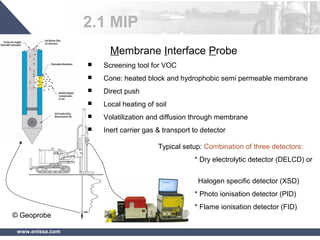
2.3 Soil characteristics: HPT
Hydraulic Profiling Tool (HPT)
• MiHPT = MIP + HPT
• Injection of continuous water flow
• injection pressure is an indication of the local permeability of the
soil.
• A real-time detailed pressure and flow log is generated for each
probing location giving more insight in hydrogeology.
• Combined with dissipation tests or groundwater level data, an
Estimated conductivity (K [m/day]) can be calculated based on an
empirical model.](https://image.slidesharecdn.com/enissa-150531131414-lva1-app6891/85/EnISSA-31-320.jpg)