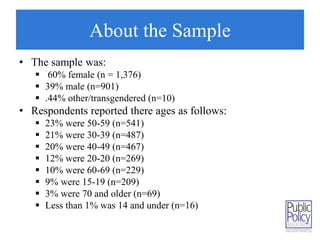
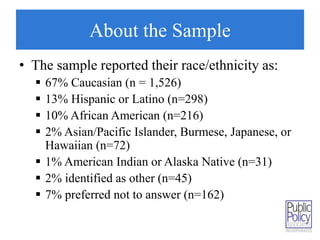
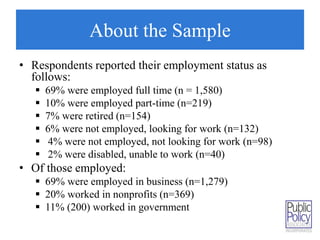
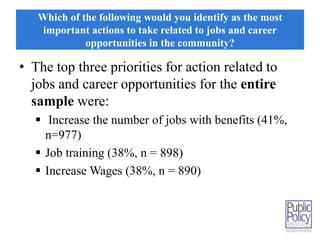
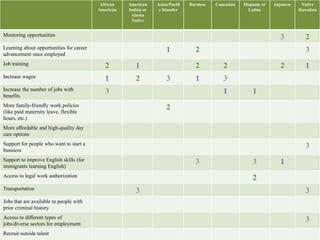
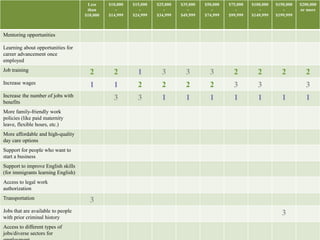
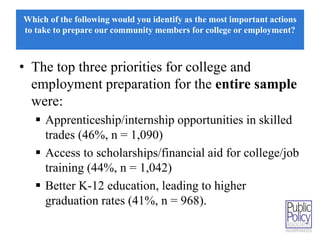
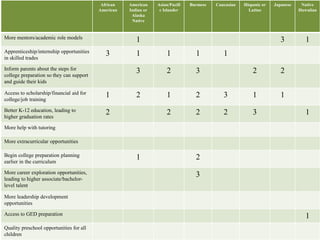
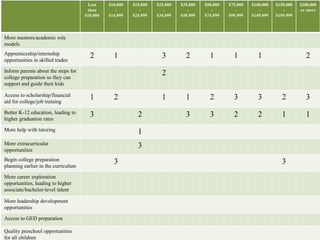
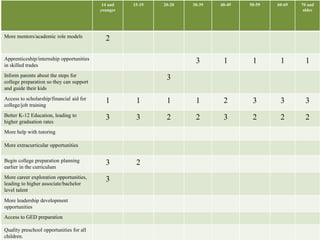
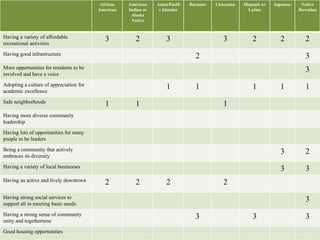
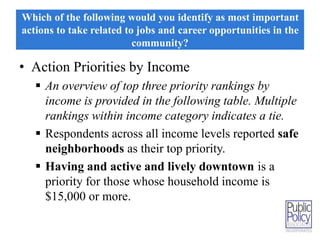
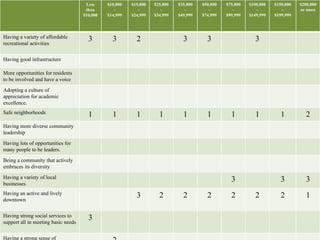
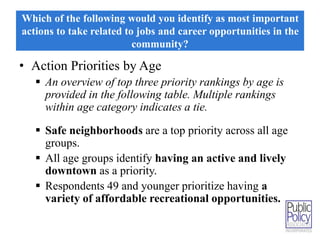
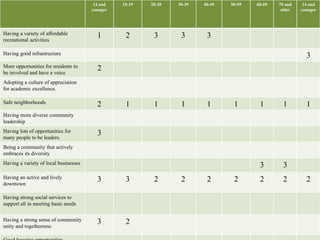
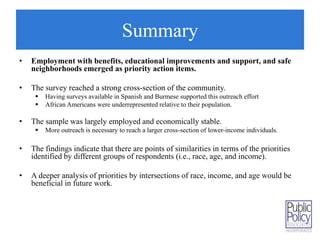
Battle Creek 
Summary of 
#BCvision Survey
Purpose 
• The purpose of this survey was to provide the 
community with an opportunity to offer their 
input on priorities for action related to 
community economic development.
About the Sample 
• The sample was: 
 60% female (n = 1,376) 
 39% male (n=901) 
 .44% other/transgendered (n=10) 
• Respondents reported there ages as follows: 
 23% were 50-59 (n=541) 
 21% were 30-39 (n=487) 
 20% were 40-49 (n=467) 
 12% were 20-20 (n=269) 
 10% were 60-69 (n=229) 
 9% were 15-19 (n=209) 
 3% were 70 and older (n=69) 
 Less than 1% was 14 and under (n=16)
About the Sample 
• The sample reported their race/ethnicity as: 
 67% Caucasian (n = 1,526) 
 13% Hispanic or Latino (n=298) 
 10% African American (n=216) 
 2% Asian/Pacific Islander, Burmese, Japanese, or 
Hawaiian (n=72) 
 1% American Indian or Alaska Native (n=31) 
 2% identified as other (n=45) 
 7% preferred not to answer (n=162)
About the Sample 
• Respondents reported their employment status as 
follows: 
 69% were employed full time (n = 1,580) 
 10% were employed part-time (n=219) 
 7% were retired (n=154) 
 6% were not employed, looking for work (n=132) 
 4% were not employed, not looking for work (n=98) 
 2% were disabled, unable to work (n=40) 
• Of those employed: 
 69% were employed in business (n=1,279) 
 20% worked in nonprofits (n=369) 
 11% (200) worked in government
About the Sample 
• The sample was made up of 50% residents of 
the City of Battle Creek (n=1,155) 
 12% lived in Kalamazoo County (n=279) 
 7% lived in Emmett Township (n=159) 
 6% lived in Pennfield Township (n=138) 
 3% lived in City of Springfield (n=66) 
 17% lived in other locations (e.g., Marshall, 
Bellevue, Lakeview, Leroy Township) (n=380)
About the Sample 
• 19% preferred not to report their household income (n=417) 
• 16% of respondents between $100,000-$149,999 (n=363) 
• 15% earn $75,000-$99,999 (n=330) 
• 14% earn $50,000-$74,999 (n=308) 
• 8% earn $35,000-$49,999 (n=185) 
• 5% earn $25,000-$34,999 (n=119) 
• 5% earn $15,000-$24,999 (n=107) 
• 5% earn $20,000 or more (n=108) 
• 4% earn $10,000 or less (n=87) 
• 3% earn $10,000-$14,999 (n=66)
Method 
• Community members received solicitations 
through the mail and online. 
• Surveys were available online and through a 
social media link. 
• Data collection was initiated on October 24 and 
closed on November 10. 
• Efforts were made to reach non-English speaking 
community members. Paper versions of the 
survey were available in Spanish (n = 252) and 
Burmese (n = 4).
COMPARISON OF SURVEY SAMPLE TO COMMUNITY AT 
LARGE
Summary 
• The racial/ethnic demographics of the survey indicated: 
 African Americans were underrepresented, while 
Hispanic/Latinos and Native Americans were overrepresented. 
 The White sample was consistent with the percentage of the 
population in Battle Creek. 
• The survey sample overrepresented those at the highest 
income levels and underrepresented those making less 
than $75,000. 
• The sample was largely middle aged and underrepresented 
younger demographic segments (Below 29 years of age)
#BC Vision 
Community 
Engagement Survey 
Battle Creek, city 
2010 Census 
Calhoun County 
2010 Census 
African-American 9.41% 18.2% 11.1% 
American 
Indian/Native Alaskan 
1.4% 0.7% 0.7% 
Asian/Pacific Islander 2.8% 2.4% 2.0% 
Caucasian 67.6% 68.6% 79.3% 
Hispanic or Latino 13.11% 6.7% 4.7% 
Other 1.96% 4.3% 3.1% 
Prefer not to answer 7.14%
#BC Vision 
Community 
Engagement Survey 
Battle Creek, city 
2010 Census 
Calhoun County 
2010 Census 
Less than $10,000 3.8% 7.9% 9.9% 
$10,000 to $14,999 2.9% 6.6% 8.5% 
$15,000 to $24,999 4.7% 15.1% 16.5% 
$25,000 to $34,999 5.2% 12.9% 13.3% 
$35,000 to $49,999 8.2% 15.7% 14.8% 
$50,000 to $74,999 13.7% 17.8% 16.2% 
$75,000 to $99,999 14.8% 10.4% 8.3% 
$100,000 to $149,999 16.3% 9.4% 7.7% 
$150,000-$199,999 6.7% 2.6% 2.6% 
$200,000 or more 4.9% 1.7% 2.1% 
Prefer not to answer 18.6% -- --
#BC Vision 
Community 
Engagement Survey 
Battle Creek, city 
2010 Census 
Calhoun County 
2010 Census 
Under 14 years 0.7% 21.7% 19.8% 
15 to 19 years 9.0% 7.1% 7.5% 
20 to 29 years 11.7% 13.0% 12.0% 
30 to 39 years 21.2% 13.1% 11.8% 
40 to 49 years 20.2% 13.0% 13.7% 
50 to 59 years 23.5% 13.4% 14.5% 
60 to 69 years 10.0% 9.0% 10.2% 
70 years or older 3.0% 9.6% 10.5% 
Prefer not to answer 0.6% -- --
WHICH OF THE FOLLOWING WOULD YOU IDENTIFY AS THE 
MOST IMPORTANT ACTIONS TO TAKE RELATED TO JOBS 
AND CAREER OPPORTUNITIES IN THE COMMUNITY?
Which of the following would you identify as the most 
important actions to take related to jobs and career 
opportunities in the community? 
• The top three priorities for action related to 
jobs and career opportunities for the entire 
sample were: 
 Increase the number of jobs with benefits (41%, 
n=977) 
 Job training (38%, n = 898) 
 Increase Wages (38%, n = 890)
Which of the following would you identify as most important 
actions to take related to jobs and career opportunities in the 
community? 
• Action Priorities by Race 
 An overview of top three priority rankings by race/ethnicity is 
provided in the following table. Multiple rankings within racial 
category indicates a tie. 
 Caucasians and Hispanic/Latinos reported the top priority 
should be increasing the number of jobs with benefits. 
 African Americans and Burmese reported increased wages as 
the top priority. 
 Both Hispanic/Latinos and Burmese included support to 
improve English skills as on of the top three priorities. 
 Overall, African-American and Caucasian respondents endorsed 
the same action priorities, although not in the same order.
African 
American 
American 
Indian or 
Alaska 
Native 
Asian/Pacifi 
c Islander 
Burmese Caucasian Hispanic or 
Latino 
Japanese Native 
Hawaiian 
Mentoring opportunities 3 2 
Learning about opportunities for career 
1 2 3 
advancement once employed 
Job training 2 1 2 2 2 1 
Increase wages 1 2 3 1 3 
Increase the number of jobs with 
3 1 1 
benefits 
More family-friendly work policies 
(like paid maternity leave, flexible 
hours, etc.) 
2 
More affordable and high-quality day 
care options 
Support for people who want to start a 
business 
3 
Support to improve English skills (for 
immigrants learning English) 
3 3 1 
Access to legal work authorization 2 
Transportation 3 3 
Jobs that are available to people with 
prior criminal history 
Access to different types of 
jobs/diverse sectors for employment 
3 
Recruit outside talent
Which of the following would you identify as the most 
important actions to take related to jobs and career 
opportunities in the community? 
• Action Priorities by Income 
 An overview of top three priority rankings by 
income is provided in the following table. Multiple 
rankings within income category indicates a tie. 
 Across the income spectrum, job training, 
increased wages, and increasing jobs with benefits 
emerged as priorities. 
 Transportation and employment for those with 
prior criminal histories also emerged as priorities 
when analyzed by income.
Less 
than 
$10,000 
$10,000 
- 
$14,999 
$15,000 
- 
$24,999 
$25,000 
- 
$34,999 
$35,000 
- 
$49,999 
$50,000 
- 
$74,999 
$75,000 
- 
$99,999 
$100,000 
- 
$149,999 
$150,000 
- 
$199,999 
$200,000 
or more 
Mentoring opportunities 
Learning about opportunities for 
career advancement once 
employed 
Job training 2 2 1 3 3 3 2 2 2 2 
Increase wages 1 1 2 2 2 2 3 3 3 
Increase the number of jobs with 
3 3 1 1 1 1 1 1 1 
benefits 
More family-friendly work 
policies (like paid maternity 
leave, flexible hours, etc.) 
More affordable and high-quality 
day care options 
Support for people who want to 
start a business 
Support to improve English skills 
(for immigrants learning English) 
Access to legal work 
authorization 
Transportation 3 
Jobs that are available to people 
with prior criminal history 
3 
Access to different types of 
jobs/diverse sectors for 
employment
Which of the following would you identify as the most 
important actions to take related to jobs and career 
opportunities in the community? 
• Action Priorities by Age 
 An overview of top three priority rankings by age 
is provided in the following table. Multiple 
rankings within age category indicates a tie. 
 Increased wages are ranked in the top 3 for every 
age group. 
 Increasing the number of jobs with benefits is a 
priority for groups aged 20-70 and older. 
 20-29 and 30-39-year-olds list family-friendly 
work policies as a top concern.
14 and 
younger 
15-19 20-20 30-39 40-49 50-59 60-69 70 and 
older 
Mentoring opportunities 
Learning about opportunities for career 
advancement once employed 
Job training 2 2 3 3 2 2 
Increase wages 1 1 1 2 1 2 3 3 
Increase the number of jobs with 
2 3 2 1 1 1 
benefits 
More family-friendly work policies 
(like paid maternity leave, flexible 
hours, etc.) 
3 1 
More affordable and high quality day 
care options 
Support for people who want to start a 
business 
3 
Support to improve English skills (for 
immigrants learning English) 
Access to legal work authorization 
Transportation 3 
Jobs that are available to people with 
prior criminal history 
Access to different types of 
3 
jobs/Diverse sectors for employment 
Recruit outside talent
WHICH OF THE FOLLOWING WOULD YOU IDENTIFY AS THE 
MOST IMPORTANT ACTIONS TO TAKE TO PREPARE OUR 
COMMUNITY MEMBERS FOR COLLEGE OR EMPLOYMENT?
Which of the following would you identify as the most important actions 
to take to prepare our community members for college or employment? 
• The top three priorities for college and 
employment preparation for the entire sample 
were: 
 Apprenticeship/internship opportunities in skilled 
trades (46%, n = 1,090) 
 Access to scholarships/financial aid for college/job 
training (44%, n = 1,042) 
 Better K-12 education, leading to higher 
graduation rates (41%, n = 968).
Which of the following would you identify as the most important actions 
to take to prepare our community members for college or employment? 
• Action Priorities by Race 
 An overview of top three priority rankings by race/ethnicity is 
provided in the following table. Multiple rankings within racial 
category indicates a tie. 
 African Americans and Hispanic/Latinos reported access to 
scholarships/financial aid for college/job training was the top 
priority. 
 Both Hispanic/Latinos and Burmese included informing 
parents about the steps for college preparation as a one of the 
top three priorities. 
 When analyzed by race, the majority of racial subgroups 
ranked better K-12 education as one of three top priorities. 
 Overall, African Americans and Caucasians endorsed the same 
action priorities, although not in the same order.
African 
American 
American 
Indian or 
Alaska 
Native 
Asian/Pacifi 
c Islander 
Burmese Caucasian Hispanic or 
Latino 
Japanese Native 
Hawaiian 
More mentors/academic role models 1 3 1 
Apprenticeship/internship opportunities 
in skilled trades 
3 1 1 1 1 
Inform parents about the steps for 
college preparation so they can support 
and guide their kids 
3 2 3 2 2 
Access to scholarship/financial aid for 
college/job training 
1 2 1 2 3 1 1 
Better K-12 education, leading to 
higher graduation rates 
2 2 2 2 3 1 
More help with tutoring 
More extracurricular opportunities 
Begin college preparation planning 
earlier in the curriculum 
1 2 
More career exploration opportunities, 
leading to higher associate/bachelor-level 
talent 
3 
More leadership development 
opportunities 
Access to GED preparation 1 
Quality preschool opportunities for all 
children
Which of the following would you identify as the most 
important actions to take related to jobs and career 
opportunities in the community? 
• Action Priorities by Income 
 An overview of top three priority rankings by 
income is provided in the following table. Multiple 
rankings within income category indicates a tie. 
 Opportunities for apprenticeships, improving 
education, and scholarships were important across 
the income spectrum.
Less 
than 
$10,000 
$10,000 
- 
$14,999 
$15,000 
- 
$24,999 
$25,000 
- 
$34,999 
$35,000 
- 
$49,999 
$50,000 
- 
$74,999 
$75,000 
- 
$99,999 
$100,000 
- 
$149,999 
$150,000 
- 
$199,999 
$200,000 
or more 
More mentors/academic role 
models 
Apprenticeship/internship 
opportunities in skilled trades 
2 1 3 2 1 1 1 2 
Inform parents about the steps for 
college preparation so they can 
support and guide their kids 
2 
Access to scholarship/financial 
aid for college/job training 
1 2 1 1 2 3 3 2 3 
Better K-12 education, leading to 
higher graduation rates 
3 2 3 3 2 2 1 1 
More help with tutoring 1 
More extracurricular 
opportunities 
3 
Begin college preparation 
planning earlier in the curriculum 
3 3 
More career exploration 
opportunities, leading to higher 
associate/bachelor-level talent 
More leadership development 
opportunities 
Access to GED preparation 
Quality preschool opportunities 
for all children
Which of the following would you identify as the most 
important actions to take related to jobs and career 
opportunities in the community? 
• Action Priorities by Age 
 An overview of top three priority rankings by age 
is provided in the following table. Multiple 
rankings within age category indicates a tie. 
 Access to scholarship/financial aid and better K- 
12 education are listed as priorities across all age 
groups. 
 Those who identify in age groups between 40-70 
and older rank apprenticeship and internship 
opportunities as a priority.
14 and 
younger 
15-19 20-20 30-39 40-49 50-59 60-69 70 and 
older 
More mentors/academic role models 2 
Apprenticeship/internship opportunities 
in skilled trades 
3 1 1 1 1 
Inform parents about the steps for 
college preparation so they can support 
and guide their kids 
3 
Access to scholarship/financial aid for 
college/job training 
1 1 1 1 2 3 3 3 
Better K-12 Education, leading to 
higher graduation rates 
3 3 2 2 3 2 2 2 
More help with tutoring 
More extracurricular opportunities 
Begin college preparation planning 
earlier in the curriculum 
3 2 
More career exploration opportunities, 
leading to higher associate/bachelor 
level talent 
3 
More leadership development 
opportunities 
Access to GED preparation 
Quality preschool opportunities for all 
children.
WHAT IS MOST IMPORTANT FOR BATTLE CREEK TO 
BE A THRIVING CITY WHERE PEOPLE WANT TO LIVE, 
WORK, AND PLAY?
What is MOST important for Battle Creek to be a thriving city 
where people want to live, work, and play? 
• The top three priorities for Battle Creek to be a 
thriving community for the entire sample 
were: 
 Safe neighborhoods (61%, n = 1,423). 
 Having an active and lively downtown (44%, n = 
1,046). 
 Having a variety of affordable recreational 
activities (34%, n = 800).
What is MOST important for Battle Creek to be a thriving city 
where people want to live, work, and play? 
• Action Priorities by Race 
 An overview of top three priority rankings by race/ethnicity 
is provided in the following table. Multiple rankings within 
racial category indicates a tie. 
 African Americans and Caucasians reported that safe 
neighborhoods should be the top priority. 
 African Americans and Caucasians reported that having a 
lively downtown should be the second priority. 
 Both Hispanic/Latinos and Burmese subgroups prioritized 
having a strong sense of community togetherness.
African 
American 
American 
Indian or 
Alaska 
Native 
Asian/Pacifi 
c Islander 
Burmese Caucasian Hispanic or 
Latino 
Japanese Native 
Hawaiian 
Having a variety of affordable 
recreational activities 
3 2 3 3 2 2 2 
Having good infrastructure 2 3 
More opportunities for residents to be 
involved and have a voice 
3 
Adopting a culture of appreciation for 
academic excellence 
1 1 1 1 1 
Safe neighborhoods 1 1 1 
Having more diverse community 
leadership 
Having lots of opportunities for many 
people to be leaders 
Being a community that actively 
embraces its diversity 
3 2 
Having a variety of local businesses 3 3 
Having an active and lively downtown 2 2 2 2 
Having strong social services to 
support all in meeting basic needs 
3 
Having a strong sense of community 
unity and togetherness 
3 3 3 
Good housing opportunities
Which of the following would you identify as most important 
actions to take related to jobs and career opportunities in the 
community? 
• Action Priorities by Income 
 An overview of top three priority rankings by 
income is provided in the following table. Multiple 
rankings within income category indicates a tie. 
 Respondents across all income levels reported safe 
neighborhoods as their top priority. 
 Having and active and lively downtown is a 
priority for those whose household income is 
$15,000 or more.
Less 
than 
$10,000 
$10,000 
- 
$14,999 
$15,000 
- 
$24,999 
$25,000 
- 
$34,999 
$35,000 
- 
$49,999 
$50,000 
- 
$74,999 
$75,000 
- 
$99,999 
$100,000 
- 
$149,999 
$150,000 
- 
$199,999 
$200,000 
or more 
Having a variety of affordable 
recreational activities 
3 3 2 3 3 3 
Having good infrastructure 
More opportunities for residents 
to be involved and have a voice 
Adopting a culture of 
appreciation for academic 
excellence. 
Safe neighborhoods 1 1 1 1 1 1 1 1 1 2 
Having more diverse community 
leadership 
Having lots of opportunities for 
many people to be leaders. 
Being a community that actively 
embraces its diversity 
Having a variety of local 
businesses 
3 3 3 
Having an active and lively 
downtown 
3 2 2 2 2 2 2 1 
Having strong social services to 
support all in meeting basic needs 
3 
Having a strong sense of 
2
Which of the following would you identify as most important 
actions to take related to jobs and career opportunities in the 
community? 
• Action Priorities by Age 
 An overview of top three priority rankings by age is 
provided in the following table. Multiple rankings 
within age category indicates a tie. 
 Safe neighborhoods are a top priority across all age 
groups. 
 All age groups identify having an active and lively 
downtown as a priority. 
 Respondents 49 and younger prioritize having a 
variety of affordable recreational opportunities.
14 and 
younger 
15-19 20-20 30-39 40-49 50-59 60-69 70 and 
older 
14 and 
younger 
Having a variety of affordable 
recreational activities 
1 2 3 3 3 
Having good infrastructure 3 
More opportunities for residents to 
2 
be involved and have a voice 
Adopting a culture of appreciation 
for academic excellence. 
Safe neighborhoods 2 1 1 1 1 1 1 1 1 
Having more diverse community 
leadership 
Having lots of opportunities for 
3 
many people to be leaders. 
Being a community that actively 
embraces its diversity 
Having a variety of local businesses 3 3 
Having an active and lively 
downtown 
3 3 2 2 2 2 2 2 2 
Having strong social services to 
support all in meeting basic needs 
Having a strong sense of community 
unity and togetherness 
3 2 
Good housing opportunities
Summary 
• Employment with benefits, educational improvements and support, and safe 
neighborhoods emerged as priority action items. 
• The survey reached a strong cross-section of the community. 
 Having surveys available in Spanish and Burmese supported this outreach effort 
 African Americans were underrepresented relative to their population. 
• The sample was largely employed and economically stable. 
 More outreach is necessary to reach a larger cross-section of lower-income individuals. 
• The findings indicate that there are points of similarities in terms of the priorities 
identified by different groups of respondents (i.e., race, age, and income). 
• A deeper analysis of priorities by intersections of race, income, and age would be 
beneficial in future work.
119 Pere Marquette, Suite 1C 
Lansing, MI 48912-1270 
(517) 485-4477 
Fax (517) 485-4488 
www.publicpolicy.com

BCEngagement survey summary

  • 1.
    Battle Creek Summaryof #BCvision Survey
  • 2.
    Purpose • Thepurpose of this survey was to provide the community with an opportunity to offer their input on priorities for action related to community economic development.
  • 3.
    About the Sample • The sample was:  60% female (n = 1,376)  39% male (n=901)  .44% other/transgendered (n=10) • Respondents reported there ages as follows:  23% were 50-59 (n=541)  21% were 30-39 (n=487)  20% were 40-49 (n=467)  12% were 20-20 (n=269)  10% were 60-69 (n=229)  9% were 15-19 (n=209)  3% were 70 and older (n=69)  Less than 1% was 14 and under (n=16)
  • 4.
    About the Sample • The sample reported their race/ethnicity as:  67% Caucasian (n = 1,526)  13% Hispanic or Latino (n=298)  10% African American (n=216)  2% Asian/Pacific Islander, Burmese, Japanese, or Hawaiian (n=72)  1% American Indian or Alaska Native (n=31)  2% identified as other (n=45)  7% preferred not to answer (n=162)
  • 5.
    About the Sample • Respondents reported their employment status as follows:  69% were employed full time (n = 1,580)  10% were employed part-time (n=219)  7% were retired (n=154)  6% were not employed, looking for work (n=132)  4% were not employed, not looking for work (n=98)  2% were disabled, unable to work (n=40) • Of those employed:  69% were employed in business (n=1,279)  20% worked in nonprofits (n=369)  11% (200) worked in government
  • 6.
    About the Sample • The sample was made up of 50% residents of the City of Battle Creek (n=1,155)  12% lived in Kalamazoo County (n=279)  7% lived in Emmett Township (n=159)  6% lived in Pennfield Township (n=138)  3% lived in City of Springfield (n=66)  17% lived in other locations (e.g., Marshall, Bellevue, Lakeview, Leroy Township) (n=380)
  • 7.
    About the Sample • 19% preferred not to report their household income (n=417) • 16% of respondents between $100,000-$149,999 (n=363) • 15% earn $75,000-$99,999 (n=330) • 14% earn $50,000-$74,999 (n=308) • 8% earn $35,000-$49,999 (n=185) • 5% earn $25,000-$34,999 (n=119) • 5% earn $15,000-$24,999 (n=107) • 5% earn $20,000 or more (n=108) • 4% earn $10,000 or less (n=87) • 3% earn $10,000-$14,999 (n=66)
  • 8.
    Method • Communitymembers received solicitations through the mail and online. • Surveys were available online and through a social media link. • Data collection was initiated on October 24 and closed on November 10. • Efforts were made to reach non-English speaking community members. Paper versions of the survey were available in Spanish (n = 252) and Burmese (n = 4).
  • 9.
    COMPARISON OF SURVEYSAMPLE TO COMMUNITY AT LARGE
  • 10.
    Summary • Theracial/ethnic demographics of the survey indicated:  African Americans were underrepresented, while Hispanic/Latinos and Native Americans were overrepresented.  The White sample was consistent with the percentage of the population in Battle Creek. • The survey sample overrepresented those at the highest income levels and underrepresented those making less than $75,000. • The sample was largely middle aged and underrepresented younger demographic segments (Below 29 years of age)
  • 11.
    #BC Vision Community Engagement Survey Battle Creek, city 2010 Census Calhoun County 2010 Census African-American 9.41% 18.2% 11.1% American Indian/Native Alaskan 1.4% 0.7% 0.7% Asian/Pacific Islander 2.8% 2.4% 2.0% Caucasian 67.6% 68.6% 79.3% Hispanic or Latino 13.11% 6.7% 4.7% Other 1.96% 4.3% 3.1% Prefer not to answer 7.14%
  • 12.
    #BC Vision Community Engagement Survey Battle Creek, city 2010 Census Calhoun County 2010 Census Less than $10,000 3.8% 7.9% 9.9% $10,000 to $14,999 2.9% 6.6% 8.5% $15,000 to $24,999 4.7% 15.1% 16.5% $25,000 to $34,999 5.2% 12.9% 13.3% $35,000 to $49,999 8.2% 15.7% 14.8% $50,000 to $74,999 13.7% 17.8% 16.2% $75,000 to $99,999 14.8% 10.4% 8.3% $100,000 to $149,999 16.3% 9.4% 7.7% $150,000-$199,999 6.7% 2.6% 2.6% $200,000 or more 4.9% 1.7% 2.1% Prefer not to answer 18.6% -- --
  • 13.
    #BC Vision Community Engagement Survey Battle Creek, city 2010 Census Calhoun County 2010 Census Under 14 years 0.7% 21.7% 19.8% 15 to 19 years 9.0% 7.1% 7.5% 20 to 29 years 11.7% 13.0% 12.0% 30 to 39 years 21.2% 13.1% 11.8% 40 to 49 years 20.2% 13.0% 13.7% 50 to 59 years 23.5% 13.4% 14.5% 60 to 69 years 10.0% 9.0% 10.2% 70 years or older 3.0% 9.6% 10.5% Prefer not to answer 0.6% -- --
  • 14.
    WHICH OF THEFOLLOWING WOULD YOU IDENTIFY AS THE MOST IMPORTANT ACTIONS TO TAKE RELATED TO JOBS AND CAREER OPPORTUNITIES IN THE COMMUNITY?
  • 15.
    Which of thefollowing would you identify as the most important actions to take related to jobs and career opportunities in the community? • The top three priorities for action related to jobs and career opportunities for the entire sample were:  Increase the number of jobs with benefits (41%, n=977)  Job training (38%, n = 898)  Increase Wages (38%, n = 890)
  • 16.
    Which of thefollowing would you identify as most important actions to take related to jobs and career opportunities in the community? • Action Priorities by Race  An overview of top three priority rankings by race/ethnicity is provided in the following table. Multiple rankings within racial category indicates a tie.  Caucasians and Hispanic/Latinos reported the top priority should be increasing the number of jobs with benefits.  African Americans and Burmese reported increased wages as the top priority.  Both Hispanic/Latinos and Burmese included support to improve English skills as on of the top three priorities.  Overall, African-American and Caucasian respondents endorsed the same action priorities, although not in the same order.
  • 17.
    African American American Indian or Alaska Native Asian/Pacifi c Islander Burmese Caucasian Hispanic or Latino Japanese Native Hawaiian Mentoring opportunities 3 2 Learning about opportunities for career 1 2 3 advancement once employed Job training 2 1 2 2 2 1 Increase wages 1 2 3 1 3 Increase the number of jobs with 3 1 1 benefits More family-friendly work policies (like paid maternity leave, flexible hours, etc.) 2 More affordable and high-quality day care options Support for people who want to start a business 3 Support to improve English skills (for immigrants learning English) 3 3 1 Access to legal work authorization 2 Transportation 3 3 Jobs that are available to people with prior criminal history Access to different types of jobs/diverse sectors for employment 3 Recruit outside talent
  • 18.
    Which of thefollowing would you identify as the most important actions to take related to jobs and career opportunities in the community? • Action Priorities by Income  An overview of top three priority rankings by income is provided in the following table. Multiple rankings within income category indicates a tie.  Across the income spectrum, job training, increased wages, and increasing jobs with benefits emerged as priorities.  Transportation and employment for those with prior criminal histories also emerged as priorities when analyzed by income.
  • 19.
    Less than $10,000 $10,000 - $14,999 $15,000 - $24,999 $25,000 - $34,999 $35,000 - $49,999 $50,000 - $74,999 $75,000 - $99,999 $100,000 - $149,999 $150,000 - $199,999 $200,000 or more Mentoring opportunities Learning about opportunities for career advancement once employed Job training 2 2 1 3 3 3 2 2 2 2 Increase wages 1 1 2 2 2 2 3 3 3 Increase the number of jobs with 3 3 1 1 1 1 1 1 1 benefits More family-friendly work policies (like paid maternity leave, flexible hours, etc.) More affordable and high-quality day care options Support for people who want to start a business Support to improve English skills (for immigrants learning English) Access to legal work authorization Transportation 3 Jobs that are available to people with prior criminal history 3 Access to different types of jobs/diverse sectors for employment
  • 20.
    Which of thefollowing would you identify as the most important actions to take related to jobs and career opportunities in the community? • Action Priorities by Age  An overview of top three priority rankings by age is provided in the following table. Multiple rankings within age category indicates a tie.  Increased wages are ranked in the top 3 for every age group.  Increasing the number of jobs with benefits is a priority for groups aged 20-70 and older.  20-29 and 30-39-year-olds list family-friendly work policies as a top concern.
  • 21.
    14 and younger 15-19 20-20 30-39 40-49 50-59 60-69 70 and older Mentoring opportunities Learning about opportunities for career advancement once employed Job training 2 2 3 3 2 2 Increase wages 1 1 1 2 1 2 3 3 Increase the number of jobs with 2 3 2 1 1 1 benefits More family-friendly work policies (like paid maternity leave, flexible hours, etc.) 3 1 More affordable and high quality day care options Support for people who want to start a business 3 Support to improve English skills (for immigrants learning English) Access to legal work authorization Transportation 3 Jobs that are available to people with prior criminal history Access to different types of 3 jobs/Diverse sectors for employment Recruit outside talent
  • 22.
    WHICH OF THEFOLLOWING WOULD YOU IDENTIFY AS THE MOST IMPORTANT ACTIONS TO TAKE TO PREPARE OUR COMMUNITY MEMBERS FOR COLLEGE OR EMPLOYMENT?
  • 23.
    Which of thefollowing would you identify as the most important actions to take to prepare our community members for college or employment? • The top three priorities for college and employment preparation for the entire sample were:  Apprenticeship/internship opportunities in skilled trades (46%, n = 1,090)  Access to scholarships/financial aid for college/job training (44%, n = 1,042)  Better K-12 education, leading to higher graduation rates (41%, n = 968).
  • 24.
    Which of thefollowing would you identify as the most important actions to take to prepare our community members for college or employment? • Action Priorities by Race  An overview of top three priority rankings by race/ethnicity is provided in the following table. Multiple rankings within racial category indicates a tie.  African Americans and Hispanic/Latinos reported access to scholarships/financial aid for college/job training was the top priority.  Both Hispanic/Latinos and Burmese included informing parents about the steps for college preparation as a one of the top three priorities.  When analyzed by race, the majority of racial subgroups ranked better K-12 education as one of three top priorities.  Overall, African Americans and Caucasians endorsed the same action priorities, although not in the same order.
  • 25.
    African American American Indian or Alaska Native Asian/Pacifi c Islander Burmese Caucasian Hispanic or Latino Japanese Native Hawaiian More mentors/academic role models 1 3 1 Apprenticeship/internship opportunities in skilled trades 3 1 1 1 1 Inform parents about the steps for college preparation so they can support and guide their kids 3 2 3 2 2 Access to scholarship/financial aid for college/job training 1 2 1 2 3 1 1 Better K-12 education, leading to higher graduation rates 2 2 2 2 3 1 More help with tutoring More extracurricular opportunities Begin college preparation planning earlier in the curriculum 1 2 More career exploration opportunities, leading to higher associate/bachelor-level talent 3 More leadership development opportunities Access to GED preparation 1 Quality preschool opportunities for all children
  • 26.
    Which of thefollowing would you identify as the most important actions to take related to jobs and career opportunities in the community? • Action Priorities by Income  An overview of top three priority rankings by income is provided in the following table. Multiple rankings within income category indicates a tie.  Opportunities for apprenticeships, improving education, and scholarships were important across the income spectrum.
  • 27.
    Less than $10,000 $10,000 - $14,999 $15,000 - $24,999 $25,000 - $34,999 $35,000 - $49,999 $50,000 - $74,999 $75,000 - $99,999 $100,000 - $149,999 $150,000 - $199,999 $200,000 or more More mentors/academic role models Apprenticeship/internship opportunities in skilled trades 2 1 3 2 1 1 1 2 Inform parents about the steps for college preparation so they can support and guide their kids 2 Access to scholarship/financial aid for college/job training 1 2 1 1 2 3 3 2 3 Better K-12 education, leading to higher graduation rates 3 2 3 3 2 2 1 1 More help with tutoring 1 More extracurricular opportunities 3 Begin college preparation planning earlier in the curriculum 3 3 More career exploration opportunities, leading to higher associate/bachelor-level talent More leadership development opportunities Access to GED preparation Quality preschool opportunities for all children
  • 28.
    Which of thefollowing would you identify as the most important actions to take related to jobs and career opportunities in the community? • Action Priorities by Age  An overview of top three priority rankings by age is provided in the following table. Multiple rankings within age category indicates a tie.  Access to scholarship/financial aid and better K- 12 education are listed as priorities across all age groups.  Those who identify in age groups between 40-70 and older rank apprenticeship and internship opportunities as a priority.
  • 29.
    14 and younger 15-19 20-20 30-39 40-49 50-59 60-69 70 and older More mentors/academic role models 2 Apprenticeship/internship opportunities in skilled trades 3 1 1 1 1 Inform parents about the steps for college preparation so they can support and guide their kids 3 Access to scholarship/financial aid for college/job training 1 1 1 1 2 3 3 3 Better K-12 Education, leading to higher graduation rates 3 3 2 2 3 2 2 2 More help with tutoring More extracurricular opportunities Begin college preparation planning earlier in the curriculum 3 2 More career exploration opportunities, leading to higher associate/bachelor level talent 3 More leadership development opportunities Access to GED preparation Quality preschool opportunities for all children.
  • 30.
    WHAT IS MOSTIMPORTANT FOR BATTLE CREEK TO BE A THRIVING CITY WHERE PEOPLE WANT TO LIVE, WORK, AND PLAY?
  • 31.
    What is MOSTimportant for Battle Creek to be a thriving city where people want to live, work, and play? • The top three priorities for Battle Creek to be a thriving community for the entire sample were:  Safe neighborhoods (61%, n = 1,423).  Having an active and lively downtown (44%, n = 1,046).  Having a variety of affordable recreational activities (34%, n = 800).
  • 32.
    What is MOSTimportant for Battle Creek to be a thriving city where people want to live, work, and play? • Action Priorities by Race  An overview of top three priority rankings by race/ethnicity is provided in the following table. Multiple rankings within racial category indicates a tie.  African Americans and Caucasians reported that safe neighborhoods should be the top priority.  African Americans and Caucasians reported that having a lively downtown should be the second priority.  Both Hispanic/Latinos and Burmese subgroups prioritized having a strong sense of community togetherness.
  • 33.
    African American American Indian or Alaska Native Asian/Pacifi c Islander Burmese Caucasian Hispanic or Latino Japanese Native Hawaiian Having a variety of affordable recreational activities 3 2 3 3 2 2 2 Having good infrastructure 2 3 More opportunities for residents to be involved and have a voice 3 Adopting a culture of appreciation for academic excellence 1 1 1 1 1 Safe neighborhoods 1 1 1 Having more diverse community leadership Having lots of opportunities for many people to be leaders Being a community that actively embraces its diversity 3 2 Having a variety of local businesses 3 3 Having an active and lively downtown 2 2 2 2 Having strong social services to support all in meeting basic needs 3 Having a strong sense of community unity and togetherness 3 3 3 Good housing opportunities
  • 34.
    Which of thefollowing would you identify as most important actions to take related to jobs and career opportunities in the community? • Action Priorities by Income  An overview of top three priority rankings by income is provided in the following table. Multiple rankings within income category indicates a tie.  Respondents across all income levels reported safe neighborhoods as their top priority.  Having and active and lively downtown is a priority for those whose household income is $15,000 or more.
  • 35.
    Less than $10,000 $10,000 - $14,999 $15,000 - $24,999 $25,000 - $34,999 $35,000 - $49,999 $50,000 - $74,999 $75,000 - $99,999 $100,000 - $149,999 $150,000 - $199,999 $200,000 or more Having a variety of affordable recreational activities 3 3 2 3 3 3 Having good infrastructure More opportunities for residents to be involved and have a voice Adopting a culture of appreciation for academic excellence. Safe neighborhoods 1 1 1 1 1 1 1 1 1 2 Having more diverse community leadership Having lots of opportunities for many people to be leaders. Being a community that actively embraces its diversity Having a variety of local businesses 3 3 3 Having an active and lively downtown 3 2 2 2 2 2 2 1 Having strong social services to support all in meeting basic needs 3 Having a strong sense of 2
  • 36.
    Which of thefollowing would you identify as most important actions to take related to jobs and career opportunities in the community? • Action Priorities by Age  An overview of top three priority rankings by age is provided in the following table. Multiple rankings within age category indicates a tie.  Safe neighborhoods are a top priority across all age groups.  All age groups identify having an active and lively downtown as a priority.  Respondents 49 and younger prioritize having a variety of affordable recreational opportunities.
  • 37.
    14 and younger 15-19 20-20 30-39 40-49 50-59 60-69 70 and older 14 and younger Having a variety of affordable recreational activities 1 2 3 3 3 Having good infrastructure 3 More opportunities for residents to 2 be involved and have a voice Adopting a culture of appreciation for academic excellence. Safe neighborhoods 2 1 1 1 1 1 1 1 1 Having more diverse community leadership Having lots of opportunities for 3 many people to be leaders. Being a community that actively embraces its diversity Having a variety of local businesses 3 3 Having an active and lively downtown 3 3 2 2 2 2 2 2 2 Having strong social services to support all in meeting basic needs Having a strong sense of community unity and togetherness 3 2 Good housing opportunities
  • 38.
    Summary • Employmentwith benefits, educational improvements and support, and safe neighborhoods emerged as priority action items. • The survey reached a strong cross-section of the community.  Having surveys available in Spanish and Burmese supported this outreach effort  African Americans were underrepresented relative to their population. • The sample was largely employed and economically stable.  More outreach is necessary to reach a larger cross-section of lower-income individuals. • The findings indicate that there are points of similarities in terms of the priorities identified by different groups of respondents (i.e., race, age, and income). • A deeper analysis of priorities by intersections of race, income, and age would be beneficial in future work.
  • 39.
    119 Pere Marquette,Suite 1C Lansing, MI 48912-1270 (517) 485-4477 Fax (517) 485-4488 www.publicpolicy.com