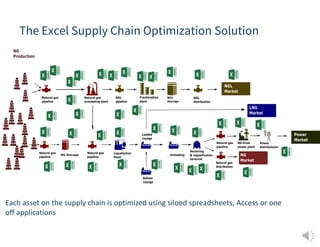
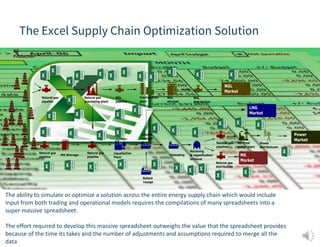
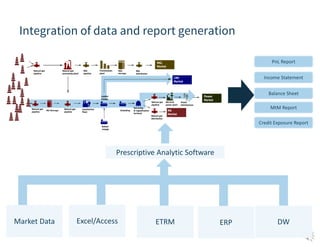
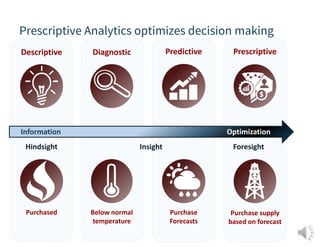
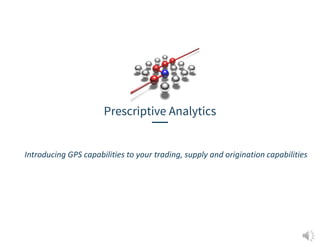
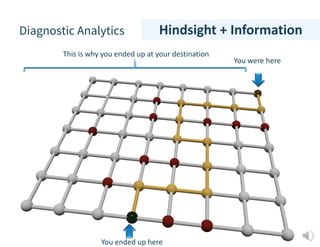
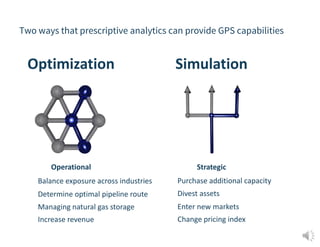
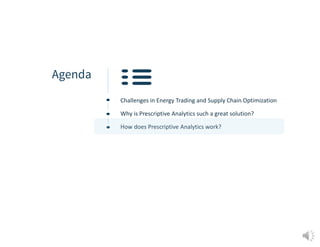
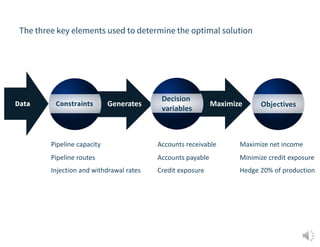
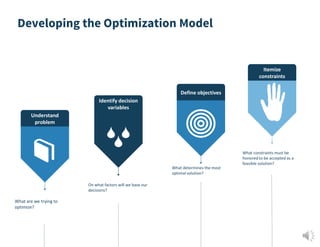
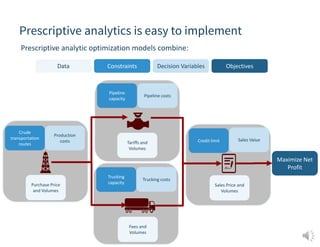
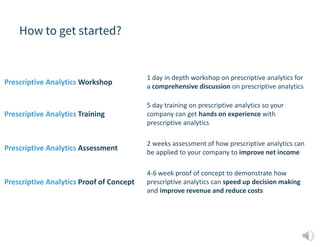
This presentation discusses how prescriptive analytics can help energy traders, originators, portfolio managers and risk managers make faster, accurate decisions in the most complex scenarios
Managing uncertainty in ai performance target settingNoelle Ibrahim
This document discusses methods for setting performance targets and evaluating uncertainty for AI models. It recommends using Monte Carlo simulations to project how different levels of accuracy would impact product performance before developing complex algorithms. This allows determining if baseline accuracy from simple models is sufficient or if higher accuracy targets are needed. Simulations can also estimate if gathering more data would significantly improve performance. Calibration of confidence scores is important for applications requiring per-instance decisions or risk assessments.
InnerWorkings is a large publicly traded company that provides outsourced print procurement and marketing execution services. It has over 700 employees worldwide, 4,700+ clients including 50 Fortune 500 companies, and revenues of around $500 million. InnerWorkings analyzes clients' historical print and marketing spending data to identify savings opportunities through leveraging their large supplier network and procurement expertise.
The document discusses technical content management for complex capital equipment, which involves maintaining accurate parts books, service manuals, and ERP master data for maintenance and supply chain functions. It argues that current "good enough" practices for technical content management are inefficient and costly, leading to inflated inventories, wasted staff time searching for information, and high administrative overheads. The solution presented is an automated technical content management system that links updated content to ERP systems, provides reliable inventory and obsolete parts reporting, and outsources administrative tasks to reduce on-going costs.
Making Advanced Analytics Work for You by Dominic Barton and David CourtKASHISH MUKHEJA
This is a presentation on the article Making Advanced Analytics Work for You by Dominic Barton and David Court.I have made the presentation as a task on my data analytics internship by Prof. Sameer Mathur.
A unique opportunity exists to build a planning platform using forecasting, optimization, and machine learning algorithms to support marketing, operations, and pricing strategies. Currently, there is little data integration across workstreams to accurately assess how each area's actions impact others. The proposed platform would combine all company data, enable forecasting of trends under strategic decisions, find optimal decisions within and across workstreams, and provide interactive analytics - all on a cloud-based data platform for fast, contextual decision-making.
This presentation introduces big data and explains how to generate actionable insights using analytics techniques. The deck explains general steps involved in a typical analytics project and provides a brief overview of the most commonly used predictive analytics methods and their business applications.
Integrating A.I. and Machine Learning with your Demand ForecastSteve Sager
This document provides an overview of Demand Guru, a demand forecasting and predictive analytics solution. Some key points:
- Demand Guru uses machine learning and external data sources to model demand, account for causal factors, and test scenarios. This improves upon traditional statistical forecasting.
- It incorporates over 550,000 external time series datasets on topics like weather, economic, market and other data. This allows for better understanding of demand drivers.
- The solution can model "what if" scenarios to understand how changes might impact demand and make more confident decisions. This is done in a risk-free virtual environment.
- Demand Guru is presented as augmenting rather than replacing existing demand
Simon Harrison gave a presentation on the analytics lifecycle. He discussed descriptive, diagnostic, predictive, and prescriptive analytics. Descriptive analytics explains what happened, diagnostic identifies why outcomes occurred, predictive determines what will happen, and prescriptive optimizes outcomes subject to constraints. Harrison explained how each stage helps businesses and provided examples of analytics products that can be used. He also discussed how analytics impacts accounting skills and how organizations can approach their analytics journey.
Hub16: Motorola: Identifying cross-sell and up-sell opportunitiesAnaplan
Data is the new oil. Businesses are overwhelmed by the volume, velocity, and variety of new data about their market, customers, and competitors. Converting this massive data into “actionable insights” for sales and marketing teams is a major challenge faced by many B2B and B2C companies. For example, many market-changing companies have algorithms to predict who, when, and how customers will make a purchase (think Amazon's and Netflix’s recommendation engine). They have predictive/ prescriptive models and algorithms that assist their sales and marketing teams through the customer buying process. They are also coming up with innovative ways to monetize their data assets and increase revenue. In this session, you will learn how B2B companies, such as Motorola, are using Big Data and historical customer purchases to assist sales and marketing efforts. We will walk you through one use case of generating sales insights, up-sell, and cross-sell opportunities using Anaplan models.
This document discusses best practices for working in the gig economy as an independent contractor on data and analytics projects. It recommends finding the right fit between contractor skills and project needs, committing to an agile or waterfall project management approach, setting quantitative goals, creating extensible code and documentation, and over-communicating through frequent updates rather than relying on emails. The document concludes with case studies comparing two different broadcaster clients' projects that illustrates these principles in action and contrasts their outcomes.
7 reasons to upgrade your spreadsheets to a true planning platformAnaplan
Here are seven reasons to upgrade from spreadsheets for your planning, budgeting, and forecasting.
Learn more by visiting www.anaplan.com
Like Anaplan on Facebook: https://www.facebook.com/anaplan
Follow Anaplan on Twitter: https://twitter.com/anaplan
Follow Anaplan on LinkedIn: https://www.linkedin.com/company/anaplan
Like Anaplan on Google+: https://plus.google.com/+AnaplanInc/posts
Follow Anaplan on our YouTube channel: http://www.youtube.com/c/AnaplanInc
- QlikTech is a business intelligence company founded in 1993 that produces the QlikView software. It has over 10,500 customers in 92 countries and 700+ partners.
- QlikView is a business intelligence tool that offers dashboards, analysis, and reporting in one program. It allows for fast deployment and low costs compared to traditional BI solutions.
- QlikView has received accolades for being easy for business users to build solutions with and for providing high customer satisfaction through its interactive and performant platform.
- QlikTech is a business intelligence company founded in 1993 that produces the QlikView software. It has over 10,500 customers in 92 countries and 700+ partners.
- QlikView is a business intelligence tool that offers dashboards, analysis, and reporting in one program. It allows for fast deployment and low costs compared to traditional BI solutions.
- QlikView has received accolades for being easy for business users to build solutions with minimal IT help and for consistently high customer satisfaction and value.
- QlikTech is a business intelligence company founded in 1993 that produces the QlikView software. It has over 10,500 customers in 92 countries and 700+ partners.
- QlikView is a business intelligence tool that offers dashboards, analysis, and reporting in one program. It allows for fast deployment and low costs compared to traditional BI solutions.
- QlikView has received accolades for being easy for business users to build solutions with and for providing high customer satisfaction through its interactive and performant platform.
- QlikTech is a business intelligence company founded in 1993 that produces the QlikView software. It has over 10,500 customers in 92 countries and 700+ partners.
- QlikView is a business intelligence tool that offers dashboards, analysis, and reporting in one program. It allows for fast deployment and low costs compared to traditional BI solutions.
- QlikView has received accolades for being easy for business users to build solutions with and for providing high customer satisfaction through its interactive and performant platform.
The Business Analytics Value PropositionEric Stephens
Presentation made to the Nashville Technology Council Analytics Peer Network meeting on May 30, 2013. Discussion of the impact of analytics to an organization, along with use cases that can help convey the value of the practice to executives and other managers.
The document discusses connected planning and how it provides a new way for companies to plan and make decisions. Connected planning allows for real-time collaboration across departments and the entire value chain. It provides benefits like speed, agility, visibility and cost savings. Anaplan is presented as enabling connected planning through its in-memory platform that connects plans, people and data, allowing dynamic decision making and continuous planning.
The document discusses predictive analytics and forecasting. It defines predictive analytics as producing predictive scores for each customer or organizational element, while forecasting provides aggregate estimates such as total sales. Prediction involves classifying outcomes like customer retention, while forecasting understands trends and seasonality. Predictive modeling creates statistical models of future behavior by collecting and analyzing data to predict outcomes. Common predictive algorithms include logistic regression, decision trees, naive bayes, and clustering.
Demand Planning for Managers: When to Apply Statistical ForecastsAdexa, Inc.
This is Part 1 of 4 presentations to help Business Managers understand how to use best use statistical forecasts as part of a Demand Planning Process. This is the introductory presentation in the series, and discusses when manual efforts should be used to supplement statistical forecasts. It also introduces the viewer to the concepts of categorizing products into classes, and analyzing a product hierarchies in order to improve forecast accuracy.
Predictive analytics uses data mining, statistics, modeling, machine learning and artificial intelligence to analyze current and historical facts to make predictions about future or otherwise unknown events. This presentation provides an overview of predictive analytics, including its business applications such as customer retention, risk management and operational optimization. Common predictive analytics methods and tools are also discussed.
This document provides an overview of predictive analytics. It discusses how predictive analytics uses data from the past to predict the future, such as forecasting sales or determining what ad to display. It notes that predictive analytics relies on past data, statistical analysis, and assumptions. It outlines some common types of predictive analytics and discusses challenges such as lack of quality data, invalid statistical models, and assumptions becoming outdated over time, such as when key variables change.
Hub 16: Supply chain planning excellence with ExcelitasAnaplan
A disruptive and holistic approach to forecasting and manufacturing is needed to win in local markets worldwide. Without a global system that standardizes and communicates emerging practices and behaviors across sales and manufacturing, organizations compromise agility and uptime. Learn from Amit Shah how Excelitas, a global manufacturer, is making this a reality with manufacturing excellence. Learn from real examples of how Excelitas' journey is managed with technology, and see what the company did before and what its vision is with Anaplan.
This document discusses key performance indicators (KPIs) and dashboard reporting. It is presented by Jeff Robson, CEO of Access Analytic Solutions, which provides business modeling, reporting, and analysis services. The document covers why KPIs are important, examples of KPI dashboards, best practices for dashboard design, and limitations of using Excel for dashboard reporting. It promotes the use of specialized dashboard software for improved workflow, data handling, security, and visualization compared to Excel. Contact information is provided at the end for dashboard training courses.
This document discusses a presentation about integrated business analytics solutions using Oracle EPM, BI, and big data technologies. It provides an overview of Edgewater Ranzal, a global Oracle consulting partner, including their experience, services, and clients. The bulk of the presentation focuses on profitability and cost management, including the challenges organizations face, Oracle's solution, and a deep dive on the Profitability and Cost Management Cloud Service.
The document discusses TekMetrix corporate performance management solutions to help companies improve business planning and analysis capabilities. It outlines common challenges companies face around areas like price and margin management, customer segmentation, and enhanced channel execution. TekMetrix offers analytics, professional services, and software leveraging existing SAP investments to address these pain points and enable business improvement at transactional, business unit, and corporate levels. Case studies demonstrate significant reductions in working capital, operating costs, and improvements in return on capital employed.
Winning Strategies for Oracle Cloud Adoption: Should You Test Drive, Lease, o...Joseph Alaimo Jr
This document summarizes an agenda for a presentation on integrated business analytics solutions. It discusses Oracle's EPM, BI and big data technologies and how they can be used together. It then provides an overview of Edgewater Ranzal, the presenting company, including their experience, services, and recognition from Oracle. The agenda includes an introduction, a discussion of business analytics cloud architecture, approaches to cloud adoption and case studies, an analytics demo, and closing Q&A.
This document summarizes new features in IBM's predictive analytics software products SPSS and Decision Optimization. It discusses how these products empower all users to access more data sources and deploy analytics at scale both on-premises and in the cloud. New features like expanded open source capabilities and Python integration allow for more flexible and powerful predictive modeling. Case studies demonstrate how these advanced analytics solutions have provided significant value and returns for customers across industries.
This document provides an overview and summary of new features in IBM SPSS Predictive Analytics and IBM Decision Optimization. It discusses how predictive analytics can help organizations in various industries and functional areas. Key new features highlighted include empowering every user, unlocking more data faster, ground to cloud deployment options, optional coding and open source integration, and making predictive analytics accessible everywhere. The document demonstrates how these solutions have provided quantified benefits to customers.
S&OP as a service is a cloud solution that integrates demand planning, forecasting and Supply Planning functionality, with an external supply network optimization and digital twin simulation model, to help analyze multiple production scenarios and find the best plan to satisfy the demand, the inventory policies, with lead times, min batches, and production capacity and labor constrains. The output of the Supply Planning component include multiple analytic stories and planning capabilities as RCCP and Detailed Scheduling.
Edgewater Ranzal hosted a series of luncheons in various cities to share real examples of how clients are leveraging Oracle Hyperion short and long-term EPM/BI solutions delivered on Oracle Exalytics to improve decision-making processes that lead to profitable growth.
With rising business challenges in the aftermarket service areas, it becomes imperative for manufacturers to gain actionable intelligence across the warranty management life cycle.
Join Revolution Analytics and Tech Mahindra to hear how to reduce the information visibility gap:
• Identify statistically significant business drivers
• Forecast warranty costs and claims
• Improve Customer Satisfaction
- Betta Struts PLC is a UK-based company and market leader in metal framing and support systems with £55 million turnover and 650 employees.
- It was facing issues like inconsistent delivery, high inventory, and customer dissatisfaction due to problems in its existing supply chain.
- KPMG consultants conducted a study and recommended a new supply chain model, strategies like adopting SAP software, restructuring logistics, and changing company culture to improve customer service.
- After implementing the recommendations, Betta Struts achieved the required profit returns, improved customer focus through a changed culture, and reduced inventory and delivery costs.
Fuel for the cognitive age: What's new in IBM predictive analytics IBM SPSS Software
IBM recently launched an updated version of its predictive analytics platform. Explore the latest features, including R, Python and Spark integration and more powerful decision optimization.
The Path Forward: Getting started with Analytics QuotientJulie Severance
The document discusses strategies for achieving success with business analytics. It introduces the concept of an Analytics Quotient (AQ) which measures an organization's analytics maturity. It describes the four stages of AQ maturity - Novice, Builder, Leader, and Master. Higher AQ organizations are found to outperform others. The document recommends measuring an organization's current AQ, addressing key strategy perspectives like people, process, and technology, and implementing an Analytics Center of Excellence to organize strategies and raise the AQ to the next stage of maturity.
Our mission is to deliver simplified connected solutions to complex planning, performance management, and business intelligence challenges.
We partner with you to understand your business, your goals, and your underlying challenges. We provide strategic guidance and roadmaps customized to your needs and vision. In addition, we ensure you realize the full potential of your technology plan through technology implementations, upgrades, and integrations. Our consultants are certified in their respective domains and are respected leaders within the Anaplan and Oracle communities. You will have the benefit of working with our consultants who have decades of experience in product knowledge and industry best practices.
Achieving Sales Performance Optimization Through Automated Incentive Compensa...Callidus Software
presented at TrueConnection: Sales Performance Management Conference 2007 by Jeff Staley, CRM Center of Excellence at SAP, and Jim Thomas, Senior Sales Engineer at Callidus Software
The document provides an overview of Oracle's E-Business Suite Release 12, which aims to help businesses think globally, work globally, and manage systems globally through more integrated and flexible applications. Key capabilities highlighted include global financial consolidation, profitability analysis, project portfolio analysis, strategic network optimization, inventory optimization, operational reporting, and a new user experience.
Using Machine Learning to Accelerate Revenue Paul Johnston
This presentation explains what Machine Learning is and the use cases for Machine Learning within sales & marketing. Learn how to use Machine Learning to improve conversions, clone your best customers, improve sales performance and reduce customer churn.
This document provides an overview of a business analytics course from EduPristine. It defines business analytics as the application of computer technology, statistics, and domain knowledge to solve business problems. It discusses the different types of analytics including descriptive, inquisitive, predictive, and prescriptive. The course aims to equip professionals with tools and techniques to answer important business questions by exploring data patterns. Topics covered include linear regression, logistic regression, decision trees, clustering, and time series modeling. Case studies are used to apply analytic techniques to domains like insurance, banking, retail, and automotive.
Analytics is the application of computer technology ,statistics and domain knowledge to solve problems in business and industry ,to aid efficient and effective design making.
This document provides an overview of a business analytics course from EduPristine. It defines business analytics as the application of computer technology, statistics, and domain knowledge to solve business problems and make more informed decisions. The document outlines topics that will be covered in the course, including descriptive, predictive, and prescriptive analytics. It also lists common business domains and tools that analytics can be applied to, such as marketing, finance, and retail. The goal of the training is to equip professionals with the skills to explore data, identify patterns, predict relationships, and solve real-world business problems.
This is the third in our three part webinar series on cloud-enabled customer insights. Learn how to scale your customer analytics operations up and out with Microsoft Azure Data Lake.
Similar to Energy Trading and Prescriptive Analytics (20)
Codeless Generative AI Pipelines
(GenAI with Milvus)
https://ml.dssconf.pl/user.html#!/lecture/DSSML24-041a/rate
Discover the potential of real-time streaming in the context of GenAI as we delve into the intricacies of Apache NiFi and its capabilities. Learn how this tool can significantly simplify the data engineering workflow for GenAI applications, allowing you to focus on the creative aspects rather than the technical complexities. I will guide you through practical examples and use cases, showing the impact of automation on prompt building. From data ingestion to transformation and delivery, witness how Apache NiFi streamlines the entire pipeline, ensuring a smooth and hassle-free experience.
Timothy Spann
https://www.youtube.com/@FLaNK-Stack
https://medium.com/@tspann
https://www.datainmotion.dev/
milvus, unstructured data, vector database, zilliz, cloud, vectors, python, deep learning, generative ai, genai, nifi, kafka, flink, streaming, iot, edge
Build applications with generative AI on Google CloudMárton Kodok
We will explore Vertex AI - Model Garden powered experiences, we are going to learn more about the integration of these generative AI APIs. We are going to see in action what the Gemini family of generative models are for developers to build and deploy AI-driven applications. Vertex AI includes a suite of foundation models, these are referred to as the PaLM and Gemini family of generative ai models, and they come in different versions. We are going to cover how to use via API to: - execute prompts in text and chat - cover multimodal use cases with image prompts. - finetune and distill to improve knowledge domains - run function calls with foundation models to optimize them for specific tasks. At the end of the session, developers will understand how to innovate with generative AI and develop apps using the generative ai industry trends.
Open Source Contributions to Postgres: The Basics POSETTE 2024ElizabethGarrettChri
Postgres is the most advanced open-source database in the world and it's supported by a community, not a single company. So how does this work? How does code actually get into Postgres? I recently had a patch submitted and committed and I want to share what I learned in that process. I’ll give you an overview of Postgres versions and how the underlying project codebase functions. I’ll also show you the process for submitting a patch and getting that tested and committed.
Did you know that drowning is a leading cause of unintentional death among young children? According to recent data, children aged 1-4 years are at the highest risk. Let's raise awareness and take steps to prevent these tragic incidents. Supervision, barriers around pools, and learning CPR can make a difference. Stay safe this summer!
We are pleased to share with you the latest VCOSA statistical report on the cotton and yarn industry for the month of May 2024.
Starting from January 2024, the full weekly and monthly reports will only be available for free to VCOSA members. To access the complete weekly report with figures, charts, and detailed analysis of the cotton fiber market in the past week, interested parties are kindly requested to contact VCOSA to subscribe to the newsletter.
1. Energy Trading and Prescriptive Analytics
Chris McManaman
March 2017
Its nice to know the destination. Its awesome to
know the best route to get there.
2. Agenda
Challenges in Energy Trading and Supply Chain Optimization
Why is Prescriptive Analytics such a great solution?
How does Prescriptive Analytics work?
3. Challenges in developing
energy supply chain solutions
Solutions to complex
problems
Partnerships and
Acquisitions
Collaboration among
business functions
Risk Management Preparing for the future
4. The Excel Supply Chain Optimization Solution
Each asset on the supply chain is optimized using siloed spreadsheets, Access or one
off applications
5. The Excel Supply Chain Optimization Solution
The ability to simulate or optimize a solution across the entire energy supply chain which would include
input from both trading and operational models requires the compilations of many spreadsheets into a
super massive spreadsheet.
The effort required to develop this massive spreadsheet outweighs the value that the spreadsheet provides
because of the time its takes and the number of adjustments and assumptions required to merge all the
data
6. Data required to optimize an energy supply chain can
get overwhelming…
7. Agenda
Energy Trading and Supply Chain Optimization
Why is Prescriptive Analytics such a great solution?
How does Prescriptive Analytics work?
8. The benefits of 5th Generation Prescriptive Analytics
Software
• Drag
• Drop
• Configure
• Integrate
• Run
*notice the absence of the words: develop, compile, debug or
the name of any programming language..
9. Energy trading supply chain analysts can stop
building code to model and optimize scenarios…
10. …With this
• Each icon is drag and droppable
• Each icon is configurable to set up constraints and variables
• Each icon can import data
11. Integration of data and report generation
PnL Report
Income Statement
Balance Sheet
MtM Report
Credit Exposure Report
ETRM ERP DWExcel/AccessMarket Data
Prescriptive Analytic Software
12. Prescriptive Analytics optimizes decision making
Descriptive Diagnostic Predictive Prescriptive
Information Optimization
Hindsight Insight Foresight
Purchased Below normal
temperature
Purchase
Forecasts
Purchase supply
based on forecast
17. Prescriptive Analytics
You are here
You need to be
here
This is the best path to get to your objective
Foresight + Optimization
18. Two ways that prescriptive analytics can provide GPS capabilities
Optimization Simulation
Operational Strategic
Balance exposure across industries
Managing natural gas storage
Increase revenue
Determine optimal pipeline route
Purchase additional capacity
Enter new markets
Change pricing index
Divest assets
20. Agenda
Challenges in Energy Trading and Supply Chain Optimization
Why is Prescriptive Analytics such a great solution?
How does Prescriptive Analytics work?
21. Objectives
The three key elements used to determine the optimal solution
Decision
variables
MaximizeGeneratesConstraintsData
Pipeline capacity
Injection and withdrawal rates
Pipeline routes
Accounts receivable
Credit exposure
Accounts payable
Maximize net income
Hedge 20% of production
Minimize credit exposure
22. Developing the Optimization Model
What are we trying to
optimize?
On what factors will we base our
decisions?
What determines the most
optimal solution?
What constraints must be
honored to be accepted as a
feasible solution?
Identify decision
variables
Define objectives
Itemize
constraints
Understand
problem
23. Data Decision VariablesConstraints
Prescriptive analytics is easy to implement
Maximize Net
Profit
Purchase Price
and Volumes
Production
costs
Crude
transportation
routes
Prescriptive analytic optimization models combine:
Objectives
Tariffs and
Volumes
Pipeline costs
Pipeline
capacity
Fees and
Volumes
Trucking costs
Trucking
capacity
Sales Price and
Volumes
Sales ValueCredit limit
24. How to get started?
Prescriptive Analytics Workshop
1 day in depth workshop on prescriptive analytics for
a comprehensive discussion on prescriptive analytics
Prescriptive Analytics Training
5 day training on prescriptive analytics so your
company can get hands on experience with
prescriptive analytics
Prescriptive Analytics Assessment
2 weeks assessment of how prescriptive analytics can
be applied to your company to improve net income
Prescriptive Analytics Proof of Concept
4-6 week proof of concept to demonstrate how
prescriptive analytics can speed up decision making
and improve revenue and reduce costs
25. Energy Trading and Supply Chain Analytics
https://www.linkedin.com/in/cmcmanaman/