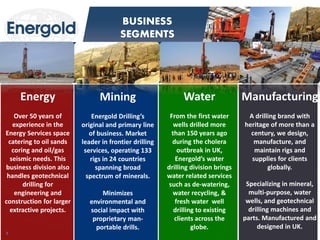
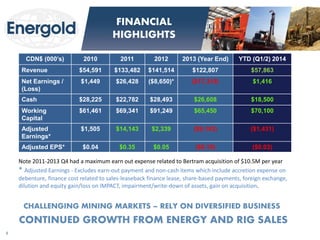
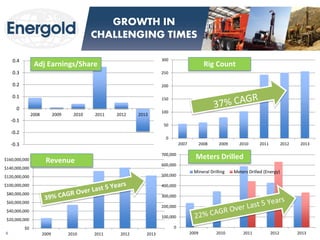
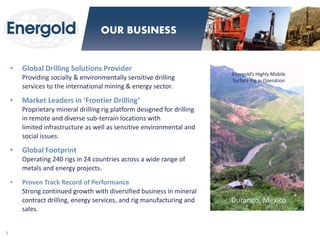
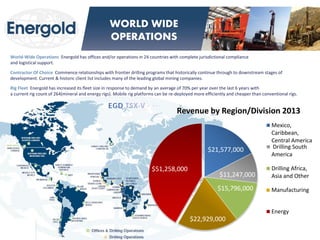
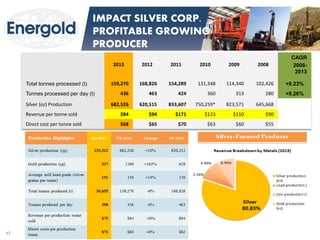
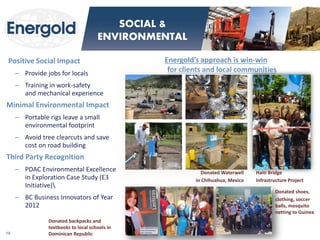
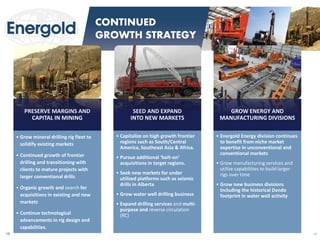
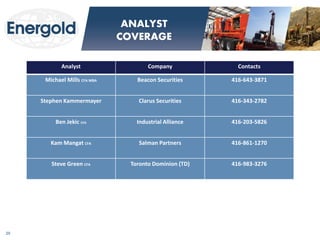
JUL 2014 
GLOBAL DRILLING 
SOLUTIONS 
14 
2 
Corporate Presentation Q2
This presentation contains certain forward-looking statements and information relating to Energold that are based on the beliefs of its management as well as assumptions made by and information currently available to Energold. When used in this document, the words “anticipate”, “believe”, “estimate”, “expect” and similar expressions, as they relate to the Company or its management, are intended to identify forward-looking statements. 
This presentation contains forward looking statements relating to, among other things, regulatory compliance, the sufficiency of current working capital, the estimated cost and availability of funding for the continued exploration and development of the Company’s exploration properties. Such statements reflect the current views of the Company with respect to future events and are subject to certain risks, uncertainties and assumptions. Many factors could cause the actual results, performance or achievements of the Company to be materially different from any future results, performance or achievements that may be expressed or implied by such forward-looking statements. 
George Gorzynski, P.Eng., a Qualified Person under the meaning of Canadian National Instrument 43-101,is responsible for the IMPACT Silver Corp. technical information in this presentation. 
2 
FORWARD LOOKING STATEMENTS
3 
Mining 
Energold Drilling’s original and primary line of business. Market leader in frontier drilling services, operating 133 rigs in 24 countries spanning broad spectrum of minerals. Minimizes environmental and social impact with proprietary man- portable drills. 
Energy 
Over 50 years of experience in the Energy Services space catering to oil sands coring and oil/gas seismic needs. This business division also handles geotechnical drilling for engineering and construction for larger extractive projects. 
Manufacturing 
A drilling brand with heritage of more than a century, we design, manufacture, and maintain rigs and supplies for clients globally. 
Specializing in mineral, multi-purpose, water wells, and geotechnical drilling machines and parts. Manufactured and designed in UK. 
BUSINESS SEGMENTS 
Water 
From the first water wells drilled more than 150 years ago during the cholera outbreak in UK, Energold’s water drilling division brings water related services such as de-watering, water recycling, & fresh water well drilling to existing clients across the globe.
4 
CORPORATE SUMMARY 
Fred Davidson CA MBA President, CEO and Director James Coleman LLB Chairman and Director Steven Gold CFA Chief Financial Officer Martin Fitch-Roy Managing Director (Dando Drilling Services)| Brian Bertram Managing Director (Energold Energy Services) H. Walter Sellmer Director 
Michael J. Beley Director Wayne Lenton Director 
Trading Symbol 
EGD:TSXV 
Share Price (Sept 2014) 
$1.58 
Shares Outstanding 
47.6 Million 
Shares Fully Diluted 
47.6 Million 
Market Cap 
$75.2 Million 
Institutional Ownership 
25% 
Insider Ownership 
10% 
Cash 
$26.6 Million 
Long Term Liability 
$715K
CDN$ (000’s) 
2010 
2011 
2012 
2013 (Year End) 
YTD (Q1/2) 2014 
Revenue 
$54,591 
$133,482 
$141,514 
$122,807 
$57,863 
Net Earnings / (Loss) 
$1,449 
$26,428 
($8,650)* 
($17,319) 
$1,416 
Cash 
$28,225 
$22,782 
$28,493 
$26,608 
$18,500 
Working Capital 
$61,461 
$69,341 
$91,249 
$65,450 
$70,100 
Adjusted Earnings* 
$1,505 
$14,143 
$2,339 
($9,143) 
($1,431) 
Adjusted EPS* 
$0.04 
$0.35 
$0.05 
($0.19) 
($0.03) 
5 
FINANCIAL HIGHLIGHTS 
Note 2011-2013 Q4 had a maximum earn out expense related to Bertram acquisition of $10.5M per year * Adjusted Earnings - Excludes earn-out payment and non-cash items which include accretion expense on debenture, finance cost related to sales-leaseback finance lease, share-based payments, foreign exchange, dilution and equity gain/loss on IMPACT, impairment/write-down of assets, gain on acquisition. 
CHALLENGING MINING MARKETS – RELY ON DIVERSIFIED BUSINESS 
CONTINUED GROWTH FROM ENERGY AND RIG SALES
$0 
$20,000,000 
$40,000,000 
$60,000,000 
$80,000,000 
$100,000,000 
$120,000,000 
$140,000,000 
$160,000,000 
2009 
2010 
2011 
2012 
2013 
0 
100,000 
200,000 
300,000 
400,000 
500,000 
600,000 
700,000 
2009 
2010 
2011 
2012 
2013 
Mineral Drilling 
Meters Drilled (Energy) 
6 
GROWTH IN CHALLENGING TIMES 
Meters Drilled 
Revenue 
0 
50 
100 
150 
200 
250 
300 
2007 
2008 
2009 
2010 
2011 
2012 
2013 
Rig Count 
-0.3 
-0.2 
-0.1 
0 
0.1 
0.2 
0.3 
0.4 
2008 
2009 
2010 
2011 
2012 
2013 
Adj Earnings/Share
•Global Drilling Solutions Provider Providing socially & environmentally sensitive drilling services to the international mining & energy sector. 
•Market Leaders in ‘Frontier Drilling’ Proprietary mineral drilling rig platform designed for drilling in remote and diverse sub-terrain locations with limited infrastructure as well as sensitive environmental and social issues. 
•Global Footprint Operating 240 rigs in 24 countries across a wide range of metals and energy projects. 
•Proven Track Record of Performance Strong continued growth with diversified business in mineral contract drilling, energy services, and rig manufacturing and sales. 
Energold’s Highly Mobile 
Surface Rig in Operation 
Durango, Mexico 
7 
OUR BUSINESS
8 
WORLD WIDE OPERATIONS 
World-Wide Operations Energold has offices and/or operations in 24 countries with complete jurisdictional compliance and logistical support. 
Contractor Of Choice Commence relationships with frontier drilling programs that historically continue through to downstream stages of development. Current & historic client list includes many of the leading global mining companies. 
Rig Fleet Energold has increased its fleet size in response to demand by an average of 70% per year over the last 6 years with a current rig count of 264(mineral and energy rigs). Mobile rig platforms can be re-deployed more efficiently and cheaper than conventional rigs. 
$21,577,000 
$11,247,000 
$15,796,000 
$22,929,000 
$51,258,000 
Revenue by Region/Division 2013 
Mexico, 
Caribbean, 
Central America 
Drilling South 
America 
Drilling Africa, 
Asia and Other 
Manufacturing 
Energy
Modular Component Design 
–Easy to transport within country, across challenging terrain as well as rapid mobilization globally to reduce downtime 
Proprietary Technology 
–Depth capabilities of over 1,000m with ¼ inch greater core diameter using (TW) Thin Wall rod system 
–Competitive portable rigs only reach depths between 200–300m BTW 
Rigs Built In-House 
–Ensures proprietary nature of rig designs 
–Continual upgrades are implemented from input of field personnel 
–Ability to upgrade portable rigs seamlessly to conventional drill rig as project evolves 
9 
OUR TECHNOLOGY
LONGTERM SOUND FUNDAMENTALS 
•Raw material prices vs. production cost favors continued exploration 
•New sizable discoveries are increasingly difficult to find, forcing traditional miners to seek assets in frontier regions that require specialized equipment 
•Producers with record cash levels seeking to replenish reserves (evident by recent M&A activities in market) 
•GDP Growth 2011-2025 forecast by BHP is +6% for China and +2% for US driving by urbanization 
Source: MEG, PriceWaterhouseCoopers 
10 
MINING INDUSTRY 
POSITIVE OUTLOOK 
World needs new discoveries = more frontier drilling 
Source: BHP Biliton Dec 2012 Macquarie Conference
Energold’s clientele includes many of the world’s largest mining companies. 
Existing clientele range from early-stage junior explorers to well known, mature producers spanning all base and precious metals, as well as industrial commodities. 
MAJORS 
•Barrick Gold 
•BHP Billiton 
•Goldcorp 
•Grupo Mexico 
•Rio Tinto 
•Newmont Mining 
•Penoles 
•Vale 
•AngloGold 
•Fresnillo 
•El Dorado Gold 
•Codelco 
JUNIORS 
•Grayd Resources (now Agnico-Eagle) 
•US Gold (now McEwan Mining) 
•Great Panther Silver 
•First Majestic Silver 
•Olympus Pacific Resources (now Besra Gold) 
•Magellan 
•GoldQuest Mining Corp. 
11 
CUSTOMER PROFILE
•Proven player in sizable oil sands market dating back to 1963 
•Niche, high-margin market with short and long-term growth 
•Oil Sands coring – smooth out Energold traditional slow mineral seasons (Q4/Q1) 
•Re-allocation under-utilized drill fleet (seismic and specialty) within Energold’s global network 
•Synergy of talents – trained drillers in energy drilling can transition to mineral drilling and vice-versa 
•2013 addition of 2 new oil sands coring rigs to address market demand 
Bertram TH60 
Coring Rig 
12 
ENERGOLD ENERGY BERTRAM INTERNATIONAL CORP. 
LIS GT1 
Seismic Drilling Rig 
Quality name in Oil Sands 
14 Rigs 12% 
75 Seismic 62% 
32 Rigs 26% 
Energy Services Fleet 
Oil Sands Coring Rigs 
Seismic Rigs 
Speciality Rigs (RC, 
Geothermal, 
Geotech)
World Class Resources 
•Oil sands represent 97% Canada’s oil reserves1 
Sizable expenditures expected 
•About $84 billion per year investment for next 25 years 
Oil Sands project are long-term 
•Less susceptible to short term pricing fluctuations as compared to metal markets 
1.Environmental Canada May 2011 Oil Sands Report 
2.CAPP http://www.capp.ca/getdoc.aspx?DocId=191939&DT=NTV 
3.Canada National Energy Board – Energy Oil Sands Assessment 2006 
13 
ENERGY INDUSTRY OIL SANDS OUTLOOK
•Over 150 years of experience in designing and manufacturing of larger rigs in the UK 
•Maintenance, servicing, and sales of rigs and parts to third parties 
•Expertise in water well drilling 
•Building a new services division that can leverage the existing Energold logistics network 
Mineral Multipurpose 
Mintec® Rigs 
14 
ENERGOLD MANUFACTURING 
DANDO INTERNATIONAL LTD. 
Trusted Name in 
Drills for 150 years 
Water Well Drilling Watertec® Rigs 
Geotechnical 
Drilling Rigs 
Geotec® Rigs
•Continued growth with reputable name brand Difficult 2-3 years but improvements in 2013 in US, China, and most of developing world. 1 
•Different categories of clients Dando caters to the WorldBank, UN, UNICEF, and Oxfams of the world. 
•Market Potential Global mining equipment market is $61 billion. At $22.9 million (2013 record high revenue), Energold is just 0.01% of the market. 2 
1.Caterpillar Q2 2013 Earnings http://www.caterpillar.com/investors/events-and-presentations/presentations 
2.Standard & Poors – Credit Week Feb 2012 
15 
INDUSTRY DEMAND SOFTENED BUT ROOM FOR GROWTH FOR DANDO
•IMPACT Silver Corp is a profitable silver producer and explorer in Mexico 
•ENERGOLD DRILLING CORP owns 6.87 million shares (11%~) 
•OPERATIONS 
Four mines in production 
•EXPLORATION 
Tremendous exploration potential with 623km2 and over 3,000 mine workings mapped to drive new developments 
•DEVELOPMENT 
Capire Mine is now in initial production with 200TPD mill 
Zacualpan Processing Plant 
SYMBOL IPT-TSX.V 
SHARE PRICE $0.55 
MARKET CAP $55 M 
CASH $12 M DEBT $0 
16 
INVESTMENT HOLDINGS: IMPACT SILVER CORP.
Year 
17 
IMPACT SILVER CORP. PROFITABLE GROWING PRODUCER 
2013 
2012 
2011 
2010 
2009 
2008 
CAGR 
2008- 2013 
Total tonnes processed (t) 
159,270 
168,826 
154,289 
131,348 
114,340 
102,426 
+9.23% 
Tonnes processed per day (t) 
436 
463 
424 
360 
313 
280 
+9.26% 
Silver (oz) Production 
682,526 
620,515 
833,607 
750,259* 
823,571 
645,668 
Revenue per tonne sold 
$84 
$94 
$171 
$123 
$110 
$90 
Direct cost per tonne sold 
$68 
$65 
$70 
$63 
$60 
$55
Positive Social Impact 
–Provide jobs for locals 
–Training in work-safety and mechanical experience 
Minimal Environmental Impact 
–Portable rigs leave a small environmental footprint 
–Avoid tree clearcuts and save cost on road building 
Third Party Recognition 
–PDAC Environmental Excellence in Exploration Case Study (E3 Initiative) 
–BC Business Innovators of Year 2012 
Energold’s approach is win-win for clients and local communities 
18 
SOCIAL & ENVIRONMENTAL 
Haiti Bridge 
Infrastructure Project 
Donated Waterwell 
in Chihuahua, Mexico 
Donated backpacks and textbooks to local schools in Dominican Republic 
Donated shoes, 
clothing, soccer balls, mosquito netting to Guinea
19 
PRESERVE MARGINS AND CAPITAL IN MINING 
•Grow mineral drilling rig fleet to solidify existing markets 
•Continued growth of frontier drilling and transitioning with clients to mature projects with larger conventional drills 
•Organic growth and search for acquisitions in existing and new markets 
•Continue technological advancements in rig design and capabilities. 
SEED AND EXPAND INTO NEW MARKETS 
•Capitalize on high growth frontier regions such as South/Central America, Southeast Asia & Africa. 
•Pursue additional ‘bolt-on’ acquisitions in target regions. 
•Seek new markets for under utilized platforms such as seismic drills in Alberta 
•Grow water well drilling business 
•Expand drilling services and multi- purpose and reverse circulation (RC) 
GROW ENERGY AND MANUFACTURING DIVISIONS 
•Energold Energy division continues to benefit from niche market expertise in unconventional and conventional markets 
•Grow manufacturing services and utilize capabilities to build larger rigs over time 
•Grow new business divisions including the historical Dando footprint in water well activity 
19 
CONTINUED GROWTH STRATEGY
Analyst 
Company 
Contacts 
Michael Mills CFA MBA 
Beacon Securities 
416-643-3871 
Stephen Kammermayer 
Clarus Securities 
416-343-2782 
Ben Jekic CFA 
Industrial Alliance 
416-203-5826 
Kam Mangat CFA 
Salman Partners 
416-861-1270 
Steve Green CFA 
Toronto Dominion (TD) 
416-983-3276 
20 
ANALYST COVERAGE
•Energold presents a compelling opportunity to invest in a broad range of commodities and projects worldwide 
•Catalysts for growth – diversified business continues to find niche pockets of strength in market 
•Favorable balance sheet allows EGD to capitalize on opportunities 
•Value play on commodities – trading at 50% discount to one year revenue and low multiples 
21 
INVEST IN ENERGOLD TODAY 
5 Year Chart on EGD:TSXV
Appendix Income Stmt 
Income Statement Highlights 2010-2013 
YTD 2014 
2013 
2012 
2011 
2010 
Net Revenues ($Millions) 
57.863 
$122.81 
$ 141.51 
$ 133.48 
$ 54.59 
Net Income ($Millions) 
(2.701) 
$ (17.32) 
$ (8.65) 
$ 26.43 
$ 1.59 
Earnings Per Share (EPS) - Basic 
(0.05) 
$ (0.36) 
$ (0.19) 
$ 0.65 
$ 0.04 
Earnings Per Share (EPS) - Diluted 
(0.05) 
$ (0.36) 
$ (0.19) 
$ 0.64 
$ 0.05 
Cash Per Share (CPS) 
$0.40 
$ 0.56 
$ 0.62 
$ 0.62 
$ 0.77 
Net Working Capital ($Millions) 
70.10 
65.45 
81.85 
69.34 
63.65 
Minerals Metres Drilled (Meters) 
95,800 
296,500 
428,300 
587,544 
346,328 
Energy Meters Drilled (Meters) 
212,800 
335,200 
630,600 
444,400 
N/A
Appendix Balance Sheet 
Balance Sheet Highlights 2010-2013 
Q2 2014 
2013 
2012 
2011 
2010 
Current Assets ($Millions) 
$98.691 
$107.74 
112.1 
99.58 
71.88 
Total Assets ($Millions) 
$150.014 
$163.65 
172.816 
163.49 
91.02 
Cash and Cash Equivalents ($Millions) 
$18.491 
$26.61 
28.493 
25.267 
30.7 
Current Liabilities ($Millions) 
$28.90 
$42.28 
30.253 
30.24 
8.23 
Long-Term Debt ($Millions) 
$6.52 
$4.97 
9.4 
9.079 
0.17 
Shareholder Equity ($M) 
$114.60 
$116.85 
129.861 
111.895 
78.32
Contact info 
Jerry Huang MBA 
Manager Investor Relations 
jhuang@ energold.com 604-681-9501

Energold Presentation

  • 1.
    JUL 2014 GLOBALDRILLING SOLUTIONS 14 2 Corporate Presentation Q2
  • 2.
    This presentation containscertain forward-looking statements and information relating to Energold that are based on the beliefs of its management as well as assumptions made by and information currently available to Energold. When used in this document, the words “anticipate”, “believe”, “estimate”, “expect” and similar expressions, as they relate to the Company or its management, are intended to identify forward-looking statements. This presentation contains forward looking statements relating to, among other things, regulatory compliance, the sufficiency of current working capital, the estimated cost and availability of funding for the continued exploration and development of the Company’s exploration properties. Such statements reflect the current views of the Company with respect to future events and are subject to certain risks, uncertainties and assumptions. Many factors could cause the actual results, performance or achievements of the Company to be materially different from any future results, performance or achievements that may be expressed or implied by such forward-looking statements. George Gorzynski, P.Eng., a Qualified Person under the meaning of Canadian National Instrument 43-101,is responsible for the IMPACT Silver Corp. technical information in this presentation. 2 FORWARD LOOKING STATEMENTS
  • 3.
    3 Mining EnergoldDrilling’s original and primary line of business. Market leader in frontier drilling services, operating 133 rigs in 24 countries spanning broad spectrum of minerals. Minimizes environmental and social impact with proprietary man- portable drills. Energy Over 50 years of experience in the Energy Services space catering to oil sands coring and oil/gas seismic needs. This business division also handles geotechnical drilling for engineering and construction for larger extractive projects. Manufacturing A drilling brand with heritage of more than a century, we design, manufacture, and maintain rigs and supplies for clients globally. Specializing in mineral, multi-purpose, water wells, and geotechnical drilling machines and parts. Manufactured and designed in UK. BUSINESS SEGMENTS Water From the first water wells drilled more than 150 years ago during the cholera outbreak in UK, Energold’s water drilling division brings water related services such as de-watering, water recycling, & fresh water well drilling to existing clients across the globe.
  • 4.
    4 CORPORATE SUMMARY Fred Davidson CA MBA President, CEO and Director James Coleman LLB Chairman and Director Steven Gold CFA Chief Financial Officer Martin Fitch-Roy Managing Director (Dando Drilling Services)| Brian Bertram Managing Director (Energold Energy Services) H. Walter Sellmer Director Michael J. Beley Director Wayne Lenton Director Trading Symbol EGD:TSXV Share Price (Sept 2014) $1.58 Shares Outstanding 47.6 Million Shares Fully Diluted 47.6 Million Market Cap $75.2 Million Institutional Ownership 25% Insider Ownership 10% Cash $26.6 Million Long Term Liability $715K
  • 5.
    CDN$ (000’s) 2010 2011 2012 2013 (Year End) YTD (Q1/2) 2014 Revenue $54,591 $133,482 $141,514 $122,807 $57,863 Net Earnings / (Loss) $1,449 $26,428 ($8,650)* ($17,319) $1,416 Cash $28,225 $22,782 $28,493 $26,608 $18,500 Working Capital $61,461 $69,341 $91,249 $65,450 $70,100 Adjusted Earnings* $1,505 $14,143 $2,339 ($9,143) ($1,431) Adjusted EPS* $0.04 $0.35 $0.05 ($0.19) ($0.03) 5 FINANCIAL HIGHLIGHTS Note 2011-2013 Q4 had a maximum earn out expense related to Bertram acquisition of $10.5M per year * Adjusted Earnings - Excludes earn-out payment and non-cash items which include accretion expense on debenture, finance cost related to sales-leaseback finance lease, share-based payments, foreign exchange, dilution and equity gain/loss on IMPACT, impairment/write-down of assets, gain on acquisition. CHALLENGING MINING MARKETS – RELY ON DIVERSIFIED BUSINESS CONTINUED GROWTH FROM ENERGY AND RIG SALES
  • 6.
    $0 $20,000,000 $40,000,000 $60,000,000 $80,000,000 $100,000,000 $120,000,000 $140,000,000 $160,000,000 2009 2010 2011 2012 2013 0 100,000 200,000 300,000 400,000 500,000 600,000 700,000 2009 2010 2011 2012 2013 Mineral Drilling Meters Drilled (Energy) 6 GROWTH IN CHALLENGING TIMES Meters Drilled Revenue 0 50 100 150 200 250 300 2007 2008 2009 2010 2011 2012 2013 Rig Count -0.3 -0.2 -0.1 0 0.1 0.2 0.3 0.4 2008 2009 2010 2011 2012 2013 Adj Earnings/Share
  • 7.
    •Global Drilling SolutionsProvider Providing socially & environmentally sensitive drilling services to the international mining & energy sector. •Market Leaders in ‘Frontier Drilling’ Proprietary mineral drilling rig platform designed for drilling in remote and diverse sub-terrain locations with limited infrastructure as well as sensitive environmental and social issues. •Global Footprint Operating 240 rigs in 24 countries across a wide range of metals and energy projects. •Proven Track Record of Performance Strong continued growth with diversified business in mineral contract drilling, energy services, and rig manufacturing and sales. Energold’s Highly Mobile Surface Rig in Operation Durango, Mexico 7 OUR BUSINESS
  • 8.
    8 WORLD WIDEOPERATIONS World-Wide Operations Energold has offices and/or operations in 24 countries with complete jurisdictional compliance and logistical support. Contractor Of Choice Commence relationships with frontier drilling programs that historically continue through to downstream stages of development. Current & historic client list includes many of the leading global mining companies. Rig Fleet Energold has increased its fleet size in response to demand by an average of 70% per year over the last 6 years with a current rig count of 264(mineral and energy rigs). Mobile rig platforms can be re-deployed more efficiently and cheaper than conventional rigs. $21,577,000 $11,247,000 $15,796,000 $22,929,000 $51,258,000 Revenue by Region/Division 2013 Mexico, Caribbean, Central America Drilling South America Drilling Africa, Asia and Other Manufacturing Energy
  • 9.
    Modular Component Design –Easy to transport within country, across challenging terrain as well as rapid mobilization globally to reduce downtime Proprietary Technology –Depth capabilities of over 1,000m with ¼ inch greater core diameter using (TW) Thin Wall rod system –Competitive portable rigs only reach depths between 200–300m BTW Rigs Built In-House –Ensures proprietary nature of rig designs –Continual upgrades are implemented from input of field personnel –Ability to upgrade portable rigs seamlessly to conventional drill rig as project evolves 9 OUR TECHNOLOGY
  • 10.
    LONGTERM SOUND FUNDAMENTALS •Raw material prices vs. production cost favors continued exploration •New sizable discoveries are increasingly difficult to find, forcing traditional miners to seek assets in frontier regions that require specialized equipment •Producers with record cash levels seeking to replenish reserves (evident by recent M&A activities in market) •GDP Growth 2011-2025 forecast by BHP is +6% for China and +2% for US driving by urbanization Source: MEG, PriceWaterhouseCoopers 10 MINING INDUSTRY POSITIVE OUTLOOK World needs new discoveries = more frontier drilling Source: BHP Biliton Dec 2012 Macquarie Conference
  • 11.
    Energold’s clientele includesmany of the world’s largest mining companies. Existing clientele range from early-stage junior explorers to well known, mature producers spanning all base and precious metals, as well as industrial commodities. MAJORS •Barrick Gold •BHP Billiton •Goldcorp •Grupo Mexico •Rio Tinto •Newmont Mining •Penoles •Vale •AngloGold •Fresnillo •El Dorado Gold •Codelco JUNIORS •Grayd Resources (now Agnico-Eagle) •US Gold (now McEwan Mining) •Great Panther Silver •First Majestic Silver •Olympus Pacific Resources (now Besra Gold) •Magellan •GoldQuest Mining Corp. 11 CUSTOMER PROFILE
  • 12.
    •Proven player insizable oil sands market dating back to 1963 •Niche, high-margin market with short and long-term growth •Oil Sands coring – smooth out Energold traditional slow mineral seasons (Q4/Q1) •Re-allocation under-utilized drill fleet (seismic and specialty) within Energold’s global network •Synergy of talents – trained drillers in energy drilling can transition to mineral drilling and vice-versa •2013 addition of 2 new oil sands coring rigs to address market demand Bertram TH60 Coring Rig 12 ENERGOLD ENERGY BERTRAM INTERNATIONAL CORP. LIS GT1 Seismic Drilling Rig Quality name in Oil Sands 14 Rigs 12% 75 Seismic 62% 32 Rigs 26% Energy Services Fleet Oil Sands Coring Rigs Seismic Rigs Speciality Rigs (RC, Geothermal, Geotech)
  • 13.
    World Class Resources •Oil sands represent 97% Canada’s oil reserves1 Sizable expenditures expected •About $84 billion per year investment for next 25 years Oil Sands project are long-term •Less susceptible to short term pricing fluctuations as compared to metal markets 1.Environmental Canada May 2011 Oil Sands Report 2.CAPP http://www.capp.ca/getdoc.aspx?DocId=191939&DT=NTV 3.Canada National Energy Board – Energy Oil Sands Assessment 2006 13 ENERGY INDUSTRY OIL SANDS OUTLOOK
  • 14.
    •Over 150 yearsof experience in designing and manufacturing of larger rigs in the UK •Maintenance, servicing, and sales of rigs and parts to third parties •Expertise in water well drilling •Building a new services division that can leverage the existing Energold logistics network Mineral Multipurpose Mintec® Rigs 14 ENERGOLD MANUFACTURING DANDO INTERNATIONAL LTD. Trusted Name in Drills for 150 years Water Well Drilling Watertec® Rigs Geotechnical Drilling Rigs Geotec® Rigs
  • 15.
    •Continued growth withreputable name brand Difficult 2-3 years but improvements in 2013 in US, China, and most of developing world. 1 •Different categories of clients Dando caters to the WorldBank, UN, UNICEF, and Oxfams of the world. •Market Potential Global mining equipment market is $61 billion. At $22.9 million (2013 record high revenue), Energold is just 0.01% of the market. 2 1.Caterpillar Q2 2013 Earnings http://www.caterpillar.com/investors/events-and-presentations/presentations 2.Standard & Poors – Credit Week Feb 2012 15 INDUSTRY DEMAND SOFTENED BUT ROOM FOR GROWTH FOR DANDO
  • 16.
    •IMPACT Silver Corpis a profitable silver producer and explorer in Mexico •ENERGOLD DRILLING CORP owns 6.87 million shares (11%~) •OPERATIONS Four mines in production •EXPLORATION Tremendous exploration potential with 623km2 and over 3,000 mine workings mapped to drive new developments •DEVELOPMENT Capire Mine is now in initial production with 200TPD mill Zacualpan Processing Plant SYMBOL IPT-TSX.V SHARE PRICE $0.55 MARKET CAP $55 M CASH $12 M DEBT $0 16 INVESTMENT HOLDINGS: IMPACT SILVER CORP.
  • 17.
    Year 17 IMPACTSILVER CORP. PROFITABLE GROWING PRODUCER 2013 2012 2011 2010 2009 2008 CAGR 2008- 2013 Total tonnes processed (t) 159,270 168,826 154,289 131,348 114,340 102,426 +9.23% Tonnes processed per day (t) 436 463 424 360 313 280 +9.26% Silver (oz) Production 682,526 620,515 833,607 750,259* 823,571 645,668 Revenue per tonne sold $84 $94 $171 $123 $110 $90 Direct cost per tonne sold $68 $65 $70 $63 $60 $55
  • 18.
    Positive Social Impact –Provide jobs for locals –Training in work-safety and mechanical experience Minimal Environmental Impact –Portable rigs leave a small environmental footprint –Avoid tree clearcuts and save cost on road building Third Party Recognition –PDAC Environmental Excellence in Exploration Case Study (E3 Initiative) –BC Business Innovators of Year 2012 Energold’s approach is win-win for clients and local communities 18 SOCIAL & ENVIRONMENTAL Haiti Bridge Infrastructure Project Donated Waterwell in Chihuahua, Mexico Donated backpacks and textbooks to local schools in Dominican Republic Donated shoes, clothing, soccer balls, mosquito netting to Guinea
  • 19.
    19 PRESERVE MARGINSAND CAPITAL IN MINING •Grow mineral drilling rig fleet to solidify existing markets •Continued growth of frontier drilling and transitioning with clients to mature projects with larger conventional drills •Organic growth and search for acquisitions in existing and new markets •Continue technological advancements in rig design and capabilities. SEED AND EXPAND INTO NEW MARKETS •Capitalize on high growth frontier regions such as South/Central America, Southeast Asia & Africa. •Pursue additional ‘bolt-on’ acquisitions in target regions. •Seek new markets for under utilized platforms such as seismic drills in Alberta •Grow water well drilling business •Expand drilling services and multi- purpose and reverse circulation (RC) GROW ENERGY AND MANUFACTURING DIVISIONS •Energold Energy division continues to benefit from niche market expertise in unconventional and conventional markets •Grow manufacturing services and utilize capabilities to build larger rigs over time •Grow new business divisions including the historical Dando footprint in water well activity 19 CONTINUED GROWTH STRATEGY
  • 20.
    Analyst Company Contacts Michael Mills CFA MBA Beacon Securities 416-643-3871 Stephen Kammermayer Clarus Securities 416-343-2782 Ben Jekic CFA Industrial Alliance 416-203-5826 Kam Mangat CFA Salman Partners 416-861-1270 Steve Green CFA Toronto Dominion (TD) 416-983-3276 20 ANALYST COVERAGE
  • 21.
    •Energold presents acompelling opportunity to invest in a broad range of commodities and projects worldwide •Catalysts for growth – diversified business continues to find niche pockets of strength in market •Favorable balance sheet allows EGD to capitalize on opportunities •Value play on commodities – trading at 50% discount to one year revenue and low multiples 21 INVEST IN ENERGOLD TODAY 5 Year Chart on EGD:TSXV
  • 22.
    Appendix Income Stmt Income Statement Highlights 2010-2013 YTD 2014 2013 2012 2011 2010 Net Revenues ($Millions) 57.863 $122.81 $ 141.51 $ 133.48 $ 54.59 Net Income ($Millions) (2.701) $ (17.32) $ (8.65) $ 26.43 $ 1.59 Earnings Per Share (EPS) - Basic (0.05) $ (0.36) $ (0.19) $ 0.65 $ 0.04 Earnings Per Share (EPS) - Diluted (0.05) $ (0.36) $ (0.19) $ 0.64 $ 0.05 Cash Per Share (CPS) $0.40 $ 0.56 $ 0.62 $ 0.62 $ 0.77 Net Working Capital ($Millions) 70.10 65.45 81.85 69.34 63.65 Minerals Metres Drilled (Meters) 95,800 296,500 428,300 587,544 346,328 Energy Meters Drilled (Meters) 212,800 335,200 630,600 444,400 N/A
  • 23.
    Appendix Balance Sheet Balance Sheet Highlights 2010-2013 Q2 2014 2013 2012 2011 2010 Current Assets ($Millions) $98.691 $107.74 112.1 99.58 71.88 Total Assets ($Millions) $150.014 $163.65 172.816 163.49 91.02 Cash and Cash Equivalents ($Millions) $18.491 $26.61 28.493 25.267 30.7 Current Liabilities ($Millions) $28.90 $42.28 30.253 30.24 8.23 Long-Term Debt ($Millions) $6.52 $4.97 9.4 9.079 0.17 Shareholder Equity ($M) $114.60 $116.85 129.861 111.895 78.32
  • 24.
    Contact info JerryHuang MBA Manager Investor Relations jhuang@ energold.com 604-681-9501