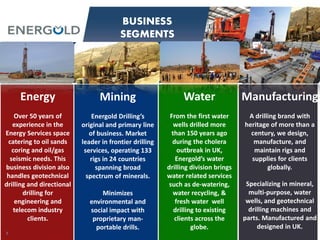
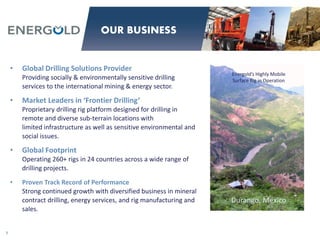
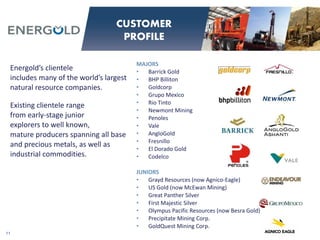
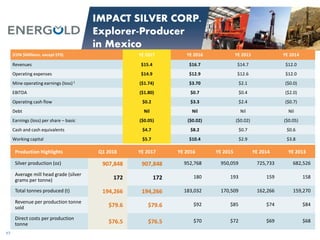
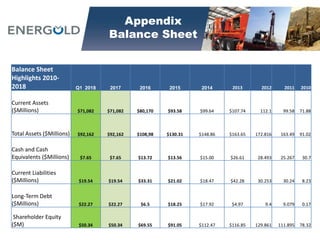
Energold Drilling Group
Corporate Presentation
Jun 2018
This presentation contains certain forward-looking statements and information relating to
Energold that are based on the beliefs of its management as well as assumptions made by and information currently
available to Energold. When used in this document, the words “anticipate”, “believe”, “estimate”, “expect” and
similar expressions, as they relate to the Company or its management, are intended to identify forward-looking
statements.
This presentation contains forward looking statements relating to, among other things, regulatory compliance, the
sufficiency of current working capital, the estimated cost and availability of funding for the continued exploration and
development of the Company’s exploration properties. Such statements reflect the current views of the Company
with respect to future events and are subject
to certain risks, uncertainties and assumptions. Many factors could cause the actual results, performance or
achievements of the Company to be materially different from any future results, performance or achievements that
may be expressed or implied by such forward-looking statements.
George Gorzynski, P.Eng., a Qualified Person under the meaning of Canadian National Instrument 43-101,is
responsible for the IMPACT Silver Corp. technical information in this presentation.
2
FORWARD LOOKING
STATEMENTS
3
Mining
Energold Drilling’s
original and primary line
of business. Market
leader in frontier drilling
services, operating 133
rigs in 24 countries
spanning broad
spectrum of minerals.
Minimizes
environmental and
social impact with
proprietary man-
portable drills.
Energy
Over 50 years of
experience in the
Energy Services space
catering to oil sands
coring and oil/gas
seismic needs. This
business division also
handles geotechnical
drilling and directional
drilling for
engineering and
telecom industry
clients.
Manufacturing
A drilling brand with
heritage of more than a
century, we design,
manufacture, and
maintain rigs and
supplies for clients
globally.
Specializing in mineral,
multi-purpose, water
wells, and geotechnical
drilling machines and
parts. Manufactured and
designed in UK.
BUSINESS
SEGMENTS
Water
From the first water
wells drilled more
than 150 years ago
during the cholera
outbreak in UK,
Energold’s water
drilling division brings
water related services
such as de-watering,
water recycling, &
fresh water well
drilling to existing
clients across the
globe.
4
CORPORATE
SUMMARY
Fred Davidson CA MBA
President, CEO and Director
James Coleman LLB
Chairman and Director
Steven Gold CFA
Chief Financial Officer
Brian Bertram
Managing Director (Energold Energy Services)
Ethan Park Director
Michael J. Beley Director
Wayne Lenton B.Sc P.Eng Director
Mark Corra CMA CPA Director
Trading Symbol EGD:TSXV
Share Price (June 22) $0.42
Shares Outstanding 54.7 Million
Shares Fully Diluted 64.8 Million
Market Cap $23 Million
Institutional Ownership 20%
Insider Ownership 10%
Cash $5.9 Million
Working Capital $57.5 Million
$23.70
$54.49
$133.48 $141.52
$122.80
$100.30
$81.98
$65.40 $74.98
$23.90
0
20
40
60
80
100
120
140
160
2009 2010 2011 2012 2013 2014 2015 2016 2017 2018
Revenue ($Millions) CDN
5
CDN$ (000’s) 2012 2013 2014 2015 2016 2017 Q1 2018
Revenue $141,514 $122,807 $101,301 $81,976 $65,400 $74,988 $23,856
Net Earnings /
(Loss)
($8,650)* ($17,319) ($14,534) ($23,733) (18,561) (17,598) (2,497)
Cash $28,493 $26,608 $15,100 $13,563 $13,715 $7,653 $5,916
Working Capital $91,249 $65,450 $77,100 $72,568 $46,859 $51,536 $57,390
Adjusted
Earnings /
EBITDA
$2,339 ($9,143) ($10,876) ($8,380) ($5,250) ($5,618) $1,400
Adjusted EPS* $0.05 ($0.19) ($0.23) ($0.15) ($0.10) ($0.10) $0.02
Note 2011-2013 Q4 had a maximum earn out expense related to Bertram acquisition of $10.5M per year
, gain on* Adjusted Earnings - Excludes earn-out payment and non-cash items which include accretion expense on debenture, finance cost related to sales-
leaseback finance lease, share-based payments, foreign exchange, dilution and equity gain/loss on IMPACT, impairment/write-down of assets acquisition.
Revenue trending up
Q1 2018 EBITDA
positive first time
since 2012
Q1 2018
Only
0
50000
100000
150000
200000
250000
300000
350000
400000
450000
500000
0
20000
40000
60000
80000
100000
120000
140000
160000
180000
Jun-11
Aug-11
Oct-11
Dec-11
Feb-12
Apr-12
Jun-12
Aug-12
Oct-12
Dec-12
Feb-13
Apr-13
Jun-13
Aug-13
Oct-13
Dec-13
Feb-14
Apr-14
Jun-14
Aug-14
Oct-14
Dec-14
Feb-15
Apr-15
Jun-15
Aug-15
Oct-15
Dec-15
Feb-16
Apr-16
Jun-16
Aug-16
Oct-16
Dec-16
Feb-17
Apr-17
Jun-17
Aug-17
Oct-17
Dec-17
Feb-18
Mineral
Energy/Others
$12.60
$24.00
$33.04
$99.75$93.78
$51.20
$115.07
$182.88
$192.78
$99.96
$66.78
38.5 38.5
$18.55
$22.97
$-
$50.00
$100.00
$150.00
$200.00
$250.00
6
METRICS INDICATE
REBOUND UNDERWAY
Adjusted EPS 2008-2018
Quarterly Meters Drilled 2011 – 2018
Avg Market Cap EGD 2007-2018
$0.09
$0.03
$0.10
$0.35
-$0.19
-$0.36
-$0.28
-$0.39
-$0.10
-$0.04
$0.03
2008 2009 2010 2011 2012 2013 2014 2015 2016 2017 2018
• Global Drilling Solutions Provider
Providing socially & environmentally sensitive drilling
services to the international mining & energy sector.
• Market Leaders in ‘Frontier Drilling’
Proprietary drilling rig platform designed for drilling in
remote and diverse sub-terrain locations with
limited infrastructure as well as sensitive environmental and
social issues.
• Global Footprint
Operating 260+ rigs in 24 countries across a wide range of
drilling projects.
• Proven Track Record of Performance
Strong continued growth with diversified business in mineral
contract drilling, energy services, and rig manufacturing and
sales.
Energold’s Highly Mobile
Surface Rig in Operation
Durango, Mexico
7
OUR BUSINESS
8
GLOBAL
OPERATIONS
World-Wide Operations Energold has offices and/or operations in 24 countries with complete jurisdictional compliance
and logistical support.
Contractor Of Choice Commence relationships with frontier drilling programs that historically continue through to downstream stages of
development. Current & historic client list includes many of the leading global mining companies.
Rig Fleet Energold has increased its fleet size in response to demand by an average of 70% per year over the last 6 years with
a current rig count of 264. Mobile rig platforms can be re-deployed more efficiently and cheaper than conventional rigs.
20102
2078
10365
7466
6729
4321
Revenue by Region
Mexico Carribean
Central America
South America
Africa Asia others
Canada
USA
UK / Europe
Modular Component Design
– Easy to transport within country, across
challenging terrain as well as rapid
mobilization globally to reduce downtime
Proprietary Technology
– Depth capabilities of over 1,000m with
¼ inch greater core diameter using
(TW) Thin Wall rod system
– Competitive portable rigs only reach
depths between 200–300m BTW
Rigs Built In-House
– Ensures proprietary nature of rig designs
– Continual upgrades are implemented
from input of field personnel
– Ability to upgrade portable rigs seamlessly
to conventional drill rig as project evolves
9
OUR
TECHNOLOGY
• New discoveries are increasingly
difficult to find, forcing traditional
miners to seek assets in frontier
regions that require specialized
equipment  Energold.
• Producers first look to M&A to acquire
developed assets then realize they too
need to continue to drill to explore as
lack of pipeline projects become
apparent.
• Global exploration expenditure
dropped 70% since 2012 peaks of
$21B down to less than $7B worldwide
in 2016. 2017 showed promise with
the first increase since 2012 peaks.
Source: SNL Metals & Mining 2017 March
10
MINING INDUSTRY
$21.5B
$15.2B
$18.3B
$12.1B
$1.9B
$5.1B
$6.89B
MULTI-YEAR LOW IN EXPLORATION – TREND STARTING TO REBOUND
$7.3B
Energold’s clientele
includes many of the world’s largest
natural resource companies.
Existing clientele range
from early-stage junior
explorers to well known,
mature producers spanning all base
and precious metals, as well as
industrial commodities.
MAJORS
• Barrick Gold
• BHP Billiton
• Goldcorp
• Grupo Mexico
• Rio Tinto
• Newmont Mining
• Penoles
• Vale
• AngloGold
• Fresnillo
• El Dorado Gold
• Codelco
JUNIORS
• Grayd Resources (now Agnico-Eagle)
• US Gold (now McEwan Mining)
• Great Panther Silver
• First Majestic Silver
• Olympus Pacific Resources (now Besra Gold)
• Precipitate Mining Corp.
• GoldQuest Mining Corp.
11
CUSTOMER
PROFILE
• Proven player in sizable oil sands market
dating back to 1963
• Niche market with long-term players
committed to oil sands.
• Coring – smooth out Energold traditional
slow mineral seasons Q1 & Q4.
• Re-allocation under-utilized drill fleet
(seismic and specialty) within Energold’s
global network
• Synergy of talents – trained
drillers in energy drilling can transition to
mineral drilling and vice-versa
Bertram TH60
Coring Rig
12
ENERGOLD ENERGY
BERTRAM INTERNATIONAL CORP.
LIS GT1
Seismic Drilling Rig
Global Energy Drilling
14 Rigs
12%
82 Seismic
62%
37 Rigs
26%
Energold Energy Fleet
Oil Sands Coring
Rigs
Seismic Rigs
Speciality Rigs (RC,
Geothermal,
Geotech)
• HDD (Horizontal Directional Drilling) is used
to install telecommunication, power cables,
water lines, gas lines – an environmental
approach for the infrastructure industry.
• Software steered borehole accuracy and
targeting – bore hole range from 1” to 20” in
diameter.
• Hydro Vac is used to expose underground
utilities to get depth and profile of utility
before drilling to not damage existing
telecom, gas, water, and other lines most
cities have in place.
• Profitable and growing business with
potential to expand into US and booming
defense sector.13
ENERGOLD INFRASTRUCTURE SERVICES
CROS-MAN UNDERGROUND
Directional Drilling & Hydro Vac
Fleet of EGD Hydrovac Trucks
• 150 years of
experience in designing
and manufacturing
of larger rigs in the UK
• Maintenance, servicing,
and sales of rigs and parts to
third parties
• Expertise in water well
drilling
• Building a new services
division that can leverage the
existing Energold logistics
network
Mineral
Multipurpose
Mintec® Rigs
14
ENERGOLD MANUFACTURING
DANDO INTERNATIONAL LTD.
Trusted Name in
Drills for 150 years
Water Well
Drilling
Watertec® Rigs
Geotechnical
Drilling Rigs
Geotec® Rigs
• Continued growth
with reputable name
brand
Difficult 2-3 years but improvements
began in 2014 & continuing today
• Different categories
of clients
Dando caters to the WorldBank, UN,
UNICEF, and Oxfams of the world.
• Market Potential
Global equipment market is worth
$61 billion. At $22.9 million (2013
record), Energold is just 0.01% of the
market. 1
1. Standard & Poors
15
INDUSTRY DEMAND IMPROVING WORLDWIDE
• IMPACT Silver Corp
is a explorer-producer and explorer in
Mexico operating since 2006
• ENERGOLD DRILLING CORP owns 7.87
million shares (9%)
• OPERATIONS
Four mines – 2 mills (500 & 200 TPD)
• EXPLORATION
Tremendous exploration potential with
OVER 357km2 and over 4,000 mine
workings mapped to drive new
developments.
• DRILLING & GREENFIELD 2018
New high grade silver discovery at San
Felipe 400g/t Ag. New Gold/Copper
project San Teresa 114g/t sampling.
Zacualpan Processing Plant
SYMBOL IPT-TSX.V
SHARE PRICE $0.44
MARKET CAP $34 M
CASH $4M + $2M Receivables
DEBT $0
16
INVESTMENT HOLDINGS:
IMPACT SILVER CORP.
17
IMPACT SILVER CORP.
Explorer-Producer
in Mexico
(CDN $Millions, except EPS) YE 2017 YE 2016 YE 2015 YE 2014
Revenues $15.4 $16.7 $14.7 $12.0
Operating expenses $14.9 $12.9 $12.6 $12.0
Mine operating earnings (loss)1 ($1.74) $3.70 $2.1 ($0.0)
EBITDA ($1.80) $0.7 $0.4 ($2.0)
Operating cash flow $0.2 $3.3 $2.4 ($0.7)
Debt Nil Nil Nil Nil
Earnings (loss) per share – basic ($0.05) ($0.02) ($0.02) ($0.05)
Cash and cash equivalents $4.7 $8.2 $0.7 $0.6
Working capital $5.7 $10.4 $2.9 $3.8
Production Highlights Q1 2018 YE 2017 YE 2016 YE 2015 YE 2014 YE 2013
Silver production (oz) 907,848 907,848 952,768 950,059 725,733 682,526
Average mill head grade (silver
grams per tonne) 172 172 180 193 159 158
Total tonnes produced (t) 194,266 194,266 183,032 170,509 162,266 159,270
Revenue per production tonne
sold $79.6 $79.6 $92 $85 $74 $84
Direct costs per production
tonne $76.5 $76.5 $70 $72 $69 $68
Positive Social Impact
– Provide jobs for locals
– Training in work-safety
and mechanical experience
Minimal Environmental Impact
– Portable rigs leave a small
environmental footprint
– Avoid tree clear cuts and save
cost on road building
Third Party Recognition
– PDAC Environmental Excellence
in Exploration Case Study (E3
Initiative)
– BC Business Innovators of Year
– Top 100 Public Companies in
British Columbia 2018
– TSX Venture Top 50 Companies
2017
Energold’s approach is win-win for clients
and local communities
18
SOCIAL &
ENVIRONMENTAL
Haiti Bridge
Infrastructure Project
Donated Waterwell
in Chihuahua, Mexico
School Buildings
Soccer team and
textbook
donations
19
PRESERVE MARGINS AND
CAPITAL IN MINING
• Grow mineral drilling rig fleet to
solidify existing markets
• Continued growth of frontier
drilling and transitioning with
clients to mature projects with
larger conventional drills
• Organic growth and search for
acquisitions in existing and new
markets
• Continue technological
advancements in rig design and
capabilities.
SEED AND EXPAND
INTO NEW MARKETS
• Capitalize on high growth frontier
regions such as South/Central
America, Southeast Asia & Africa.
• Pursue additional ‘bolt-on’
acquisitions in target regions.
• Seek new markets for under
utilized platforms such as seismic
drills in Alberta
• Grow water well drilling business
• Expand drilling services and multi-
purpose and reverse circulation
(RC)
GROW ENERGY AND
MANUFACTURING DIVISIONS
• Energold Energy division continues
to benefit from niche market
expertise in unconventional and
conventional markets
• Grow manufacturing services and
utilize capabilities to build larger
rigs over time
• Grow new business divisions
including the historical Dando
footprint in water well activity
19
GROWTH STRATEGY
Analyst Company Contacts
Stephen Kammermayer Clarus Securities 416-343-2782
20
ANALYST
COVERAGE
Appendix
Income Stmt
Income Statement
Highlights 2010-2018
Q1 2018 2017 2016 2015 2014 2013 2012 2011 2010
Net Revenues ($Millions) $23,900 $56,696 $65,400 $81,976 $100,301 $122.81
$
141.51 $ 133.48
$
54.59
Net Income ($Millions) $(1,920) ($11,680) ($18,561) $(23.73) (14.05) $ (17.32)
$
(8.65) $ 26.43
$
1.59
Earnings Per Share (EPS) -
Basic ($0.04) ($0.21) ($0.36) $(0.49) (0.28) $ (0.36)
$
(0.19) $ 0.65
$
0.04
Earnings Per Share (EPS) -
Diluted ($0.04) ($0.21) ($0.36) $(0.49) (0.28) $ (0.36)
$
(0.19) $ 0.64
$
0.05
Cash Per Share (CPS) $0.11 $0.11 $0.26 $0.28 $0.37 $ 0.56
$
0.62 $ 0.62
$
0.77
Net Working Capital
($Millions) $57.5 $55.1 $46.7 $72.57 $77.00 65.45 81.85 69.34 63.65
Minerals Metres Drilled
(Meters) 72,400 227,800 232,600 202,800 236,600 296,500 428,300 587,544 346,328
Energy Meters Drilled
(Meters) 40,600 140,000 161,700 358,300 383,200 335,200 630,600 444,400 N/A
Appendix
Balance Sheet
Balance Sheet
Highlights 2010-
2018 Q1 2018 2017 2016 2015 2014 2013 2012 2011 2010
Current Assets
($Millions) $71,082 $71,082 $80,170 $93.58 $99.64 $107.74 112.1 99.58 71.88
Total Assets ($Millions) $92,162 $92,162 $108,98 $130.31 $148.86 $163.65 172.816 163.49 91.02
Cash and Cash
Equivalents ($Millions) $7.65 $7.65 $13.72 $13.56 $15.00 $26.61 28.493 25.267 30.7
Current Liabilities
($Millions) $19.54 $19.54 $33.31 $21.02 $18.47 $42.28 30.253 30.24 8.23
Long-Term Debt
($Millions) $22.27 $22.27 $6.5 $18.25 $17.92 $4.97 9.4 9.079 0.17
Shareholder Equity
($M) $50.34 $50.34 $69.55 $91.05 $112.47 $116.85 129.861 111.895 78.32
CONTACT
Jerry Huang MBA
Director Corporate Development & IR
jhuang@energold.com
604-681-9501

2018 06-22-cp egd

  • 1.
    Energold Drilling Group CorporatePresentation Jun 2018
  • 2.
    This presentation containscertain forward-looking statements and information relating to Energold that are based on the beliefs of its management as well as assumptions made by and information currently available to Energold. When used in this document, the words “anticipate”, “believe”, “estimate”, “expect” and similar expressions, as they relate to the Company or its management, are intended to identify forward-looking statements. This presentation contains forward looking statements relating to, among other things, regulatory compliance, the sufficiency of current working capital, the estimated cost and availability of funding for the continued exploration and development of the Company’s exploration properties. Such statements reflect the current views of the Company with respect to future events and are subject to certain risks, uncertainties and assumptions. Many factors could cause the actual results, performance or achievements of the Company to be materially different from any future results, performance or achievements that may be expressed or implied by such forward-looking statements. George Gorzynski, P.Eng., a Qualified Person under the meaning of Canadian National Instrument 43-101,is responsible for the IMPACT Silver Corp. technical information in this presentation. 2 FORWARD LOOKING STATEMENTS
  • 3.
    3 Mining Energold Drilling’s original andprimary line of business. Market leader in frontier drilling services, operating 133 rigs in 24 countries spanning broad spectrum of minerals. Minimizes environmental and social impact with proprietary man- portable drills. Energy Over 50 years of experience in the Energy Services space catering to oil sands coring and oil/gas seismic needs. This business division also handles geotechnical drilling and directional drilling for engineering and telecom industry clients. Manufacturing A drilling brand with heritage of more than a century, we design, manufacture, and maintain rigs and supplies for clients globally. Specializing in mineral, multi-purpose, water wells, and geotechnical drilling machines and parts. Manufactured and designed in UK. BUSINESS SEGMENTS Water From the first water wells drilled more than 150 years ago during the cholera outbreak in UK, Energold’s water drilling division brings water related services such as de-watering, water recycling, & fresh water well drilling to existing clients across the globe.
  • 4.
    4 CORPORATE SUMMARY Fred Davidson CAMBA President, CEO and Director James Coleman LLB Chairman and Director Steven Gold CFA Chief Financial Officer Brian Bertram Managing Director (Energold Energy Services) Ethan Park Director Michael J. Beley Director Wayne Lenton B.Sc P.Eng Director Mark Corra CMA CPA Director Trading Symbol EGD:TSXV Share Price (June 22) $0.42 Shares Outstanding 54.7 Million Shares Fully Diluted 64.8 Million Market Cap $23 Million Institutional Ownership 20% Insider Ownership 10% Cash $5.9 Million Working Capital $57.5 Million
  • 5.
    $23.70 $54.49 $133.48 $141.52 $122.80 $100.30 $81.98 $65.40 $74.98 $23.90 0 20 40 60 80 100 120 140 160 20092010 2011 2012 2013 2014 2015 2016 2017 2018 Revenue ($Millions) CDN 5 CDN$ (000’s) 2012 2013 2014 2015 2016 2017 Q1 2018 Revenue $141,514 $122,807 $101,301 $81,976 $65,400 $74,988 $23,856 Net Earnings / (Loss) ($8,650)* ($17,319) ($14,534) ($23,733) (18,561) (17,598) (2,497) Cash $28,493 $26,608 $15,100 $13,563 $13,715 $7,653 $5,916 Working Capital $91,249 $65,450 $77,100 $72,568 $46,859 $51,536 $57,390 Adjusted Earnings / EBITDA $2,339 ($9,143) ($10,876) ($8,380) ($5,250) ($5,618) $1,400 Adjusted EPS* $0.05 ($0.19) ($0.23) ($0.15) ($0.10) ($0.10) $0.02 Note 2011-2013 Q4 had a maximum earn out expense related to Bertram acquisition of $10.5M per year , gain on* Adjusted Earnings - Excludes earn-out payment and non-cash items which include accretion expense on debenture, finance cost related to sales- leaseback finance lease, share-based payments, foreign exchange, dilution and equity gain/loss on IMPACT, impairment/write-down of assets acquisition. Revenue trending up Q1 2018 EBITDA positive first time since 2012 Q1 2018 Only
  • 6.
    0 50000 100000 150000 200000 250000 300000 350000 400000 450000 500000 0 20000 40000 60000 80000 100000 120000 140000 160000 180000 Jun-11 Aug-11 Oct-11 Dec-11 Feb-12 Apr-12 Jun-12 Aug-12 Oct-12 Dec-12 Feb-13 Apr-13 Jun-13 Aug-13 Oct-13 Dec-13 Feb-14 Apr-14 Jun-14 Aug-14 Oct-14 Dec-14 Feb-15 Apr-15 Jun-15 Aug-15 Oct-15 Dec-15 Feb-16 Apr-16 Jun-16 Aug-16 Oct-16 Dec-16 Feb-17 Apr-17 Jun-17 Aug-17 Oct-17 Dec-17 Feb-18 Mineral Energy/Others $12.60 $24.00 $33.04 $99.75$93.78 $51.20 $115.07 $182.88 $192.78 $99.96 $66.78 38.5 38.5 $18.55 $22.97 $- $50.00 $100.00 $150.00 $200.00 $250.00 6 METRICS INDICATE REBOUNDUNDERWAY Adjusted EPS 2008-2018 Quarterly Meters Drilled 2011 – 2018 Avg Market Cap EGD 2007-2018 $0.09 $0.03 $0.10 $0.35 -$0.19 -$0.36 -$0.28 -$0.39 -$0.10 -$0.04 $0.03 2008 2009 2010 2011 2012 2013 2014 2015 2016 2017 2018
  • 7.
    • Global DrillingSolutions Provider Providing socially & environmentally sensitive drilling services to the international mining & energy sector. • Market Leaders in ‘Frontier Drilling’ Proprietary drilling rig platform designed for drilling in remote and diverse sub-terrain locations with limited infrastructure as well as sensitive environmental and social issues. • Global Footprint Operating 260+ rigs in 24 countries across a wide range of drilling projects. • Proven Track Record of Performance Strong continued growth with diversified business in mineral contract drilling, energy services, and rig manufacturing and sales. Energold’s Highly Mobile Surface Rig in Operation Durango, Mexico 7 OUR BUSINESS
  • 8.
    8 GLOBAL OPERATIONS World-Wide Operations Energoldhas offices and/or operations in 24 countries with complete jurisdictional compliance and logistical support. Contractor Of Choice Commence relationships with frontier drilling programs that historically continue through to downstream stages of development. Current & historic client list includes many of the leading global mining companies. Rig Fleet Energold has increased its fleet size in response to demand by an average of 70% per year over the last 6 years with a current rig count of 264. Mobile rig platforms can be re-deployed more efficiently and cheaper than conventional rigs. 20102 2078 10365 7466 6729 4321 Revenue by Region Mexico Carribean Central America South America Africa Asia others Canada USA UK / Europe
  • 9.
    Modular Component Design –Easy to transport within country, across challenging terrain as well as rapid mobilization globally to reduce downtime Proprietary Technology – Depth capabilities of over 1,000m with ¼ inch greater core diameter using (TW) Thin Wall rod system – Competitive portable rigs only reach depths between 200–300m BTW Rigs Built In-House – Ensures proprietary nature of rig designs – Continual upgrades are implemented from input of field personnel – Ability to upgrade portable rigs seamlessly to conventional drill rig as project evolves 9 OUR TECHNOLOGY
  • 10.
    • New discoveriesare increasingly difficult to find, forcing traditional miners to seek assets in frontier regions that require specialized equipment  Energold. • Producers first look to M&A to acquire developed assets then realize they too need to continue to drill to explore as lack of pipeline projects become apparent. • Global exploration expenditure dropped 70% since 2012 peaks of $21B down to less than $7B worldwide in 2016. 2017 showed promise with the first increase since 2012 peaks. Source: SNL Metals & Mining 2017 March 10 MINING INDUSTRY $21.5B $15.2B $18.3B $12.1B $1.9B $5.1B $6.89B MULTI-YEAR LOW IN EXPLORATION – TREND STARTING TO REBOUND $7.3B
  • 11.
    Energold’s clientele includes manyof the world’s largest natural resource companies. Existing clientele range from early-stage junior explorers to well known, mature producers spanning all base and precious metals, as well as industrial commodities. MAJORS • Barrick Gold • BHP Billiton • Goldcorp • Grupo Mexico • Rio Tinto • Newmont Mining • Penoles • Vale • AngloGold • Fresnillo • El Dorado Gold • Codelco JUNIORS • Grayd Resources (now Agnico-Eagle) • US Gold (now McEwan Mining) • Great Panther Silver • First Majestic Silver • Olympus Pacific Resources (now Besra Gold) • Precipitate Mining Corp. • GoldQuest Mining Corp. 11 CUSTOMER PROFILE
  • 12.
    • Proven playerin sizable oil sands market dating back to 1963 • Niche market with long-term players committed to oil sands. • Coring – smooth out Energold traditional slow mineral seasons Q1 & Q4. • Re-allocation under-utilized drill fleet (seismic and specialty) within Energold’s global network • Synergy of talents – trained drillers in energy drilling can transition to mineral drilling and vice-versa Bertram TH60 Coring Rig 12 ENERGOLD ENERGY BERTRAM INTERNATIONAL CORP. LIS GT1 Seismic Drilling Rig Global Energy Drilling 14 Rigs 12% 82 Seismic 62% 37 Rigs 26% Energold Energy Fleet Oil Sands Coring Rigs Seismic Rigs Speciality Rigs (RC, Geothermal, Geotech)
  • 13.
    • HDD (HorizontalDirectional Drilling) is used to install telecommunication, power cables, water lines, gas lines – an environmental approach for the infrastructure industry. • Software steered borehole accuracy and targeting – bore hole range from 1” to 20” in diameter. • Hydro Vac is used to expose underground utilities to get depth and profile of utility before drilling to not damage existing telecom, gas, water, and other lines most cities have in place. • Profitable and growing business with potential to expand into US and booming defense sector.13 ENERGOLD INFRASTRUCTURE SERVICES CROS-MAN UNDERGROUND Directional Drilling & Hydro Vac Fleet of EGD Hydrovac Trucks
  • 14.
    • 150 yearsof experience in designing and manufacturing of larger rigs in the UK • Maintenance, servicing, and sales of rigs and parts to third parties • Expertise in water well drilling • Building a new services division that can leverage the existing Energold logistics network Mineral Multipurpose Mintec® Rigs 14 ENERGOLD MANUFACTURING DANDO INTERNATIONAL LTD. Trusted Name in Drills for 150 years Water Well Drilling Watertec® Rigs Geotechnical Drilling Rigs Geotec® Rigs
  • 15.
    • Continued growth withreputable name brand Difficult 2-3 years but improvements began in 2014 & continuing today • Different categories of clients Dando caters to the WorldBank, UN, UNICEF, and Oxfams of the world. • Market Potential Global equipment market is worth $61 billion. At $22.9 million (2013 record), Energold is just 0.01% of the market. 1 1. Standard & Poors 15 INDUSTRY DEMAND IMPROVING WORLDWIDE
  • 16.
    • IMPACT SilverCorp is a explorer-producer and explorer in Mexico operating since 2006 • ENERGOLD DRILLING CORP owns 7.87 million shares (9%) • OPERATIONS Four mines – 2 mills (500 & 200 TPD) • EXPLORATION Tremendous exploration potential with OVER 357km2 and over 4,000 mine workings mapped to drive new developments. • DRILLING & GREENFIELD 2018 New high grade silver discovery at San Felipe 400g/t Ag. New Gold/Copper project San Teresa 114g/t sampling. Zacualpan Processing Plant SYMBOL IPT-TSX.V SHARE PRICE $0.44 MARKET CAP $34 M CASH $4M + $2M Receivables DEBT $0 16 INVESTMENT HOLDINGS: IMPACT SILVER CORP.
  • 17.
    17 IMPACT SILVER CORP. Explorer-Producer inMexico (CDN $Millions, except EPS) YE 2017 YE 2016 YE 2015 YE 2014 Revenues $15.4 $16.7 $14.7 $12.0 Operating expenses $14.9 $12.9 $12.6 $12.0 Mine operating earnings (loss)1 ($1.74) $3.70 $2.1 ($0.0) EBITDA ($1.80) $0.7 $0.4 ($2.0) Operating cash flow $0.2 $3.3 $2.4 ($0.7) Debt Nil Nil Nil Nil Earnings (loss) per share – basic ($0.05) ($0.02) ($0.02) ($0.05) Cash and cash equivalents $4.7 $8.2 $0.7 $0.6 Working capital $5.7 $10.4 $2.9 $3.8 Production Highlights Q1 2018 YE 2017 YE 2016 YE 2015 YE 2014 YE 2013 Silver production (oz) 907,848 907,848 952,768 950,059 725,733 682,526 Average mill head grade (silver grams per tonne) 172 172 180 193 159 158 Total tonnes produced (t) 194,266 194,266 183,032 170,509 162,266 159,270 Revenue per production tonne sold $79.6 $79.6 $92 $85 $74 $84 Direct costs per production tonne $76.5 $76.5 $70 $72 $69 $68
  • 18.
    Positive Social Impact –Provide jobs for locals – Training in work-safety and mechanical experience Minimal Environmental Impact – Portable rigs leave a small environmental footprint – Avoid tree clear cuts and save cost on road building Third Party Recognition – PDAC Environmental Excellence in Exploration Case Study (E3 Initiative) – BC Business Innovators of Year – Top 100 Public Companies in British Columbia 2018 – TSX Venture Top 50 Companies 2017 Energold’s approach is win-win for clients and local communities 18 SOCIAL & ENVIRONMENTAL Haiti Bridge Infrastructure Project Donated Waterwell in Chihuahua, Mexico School Buildings Soccer team and textbook donations
  • 19.
    19 PRESERVE MARGINS AND CAPITALIN MINING • Grow mineral drilling rig fleet to solidify existing markets • Continued growth of frontier drilling and transitioning with clients to mature projects with larger conventional drills • Organic growth and search for acquisitions in existing and new markets • Continue technological advancements in rig design and capabilities. SEED AND EXPAND INTO NEW MARKETS • Capitalize on high growth frontier regions such as South/Central America, Southeast Asia & Africa. • Pursue additional ‘bolt-on’ acquisitions in target regions. • Seek new markets for under utilized platforms such as seismic drills in Alberta • Grow water well drilling business • Expand drilling services and multi- purpose and reverse circulation (RC) GROW ENERGY AND MANUFACTURING DIVISIONS • Energold Energy division continues to benefit from niche market expertise in unconventional and conventional markets • Grow manufacturing services and utilize capabilities to build larger rigs over time • Grow new business divisions including the historical Dando footprint in water well activity 19 GROWTH STRATEGY
  • 20.
    Analyst Company Contacts StephenKammermayer Clarus Securities 416-343-2782 20 ANALYST COVERAGE
  • 21.
    Appendix Income Stmt Income Statement Highlights2010-2018 Q1 2018 2017 2016 2015 2014 2013 2012 2011 2010 Net Revenues ($Millions) $23,900 $56,696 $65,400 $81,976 $100,301 $122.81 $ 141.51 $ 133.48 $ 54.59 Net Income ($Millions) $(1,920) ($11,680) ($18,561) $(23.73) (14.05) $ (17.32) $ (8.65) $ 26.43 $ 1.59 Earnings Per Share (EPS) - Basic ($0.04) ($0.21) ($0.36) $(0.49) (0.28) $ (0.36) $ (0.19) $ 0.65 $ 0.04 Earnings Per Share (EPS) - Diluted ($0.04) ($0.21) ($0.36) $(0.49) (0.28) $ (0.36) $ (0.19) $ 0.64 $ 0.05 Cash Per Share (CPS) $0.11 $0.11 $0.26 $0.28 $0.37 $ 0.56 $ 0.62 $ 0.62 $ 0.77 Net Working Capital ($Millions) $57.5 $55.1 $46.7 $72.57 $77.00 65.45 81.85 69.34 63.65 Minerals Metres Drilled (Meters) 72,400 227,800 232,600 202,800 236,600 296,500 428,300 587,544 346,328 Energy Meters Drilled (Meters) 40,600 140,000 161,700 358,300 383,200 335,200 630,600 444,400 N/A
  • 22.
    Appendix Balance Sheet Balance Sheet Highlights2010- 2018 Q1 2018 2017 2016 2015 2014 2013 2012 2011 2010 Current Assets ($Millions) $71,082 $71,082 $80,170 $93.58 $99.64 $107.74 112.1 99.58 71.88 Total Assets ($Millions) $92,162 $92,162 $108,98 $130.31 $148.86 $163.65 172.816 163.49 91.02 Cash and Cash Equivalents ($Millions) $7.65 $7.65 $13.72 $13.56 $15.00 $26.61 28.493 25.267 30.7 Current Liabilities ($Millions) $19.54 $19.54 $33.31 $21.02 $18.47 $42.28 30.253 30.24 8.23 Long-Term Debt ($Millions) $22.27 $22.27 $6.5 $18.25 $17.92 $4.97 9.4 9.079 0.17 Shareholder Equity ($M) $50.34 $50.34 $69.55 $91.05 $112.47 $116.85 129.861 111.895 78.32
  • 23.
    CONTACT Jerry Huang MBA DirectorCorporate Development & IR jhuang@energold.com 604-681-9501