Download to read offline


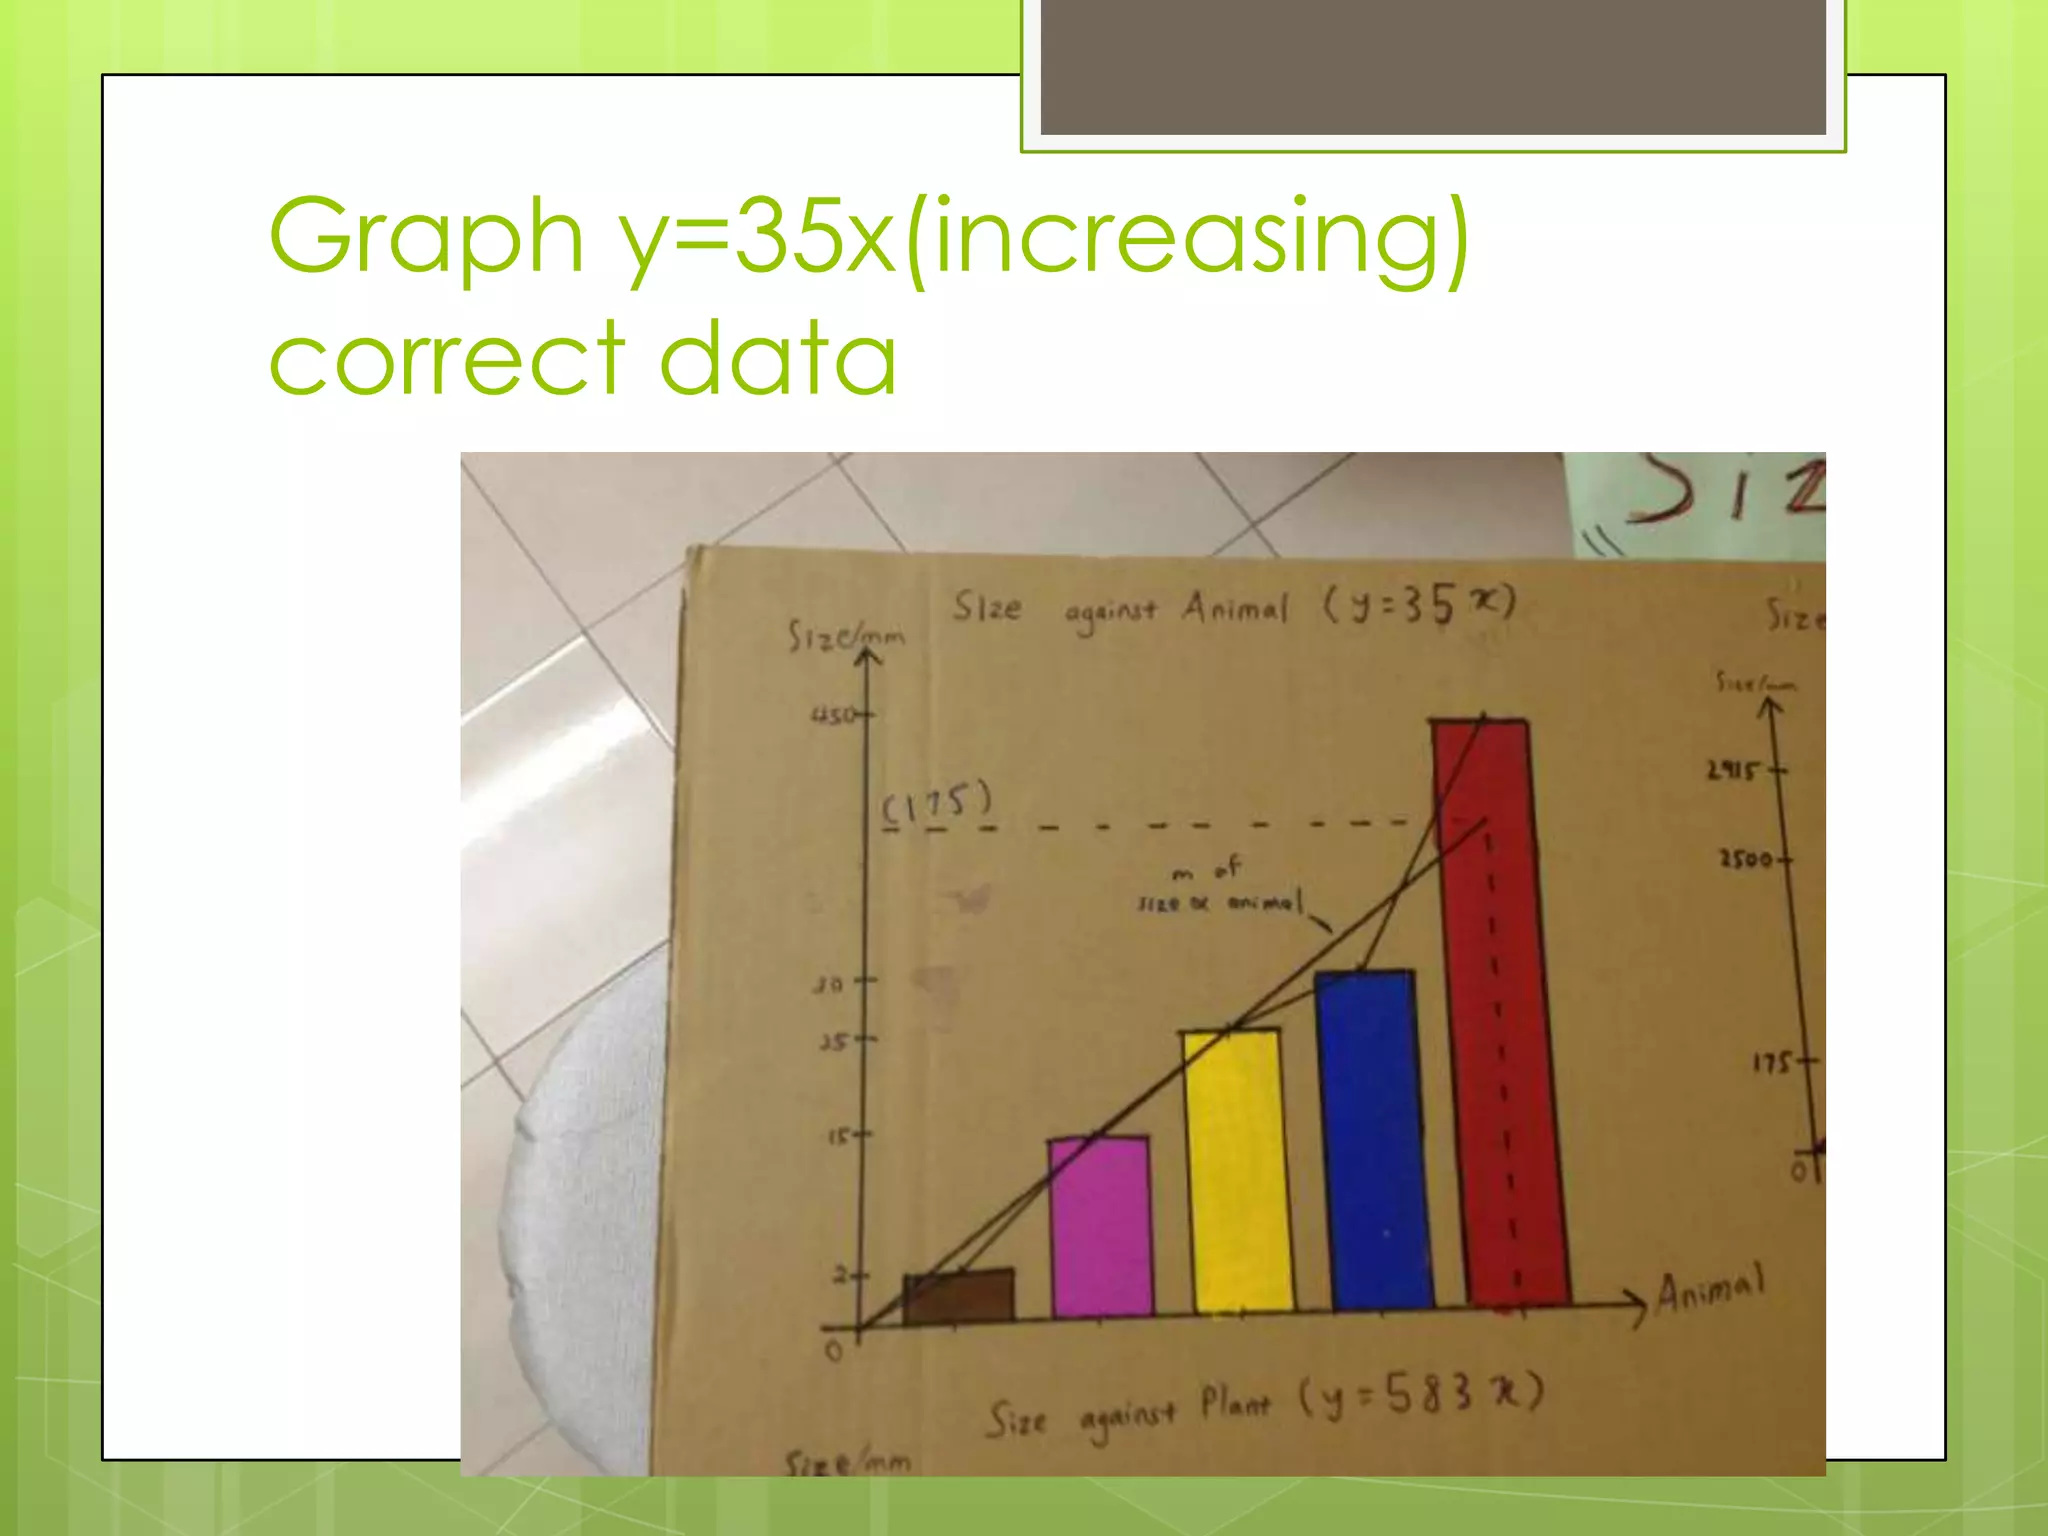
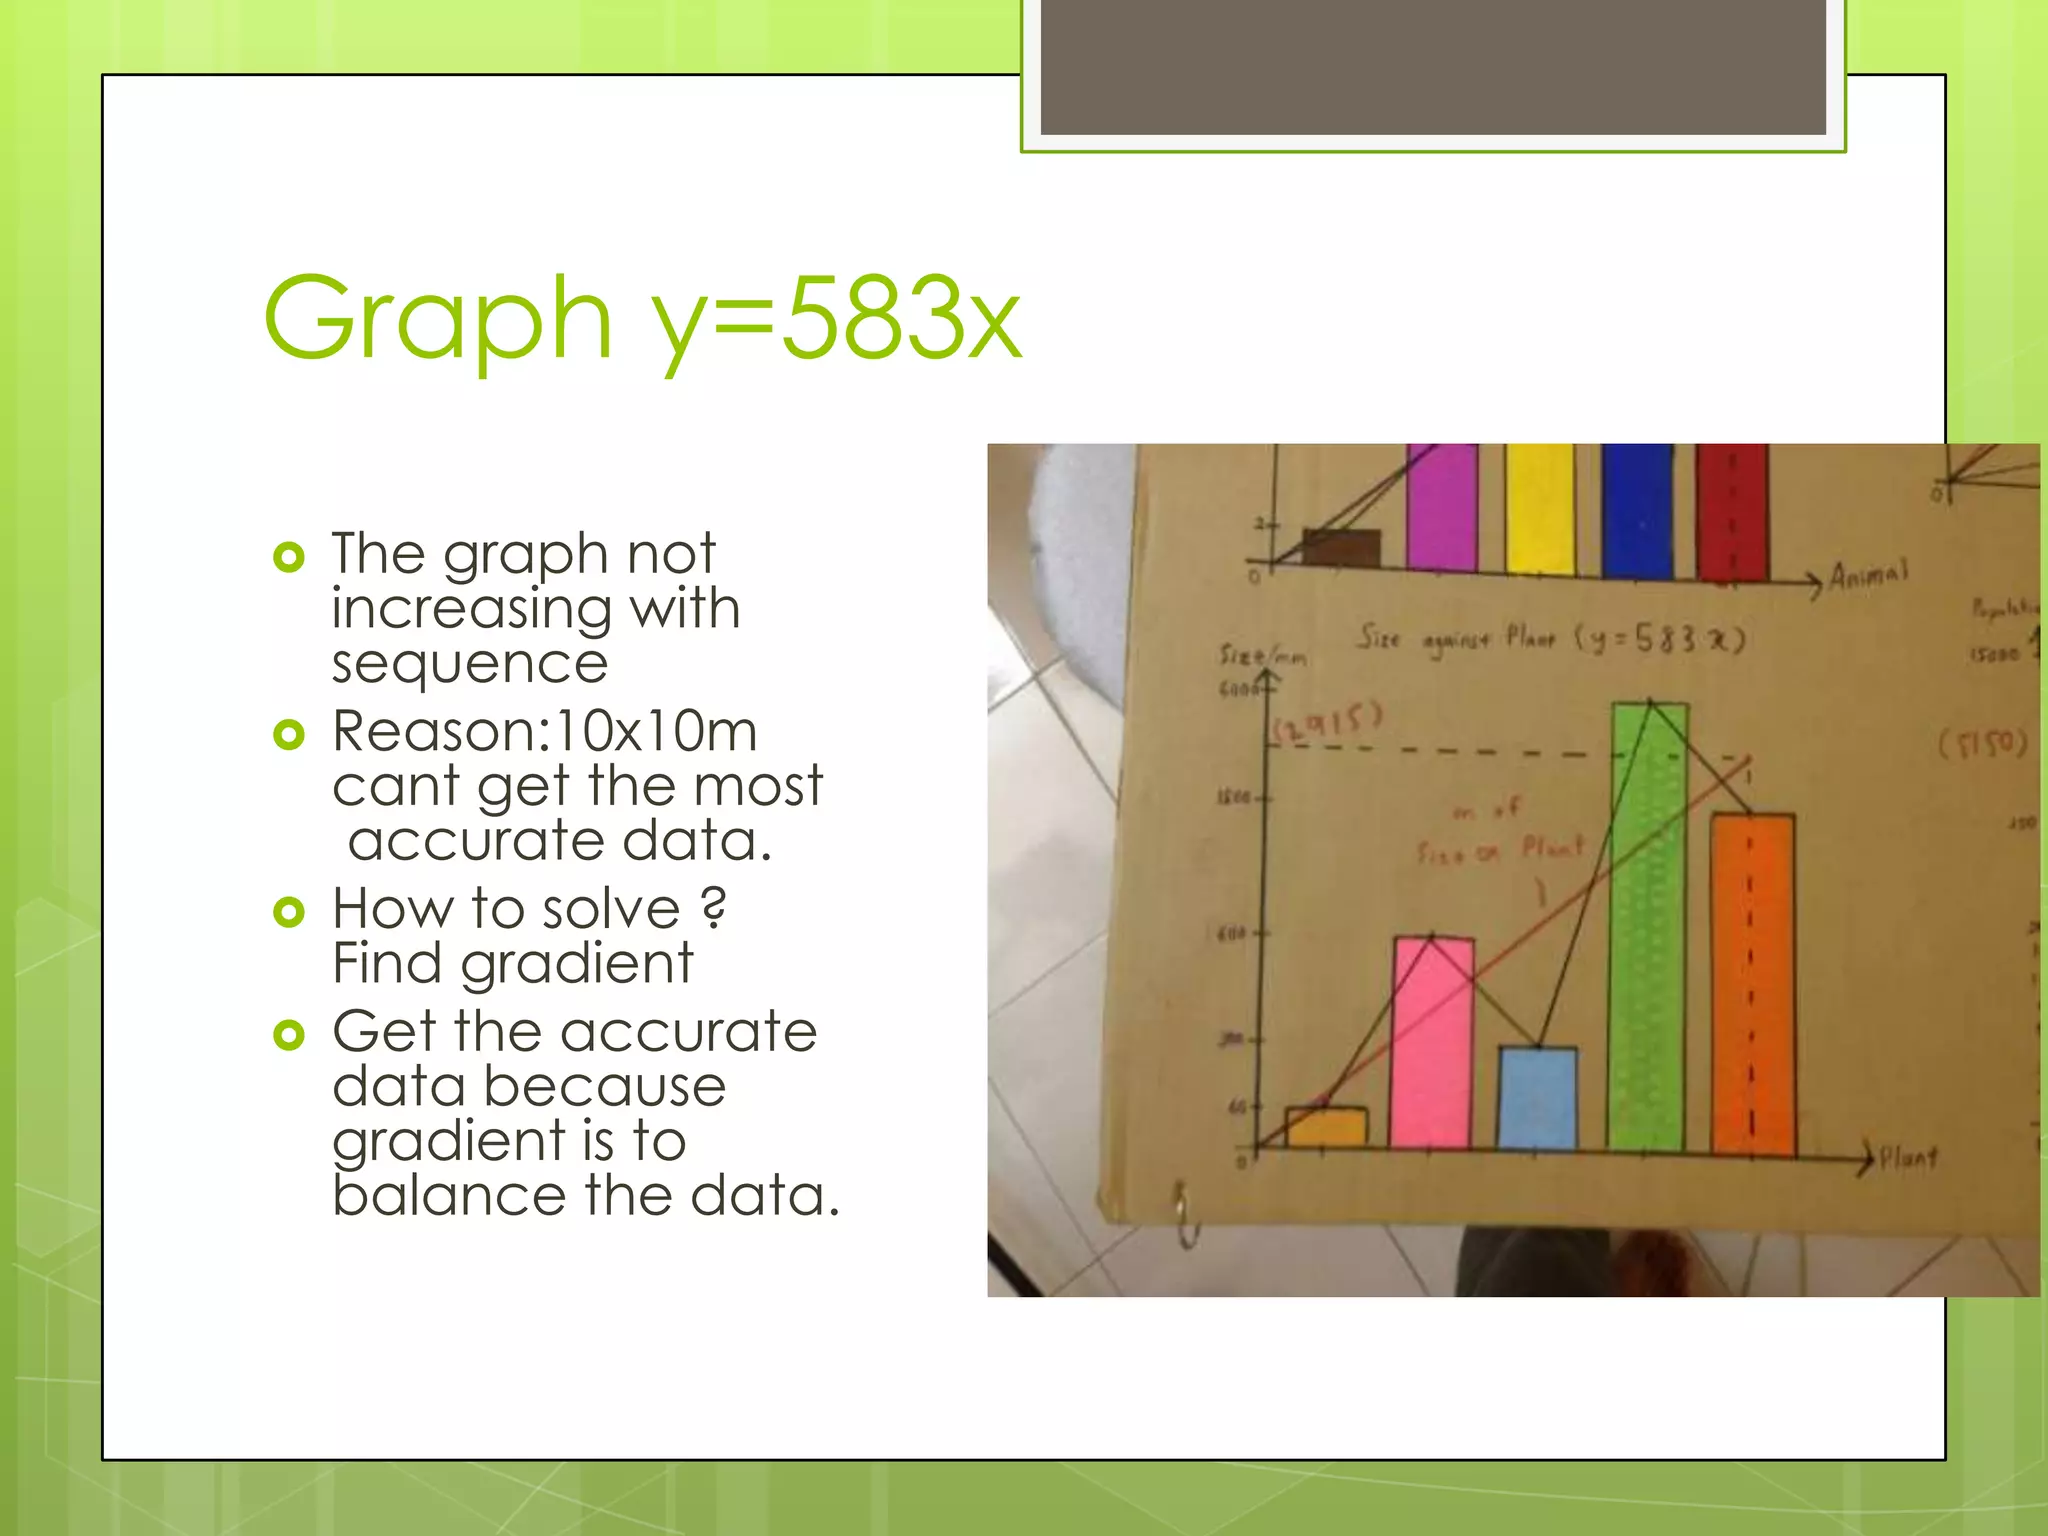
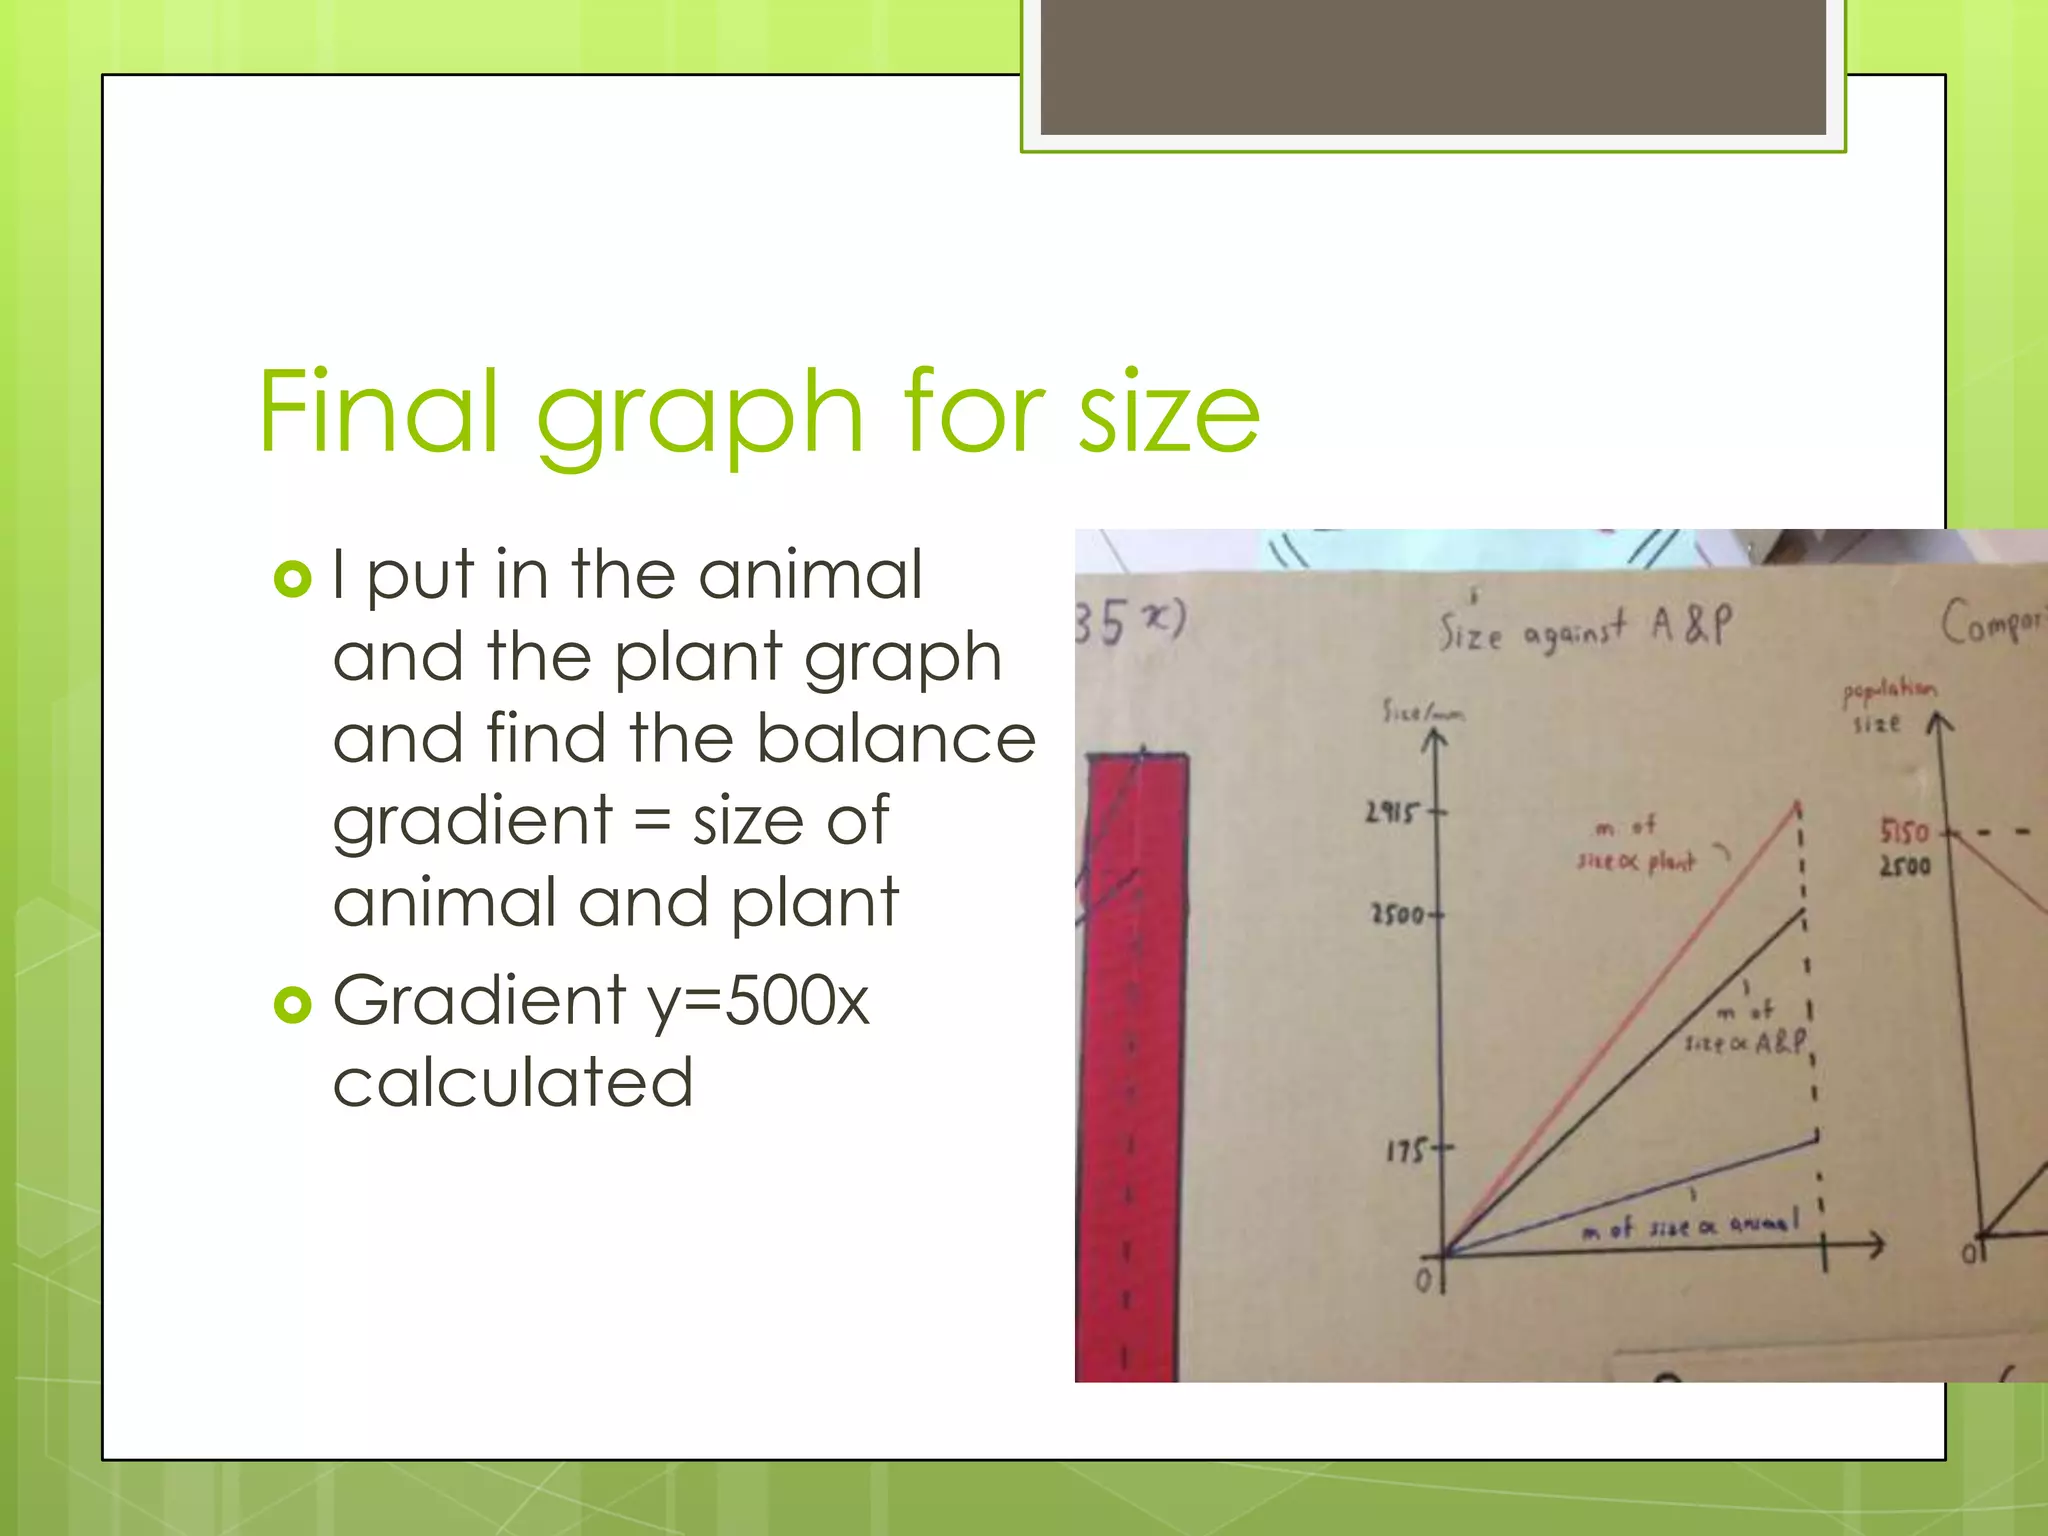

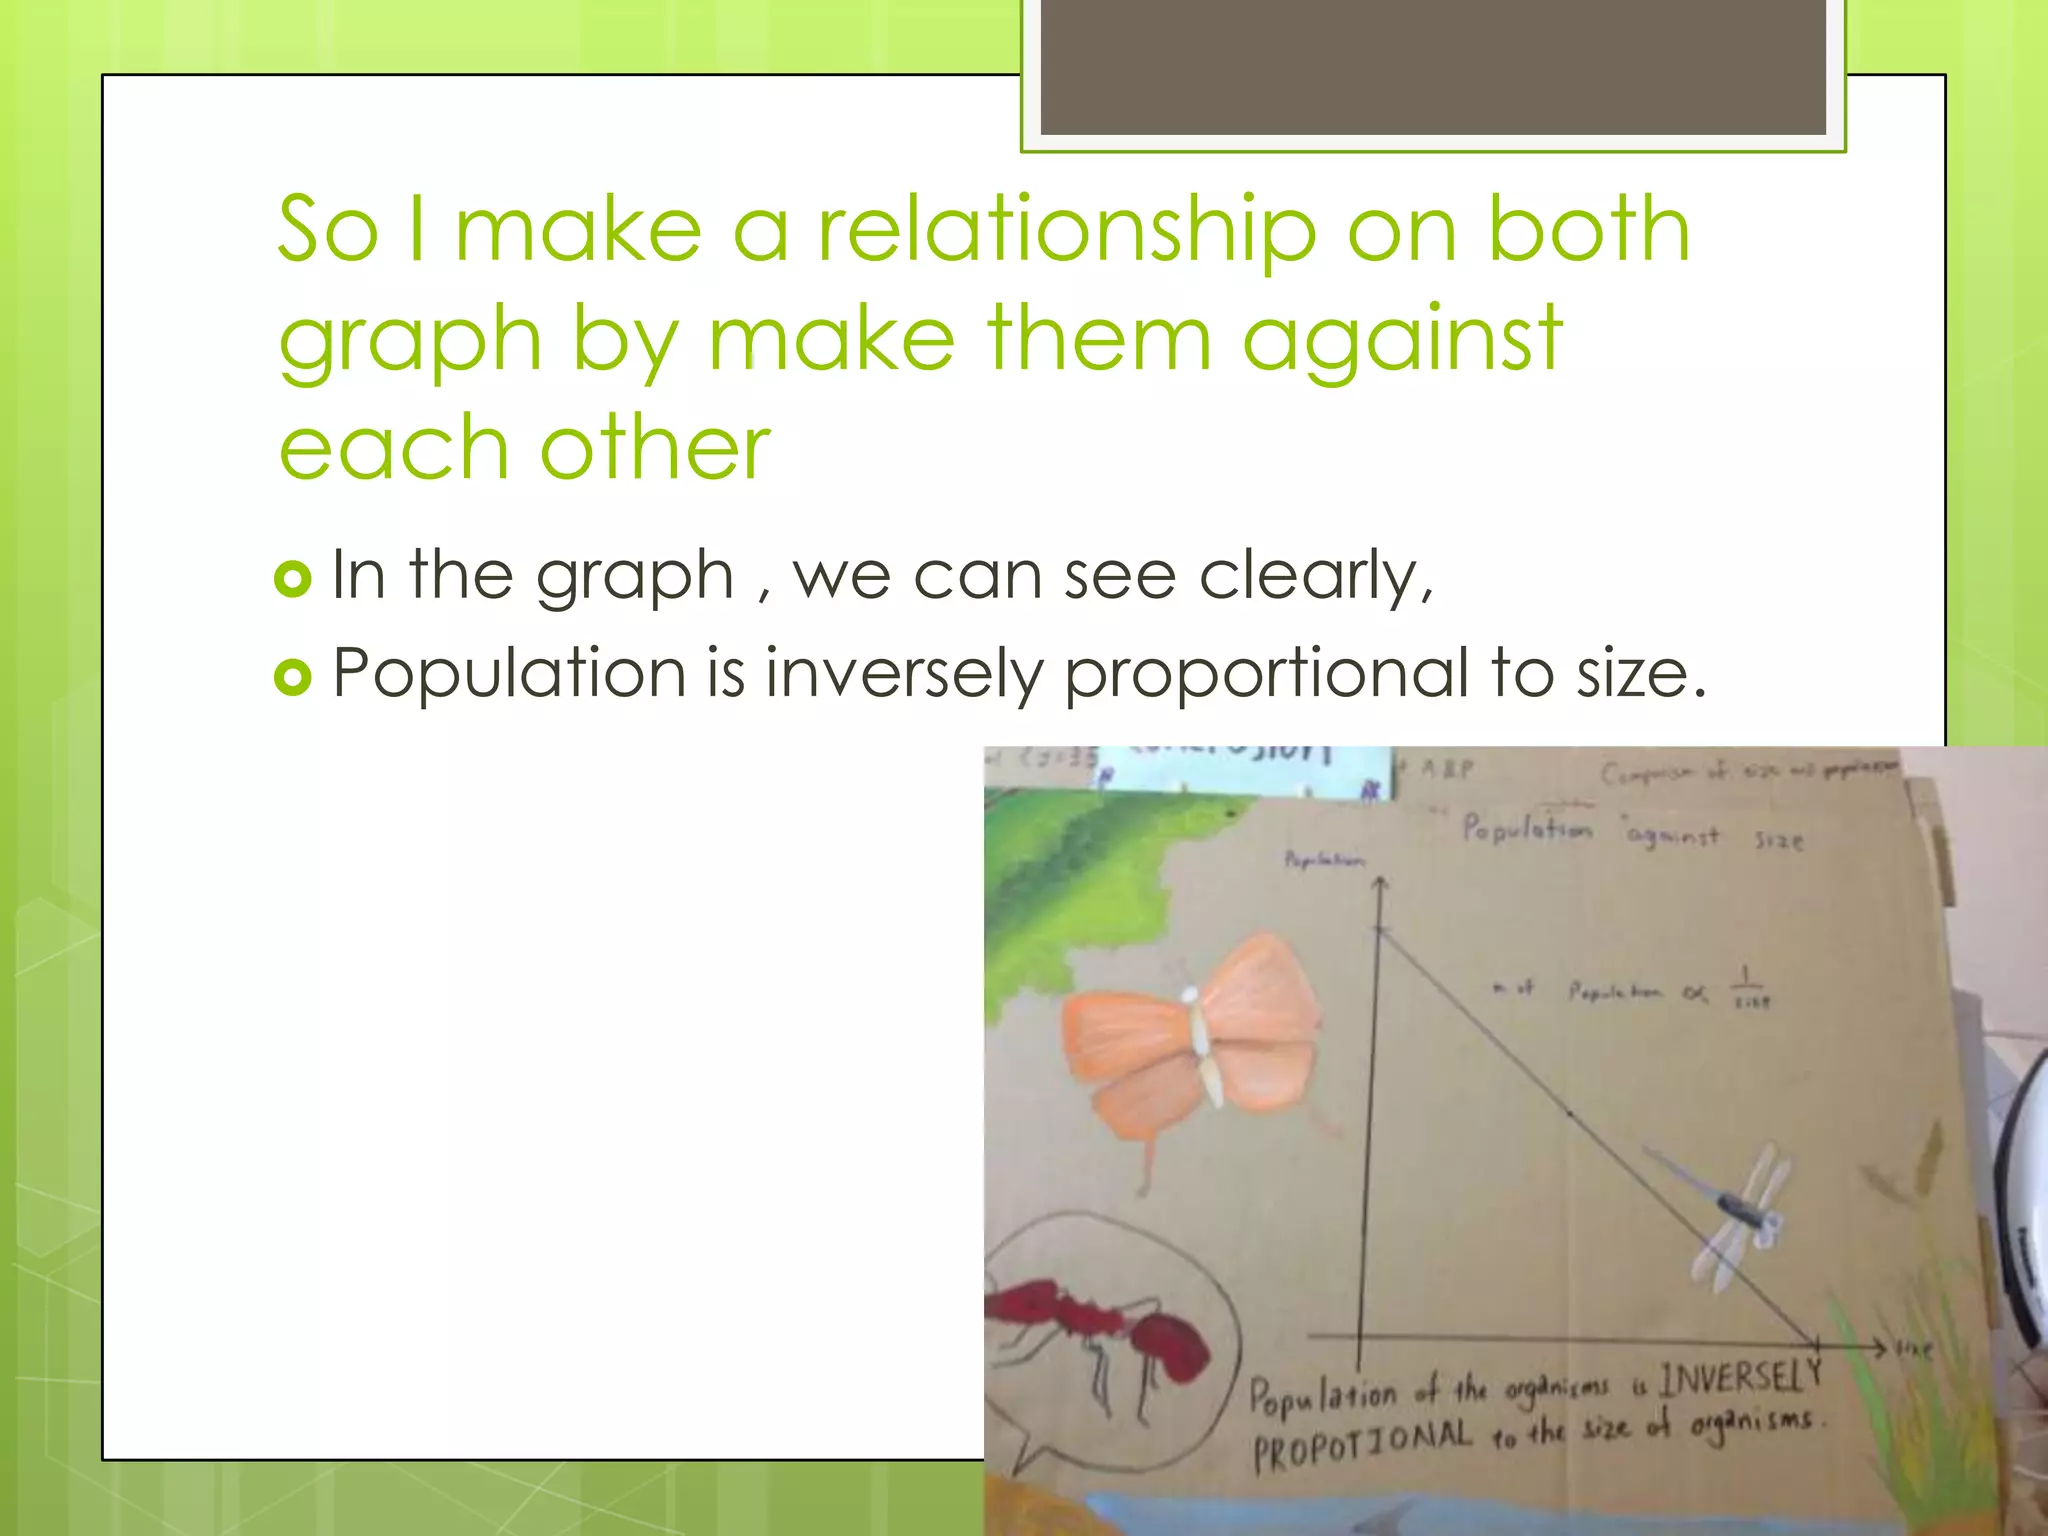


1) The document describes a student's individual project studying the population and size of organisms at a field site. 2) The student conducted experiments counting and measuring different plants and animals, and used marking and recapturing techniques to estimate ant populations. 3) Graphs of the results showed relationships between population sizes and organism sizes, with populations being inversely related to sizes.


