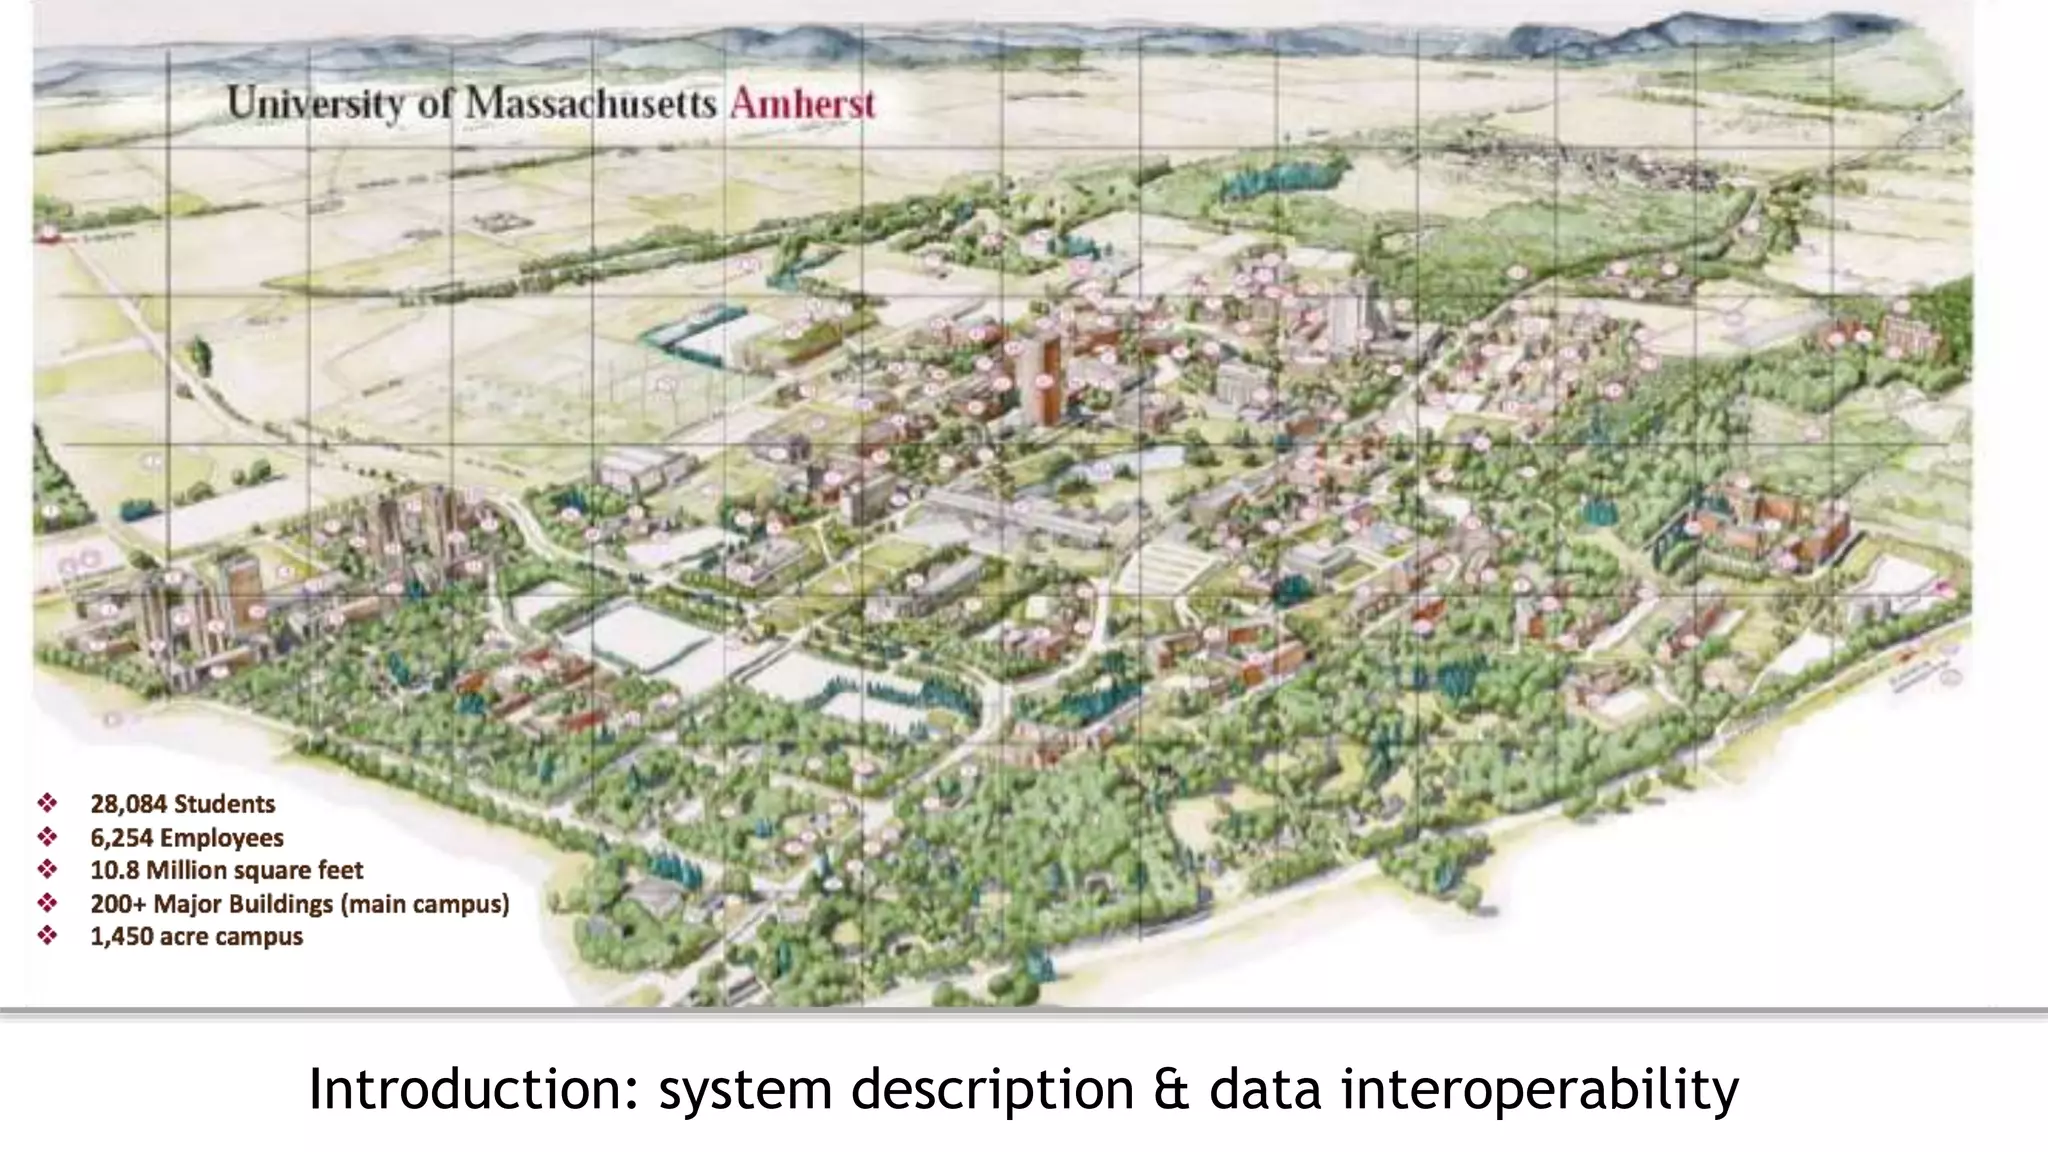
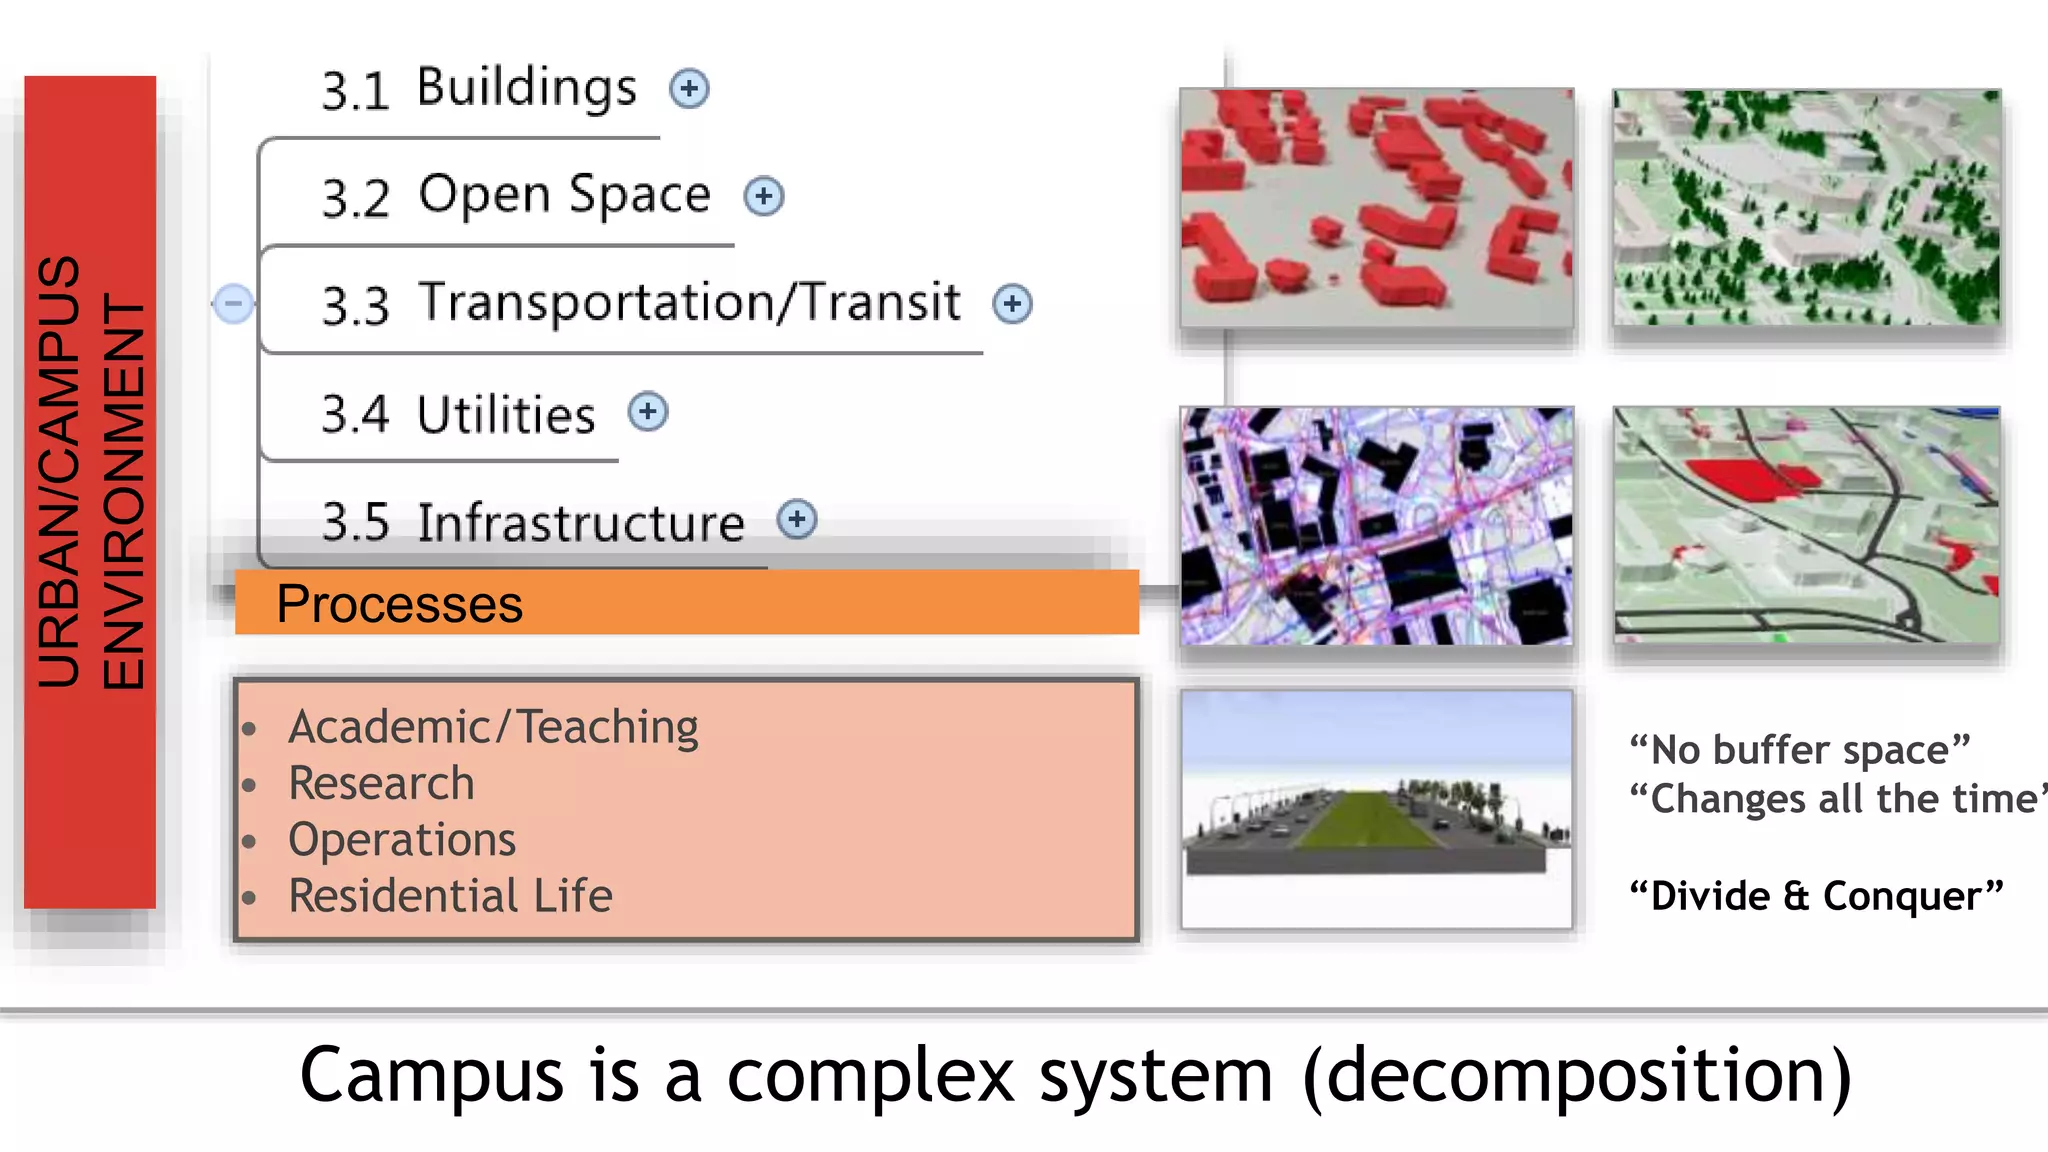
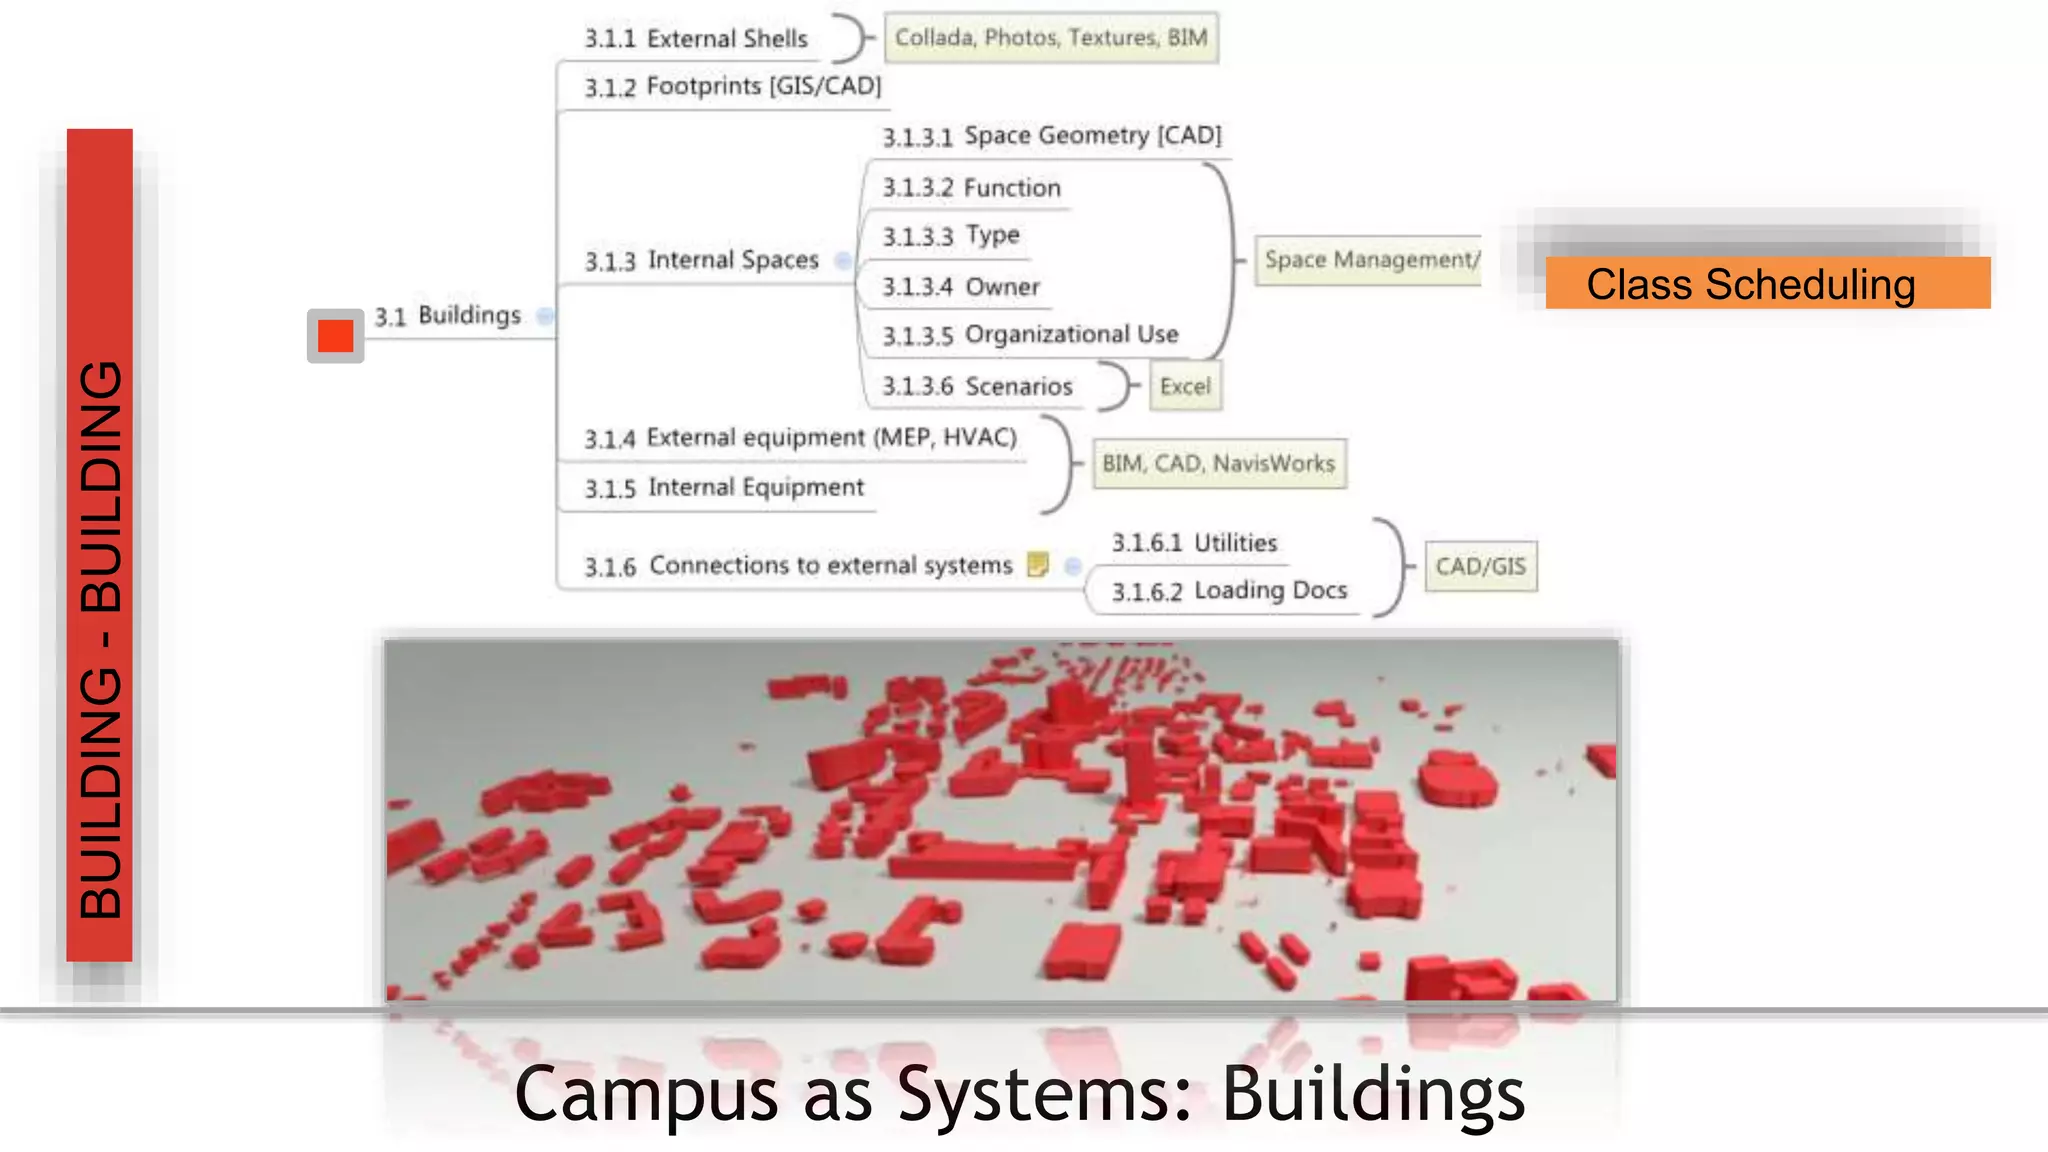
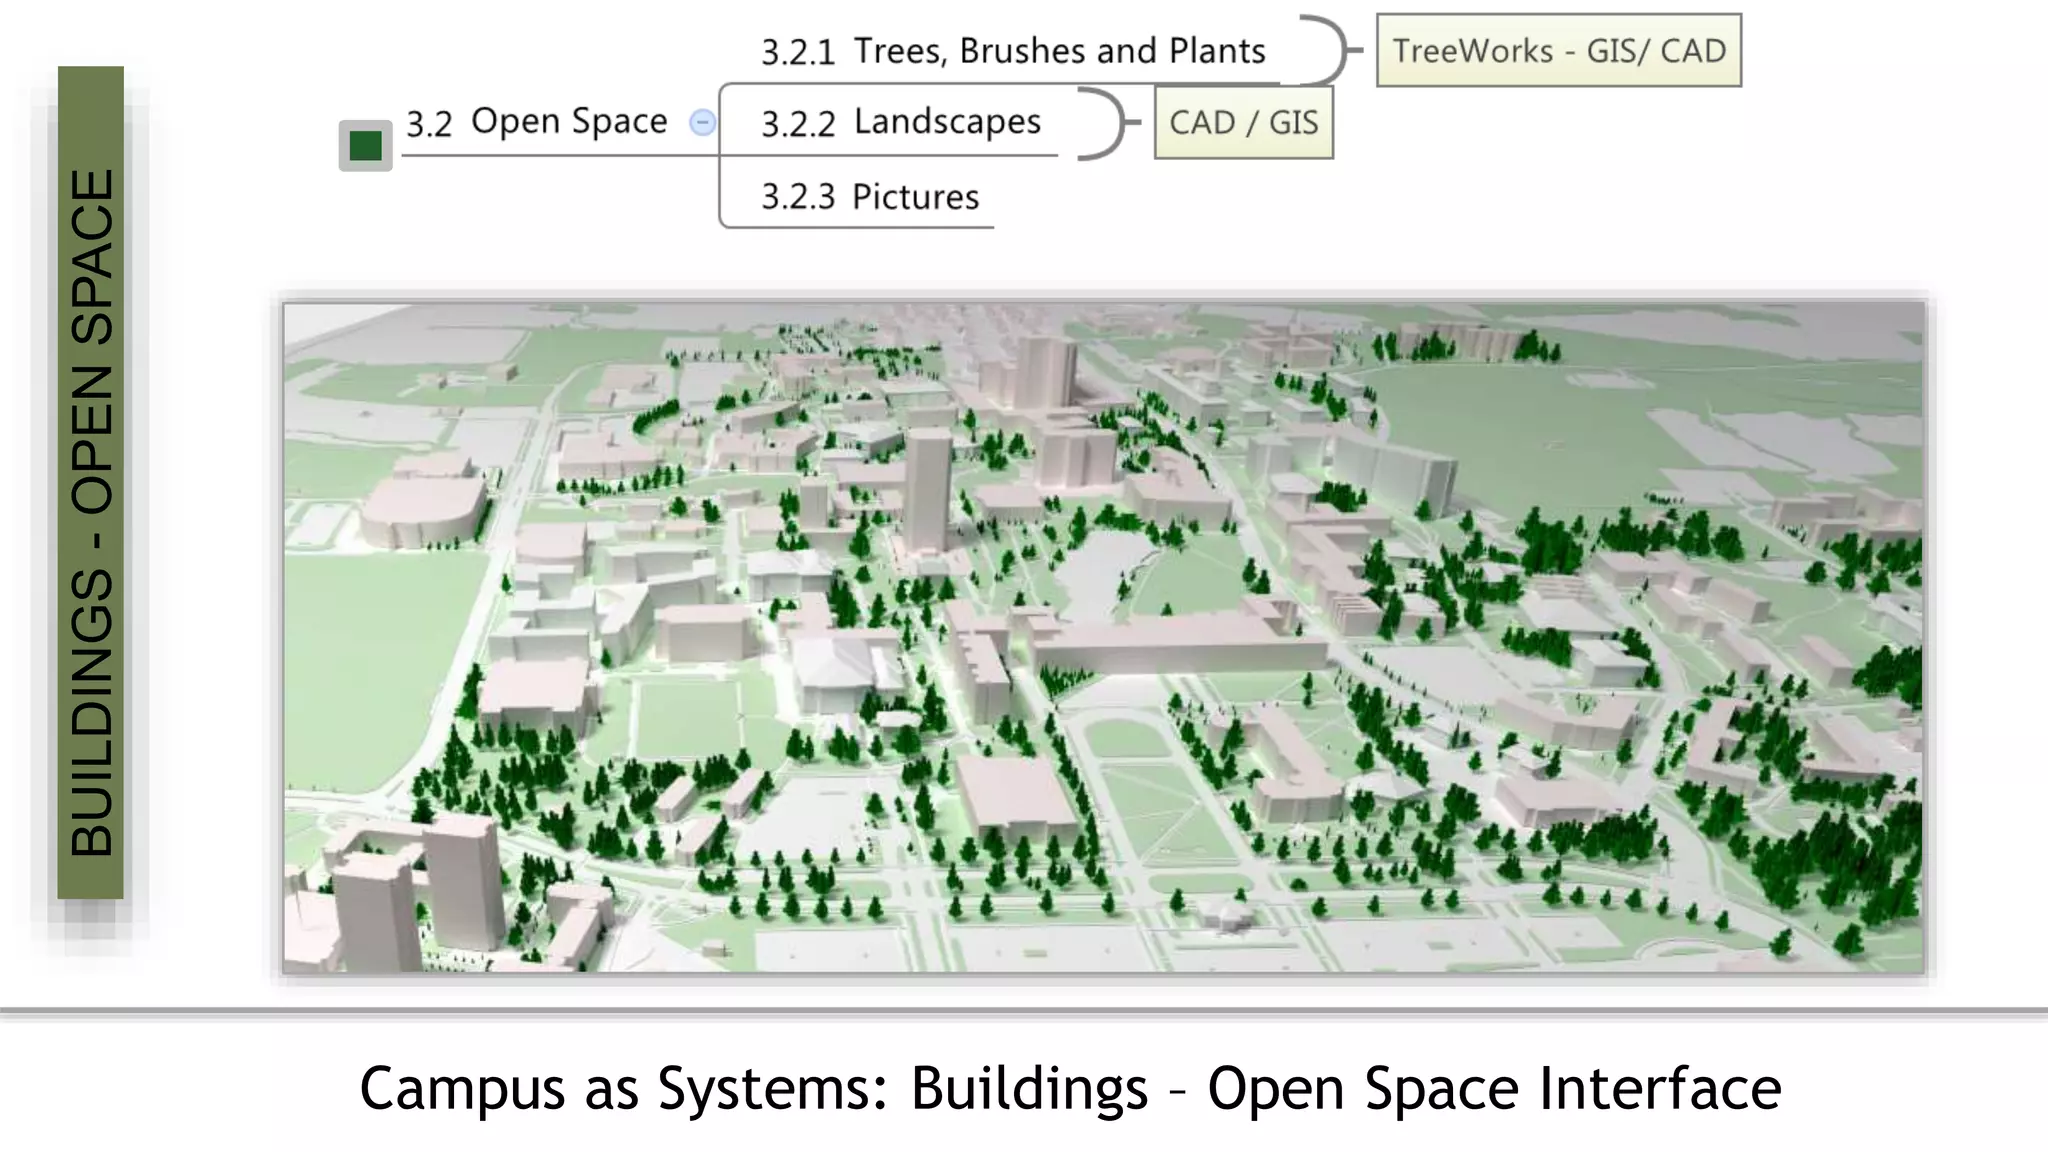
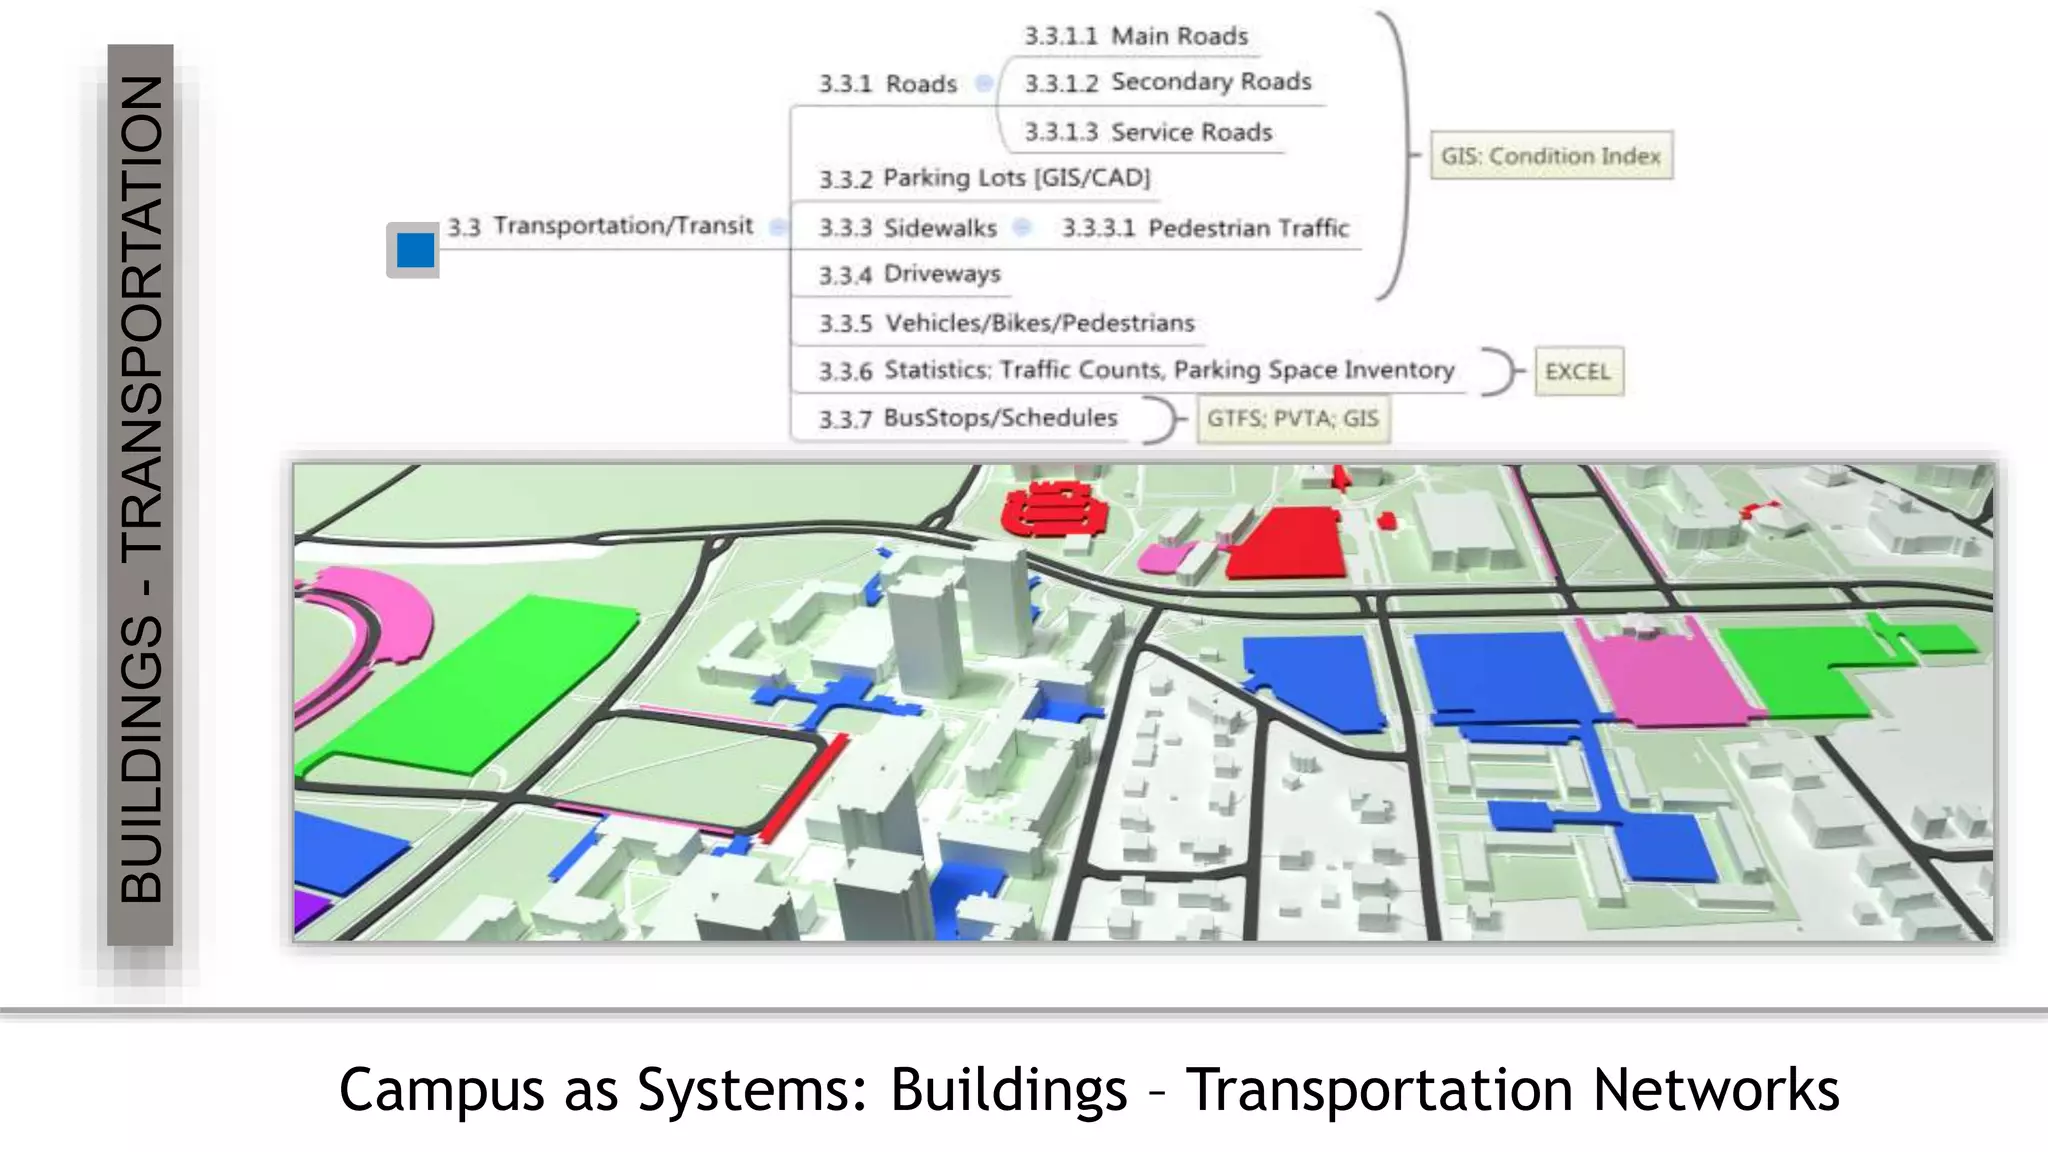
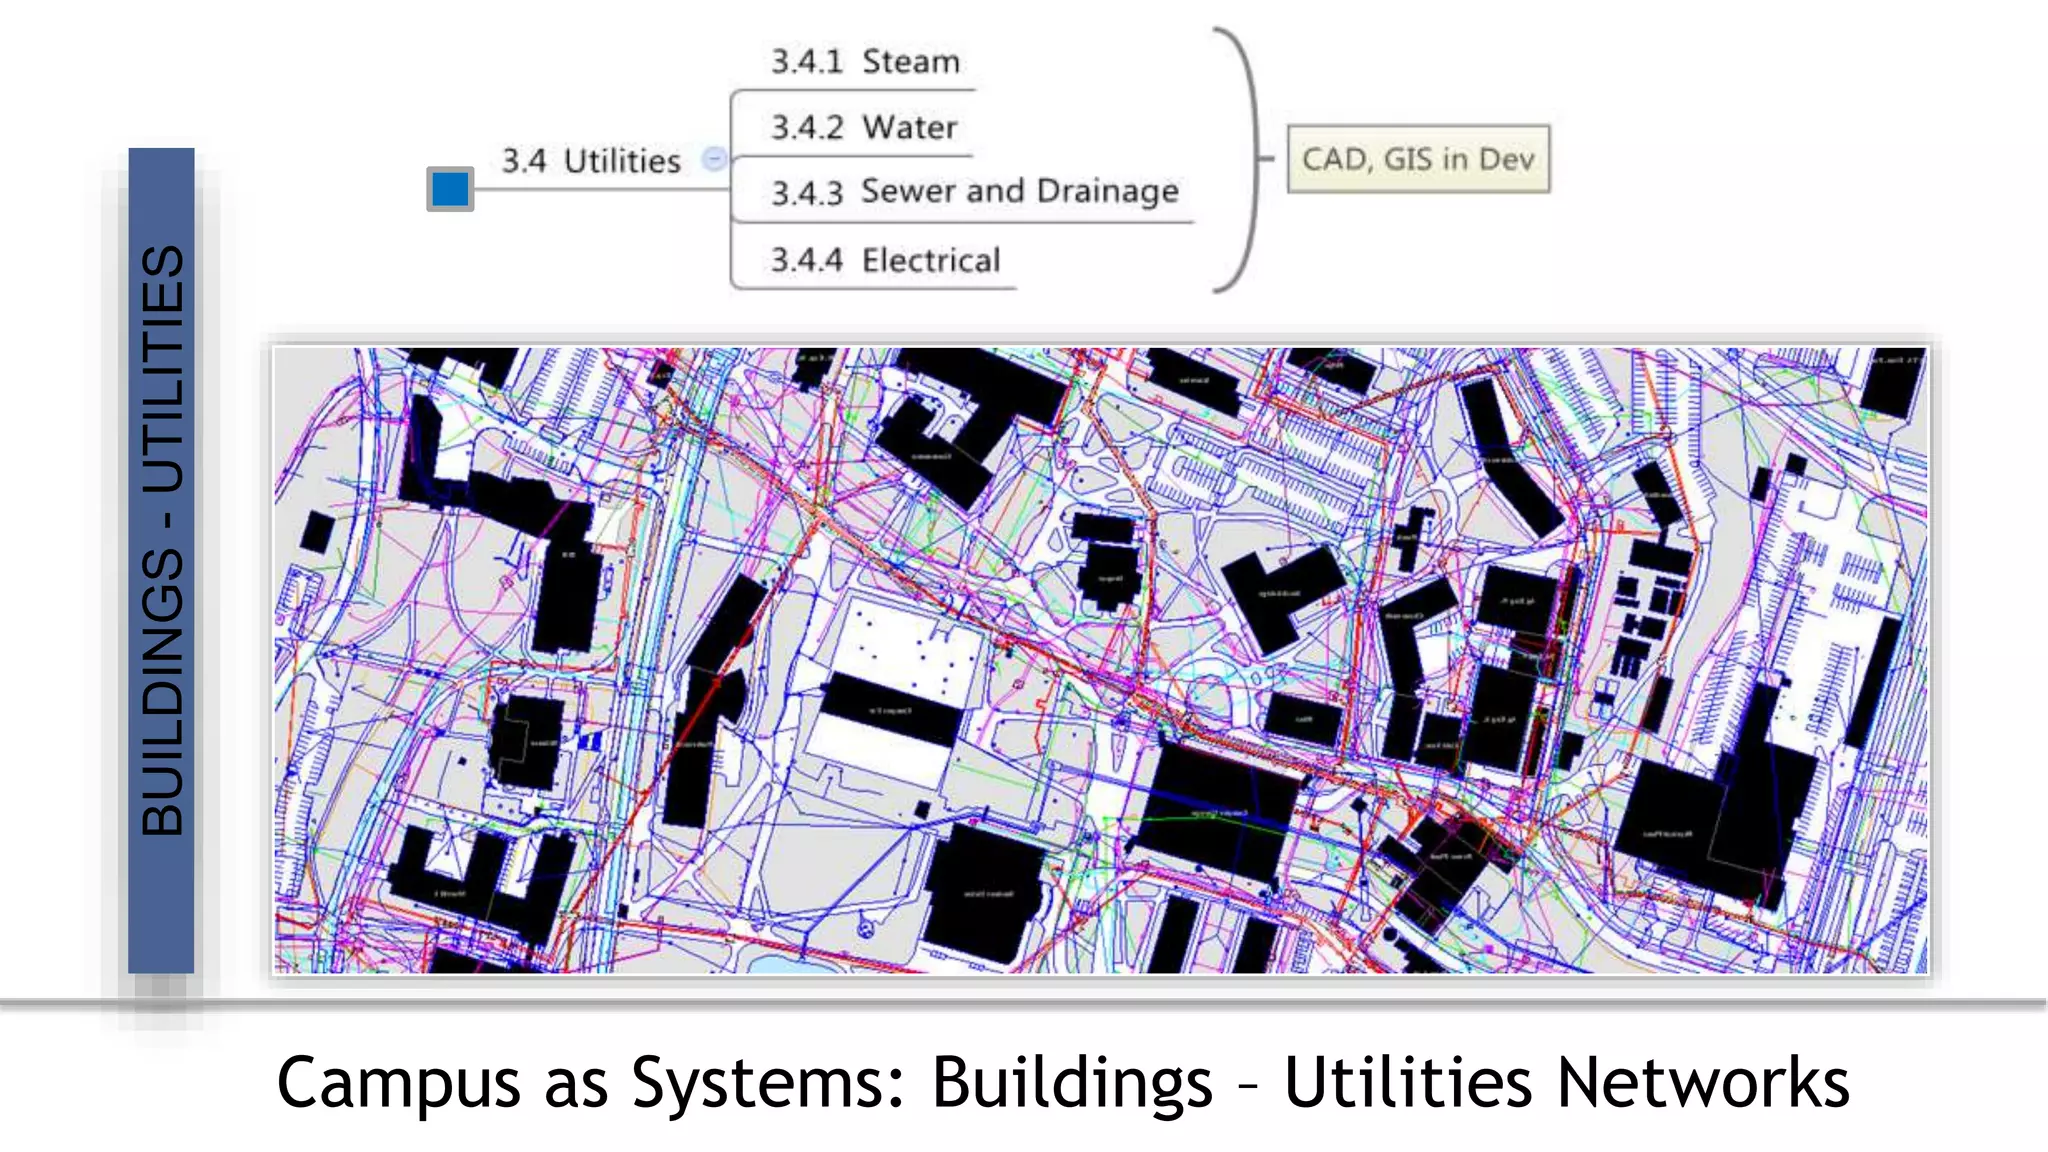
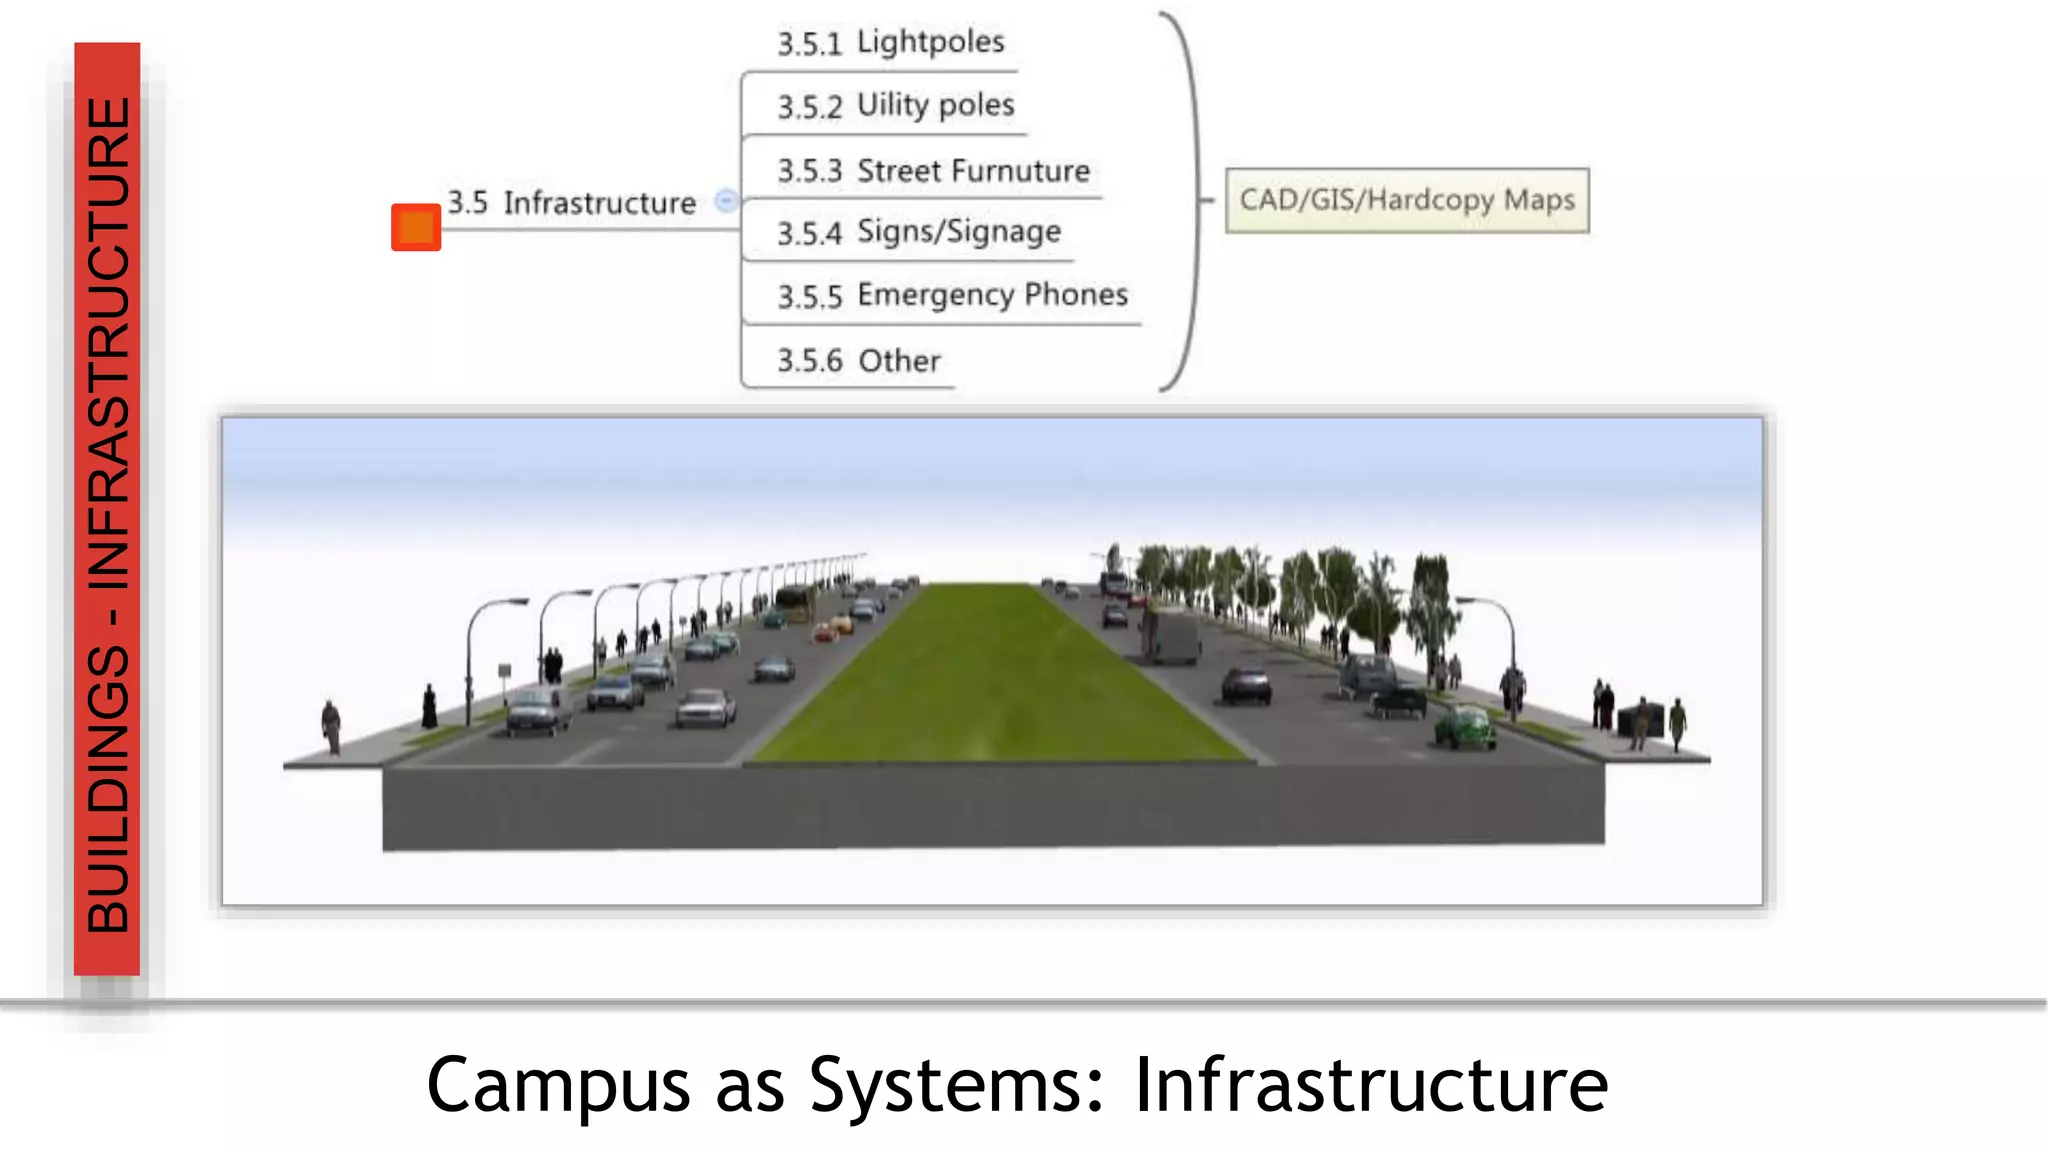
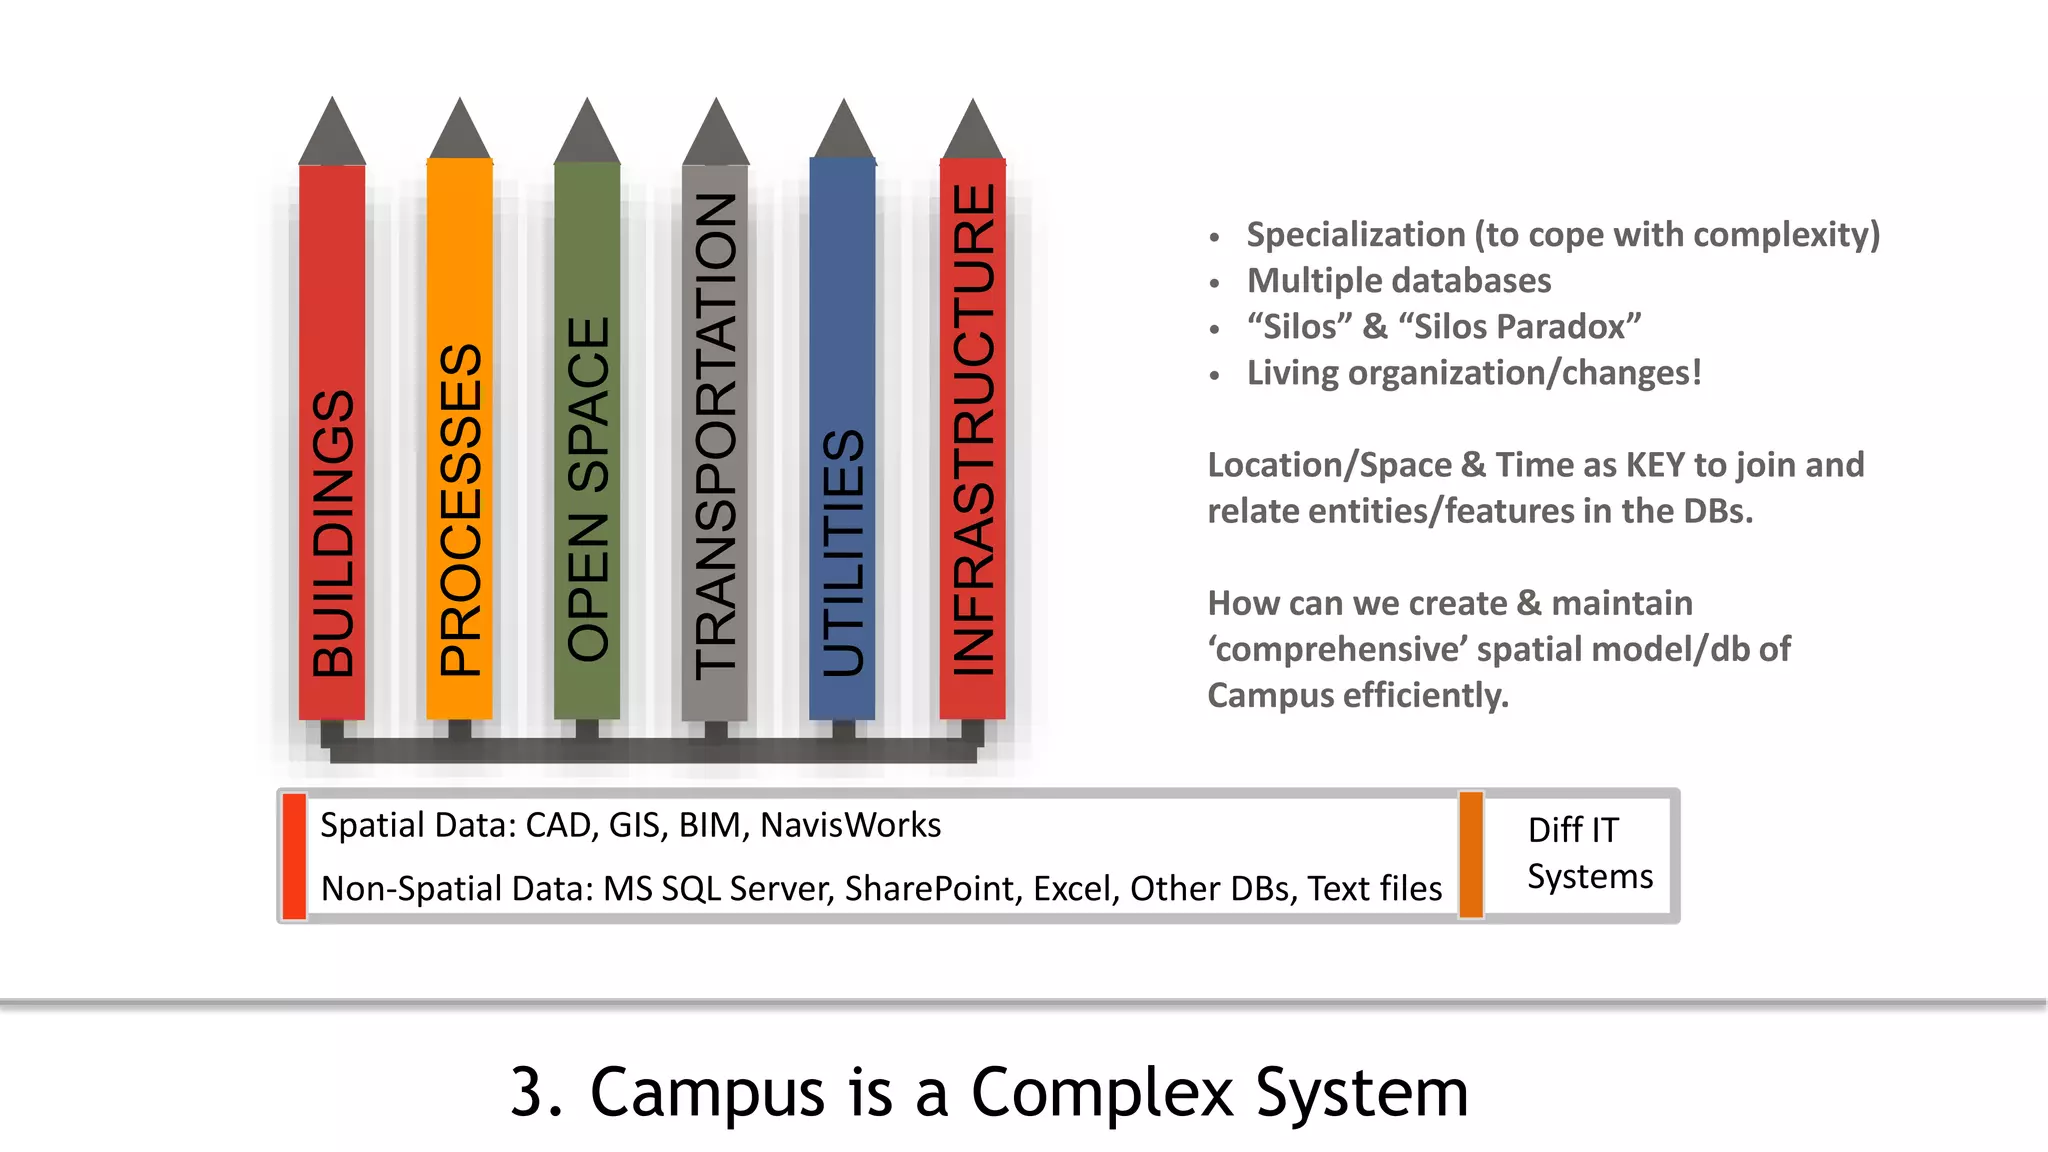
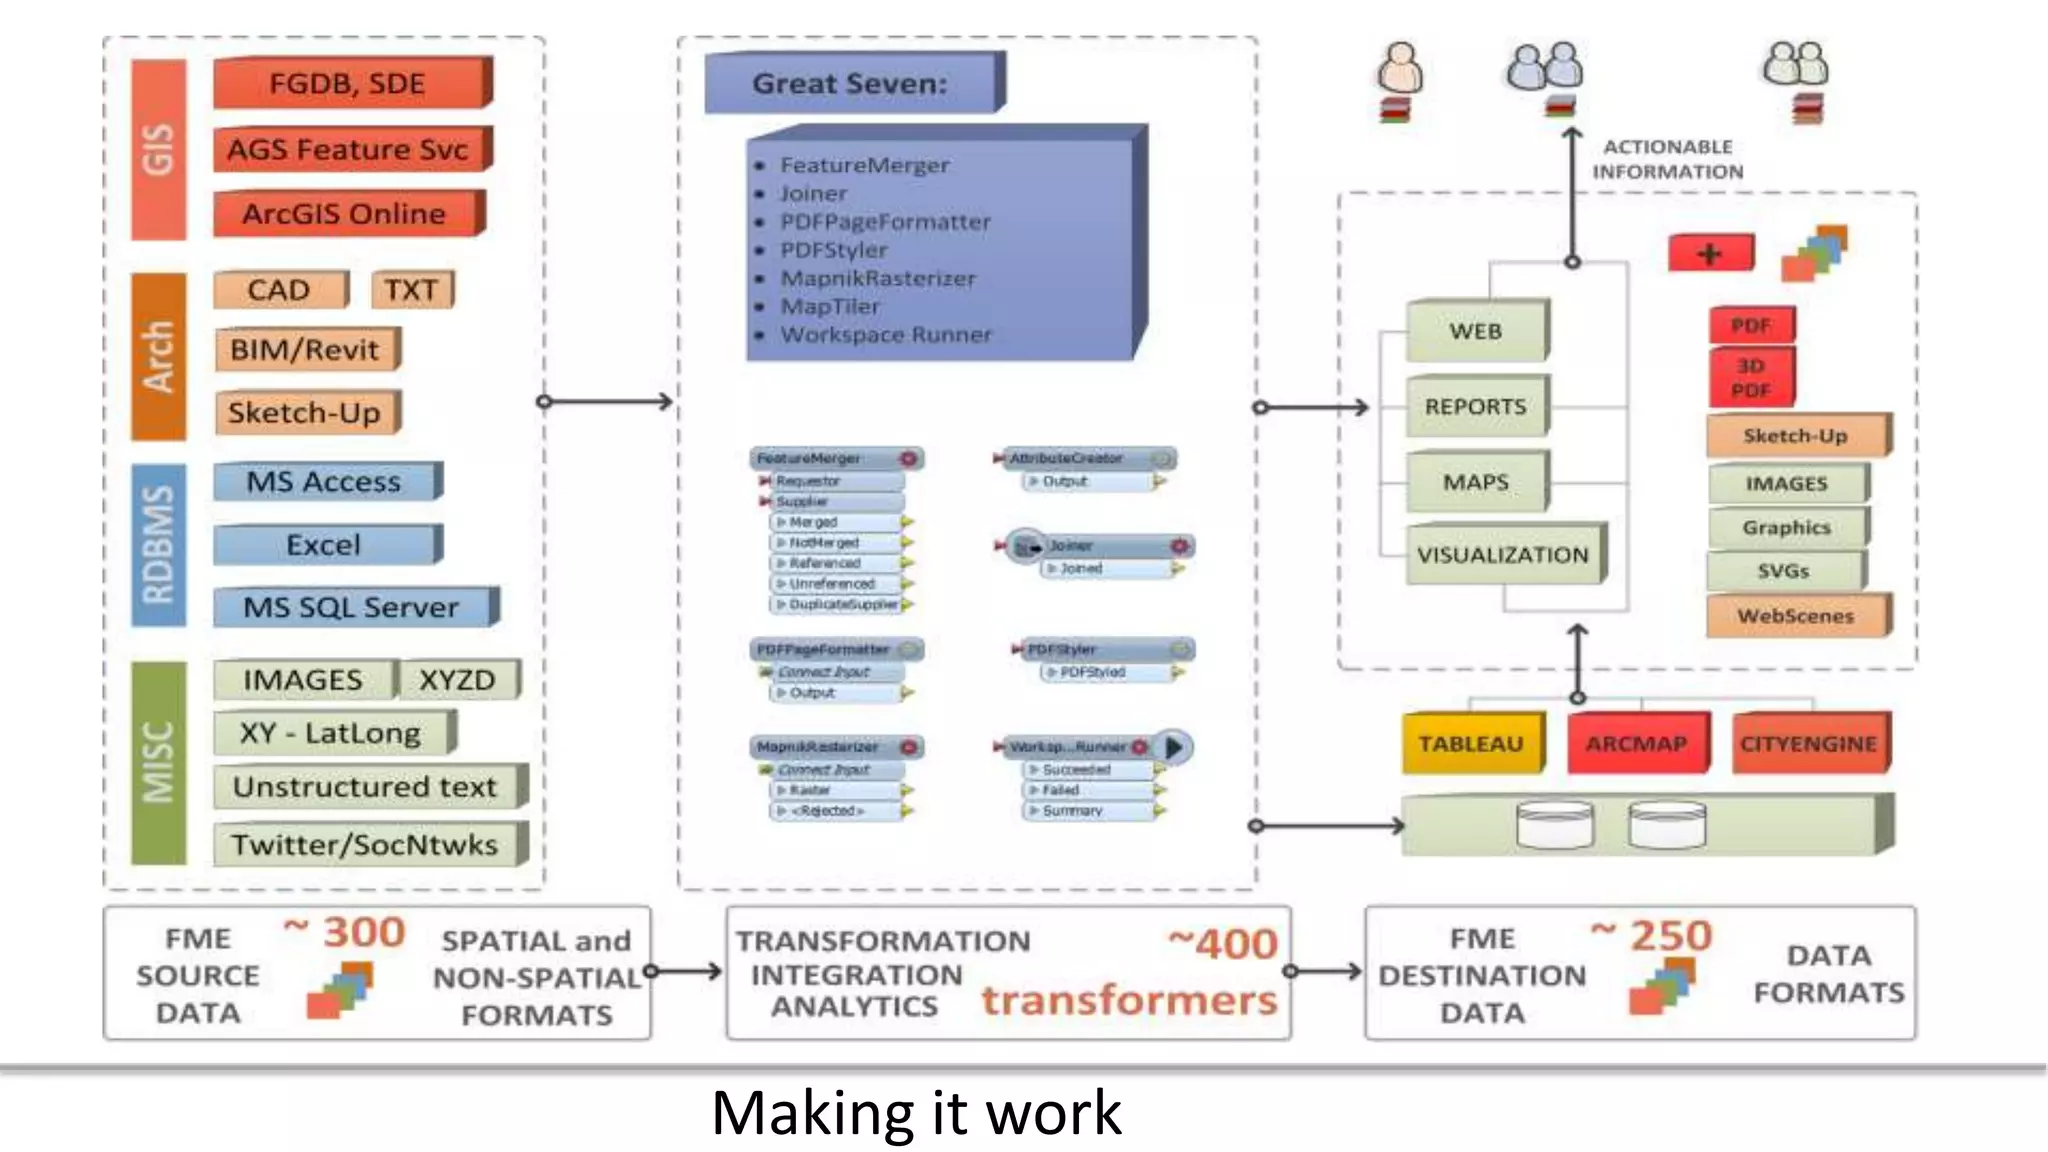
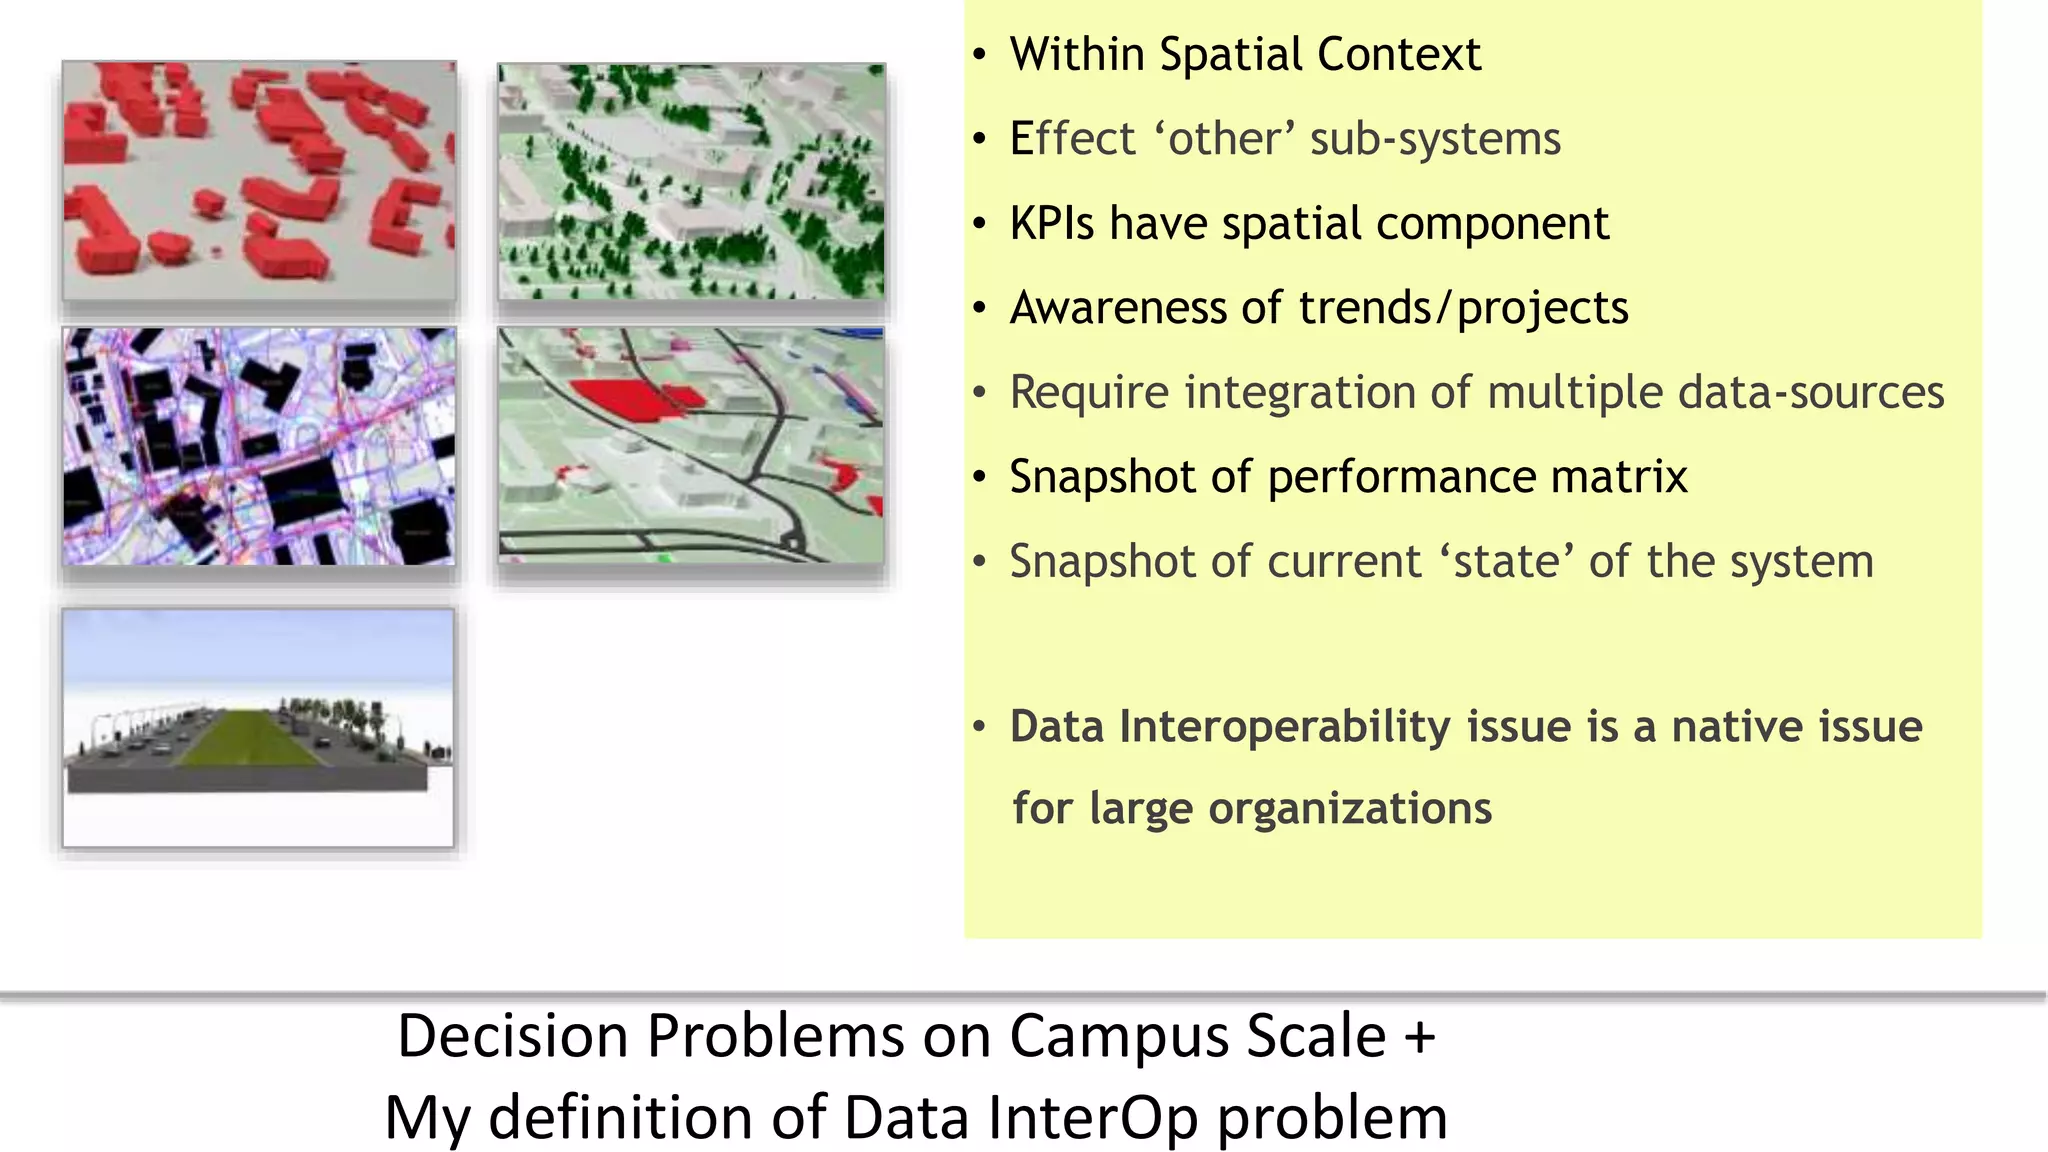
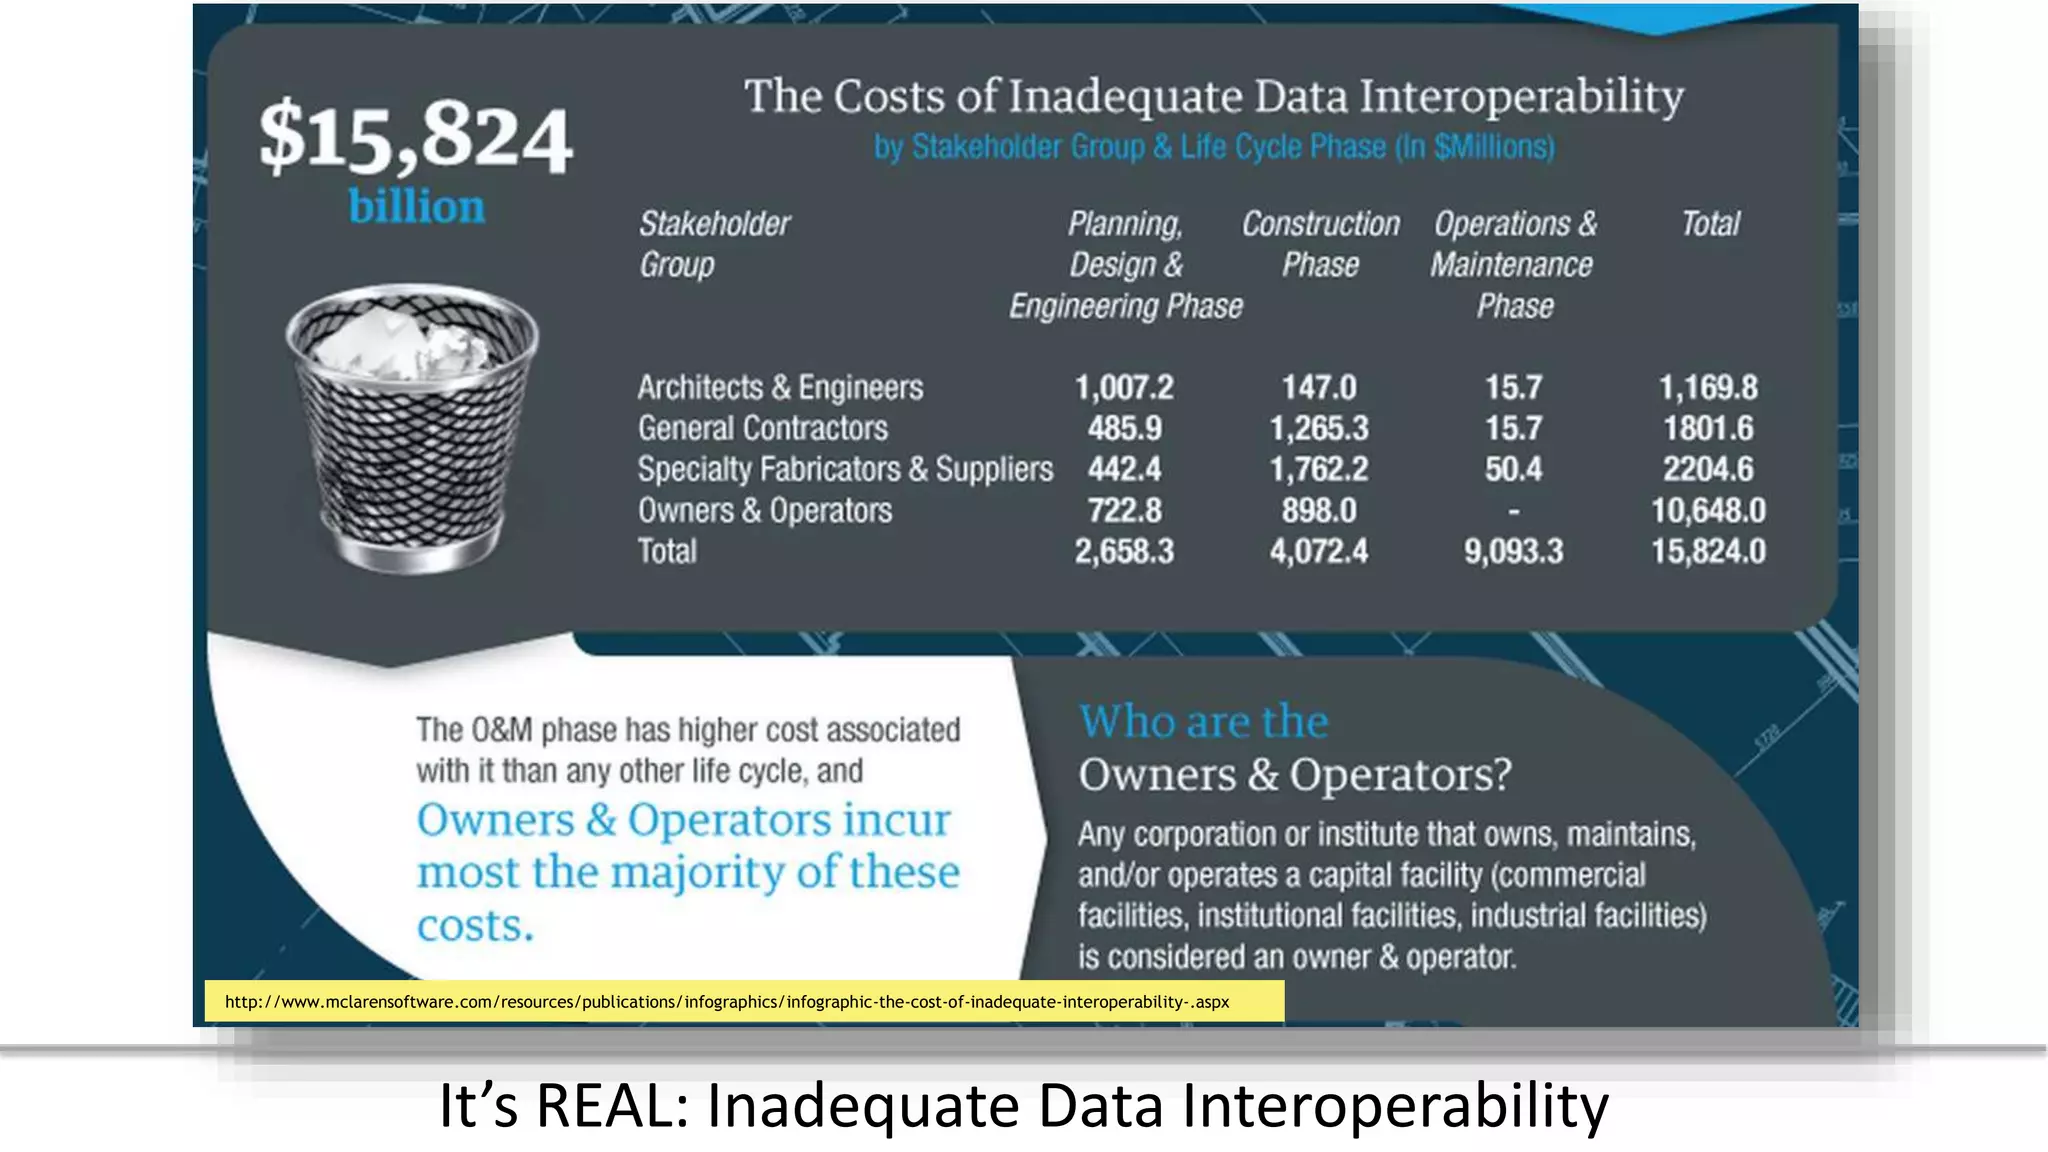
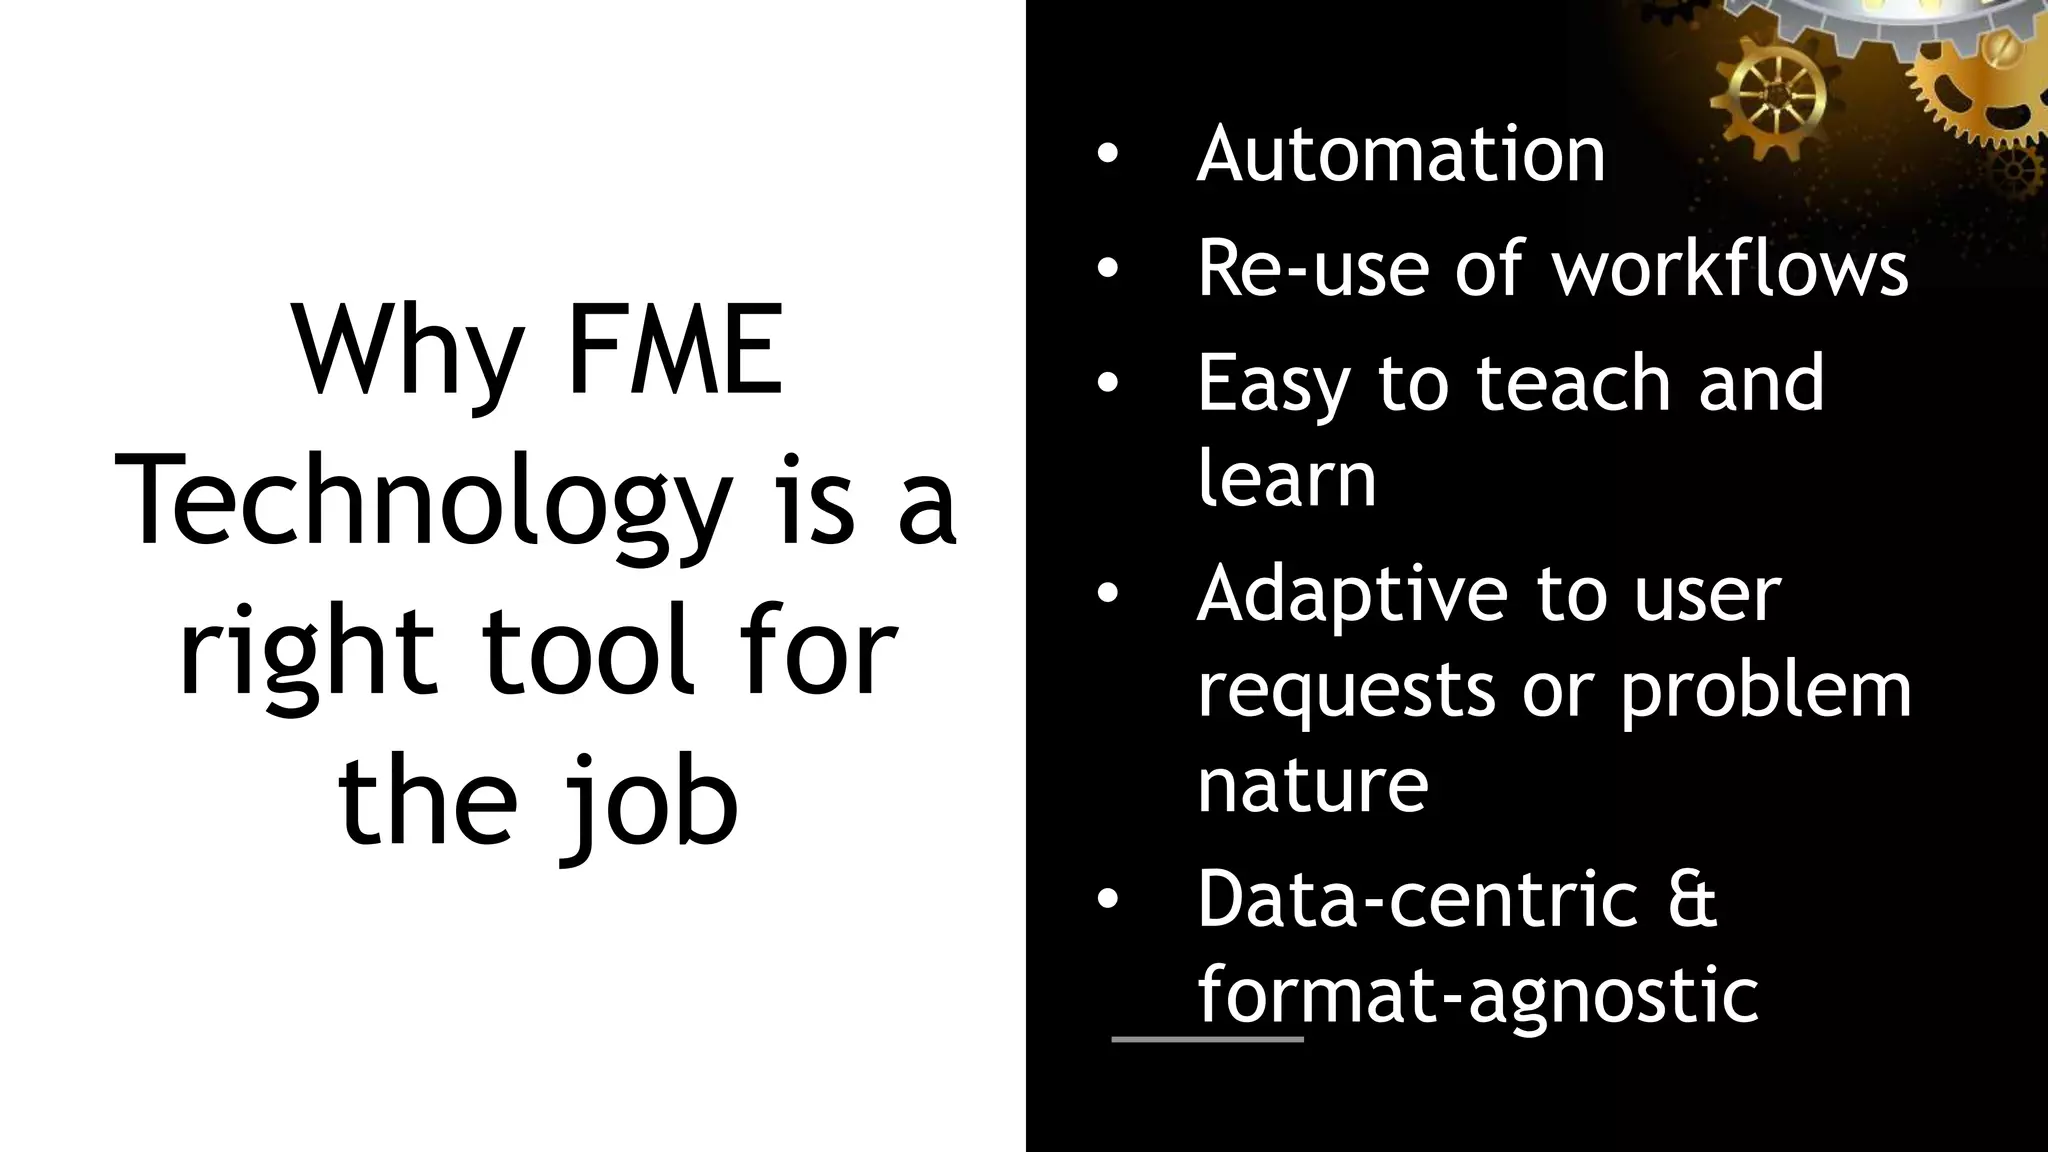
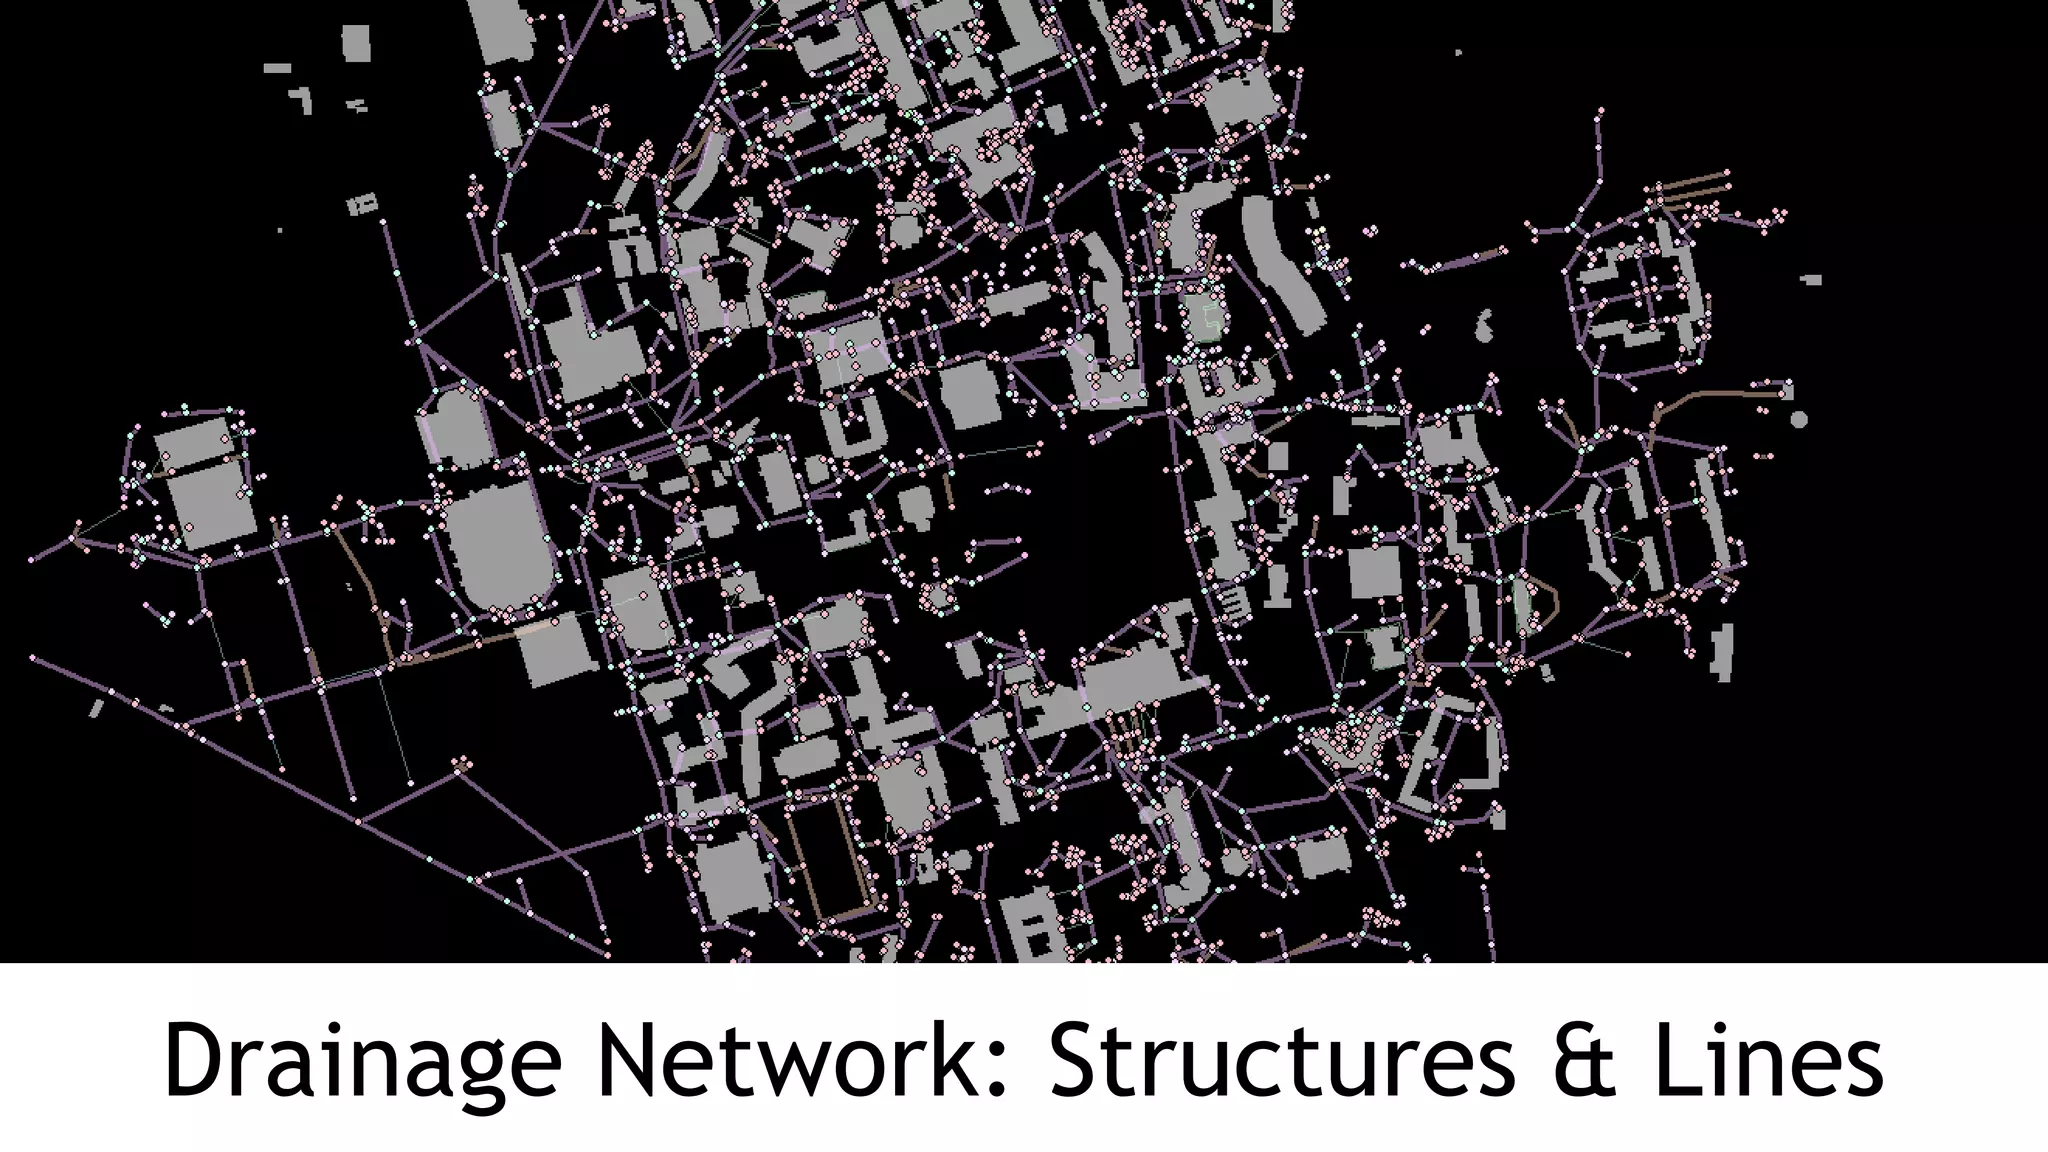
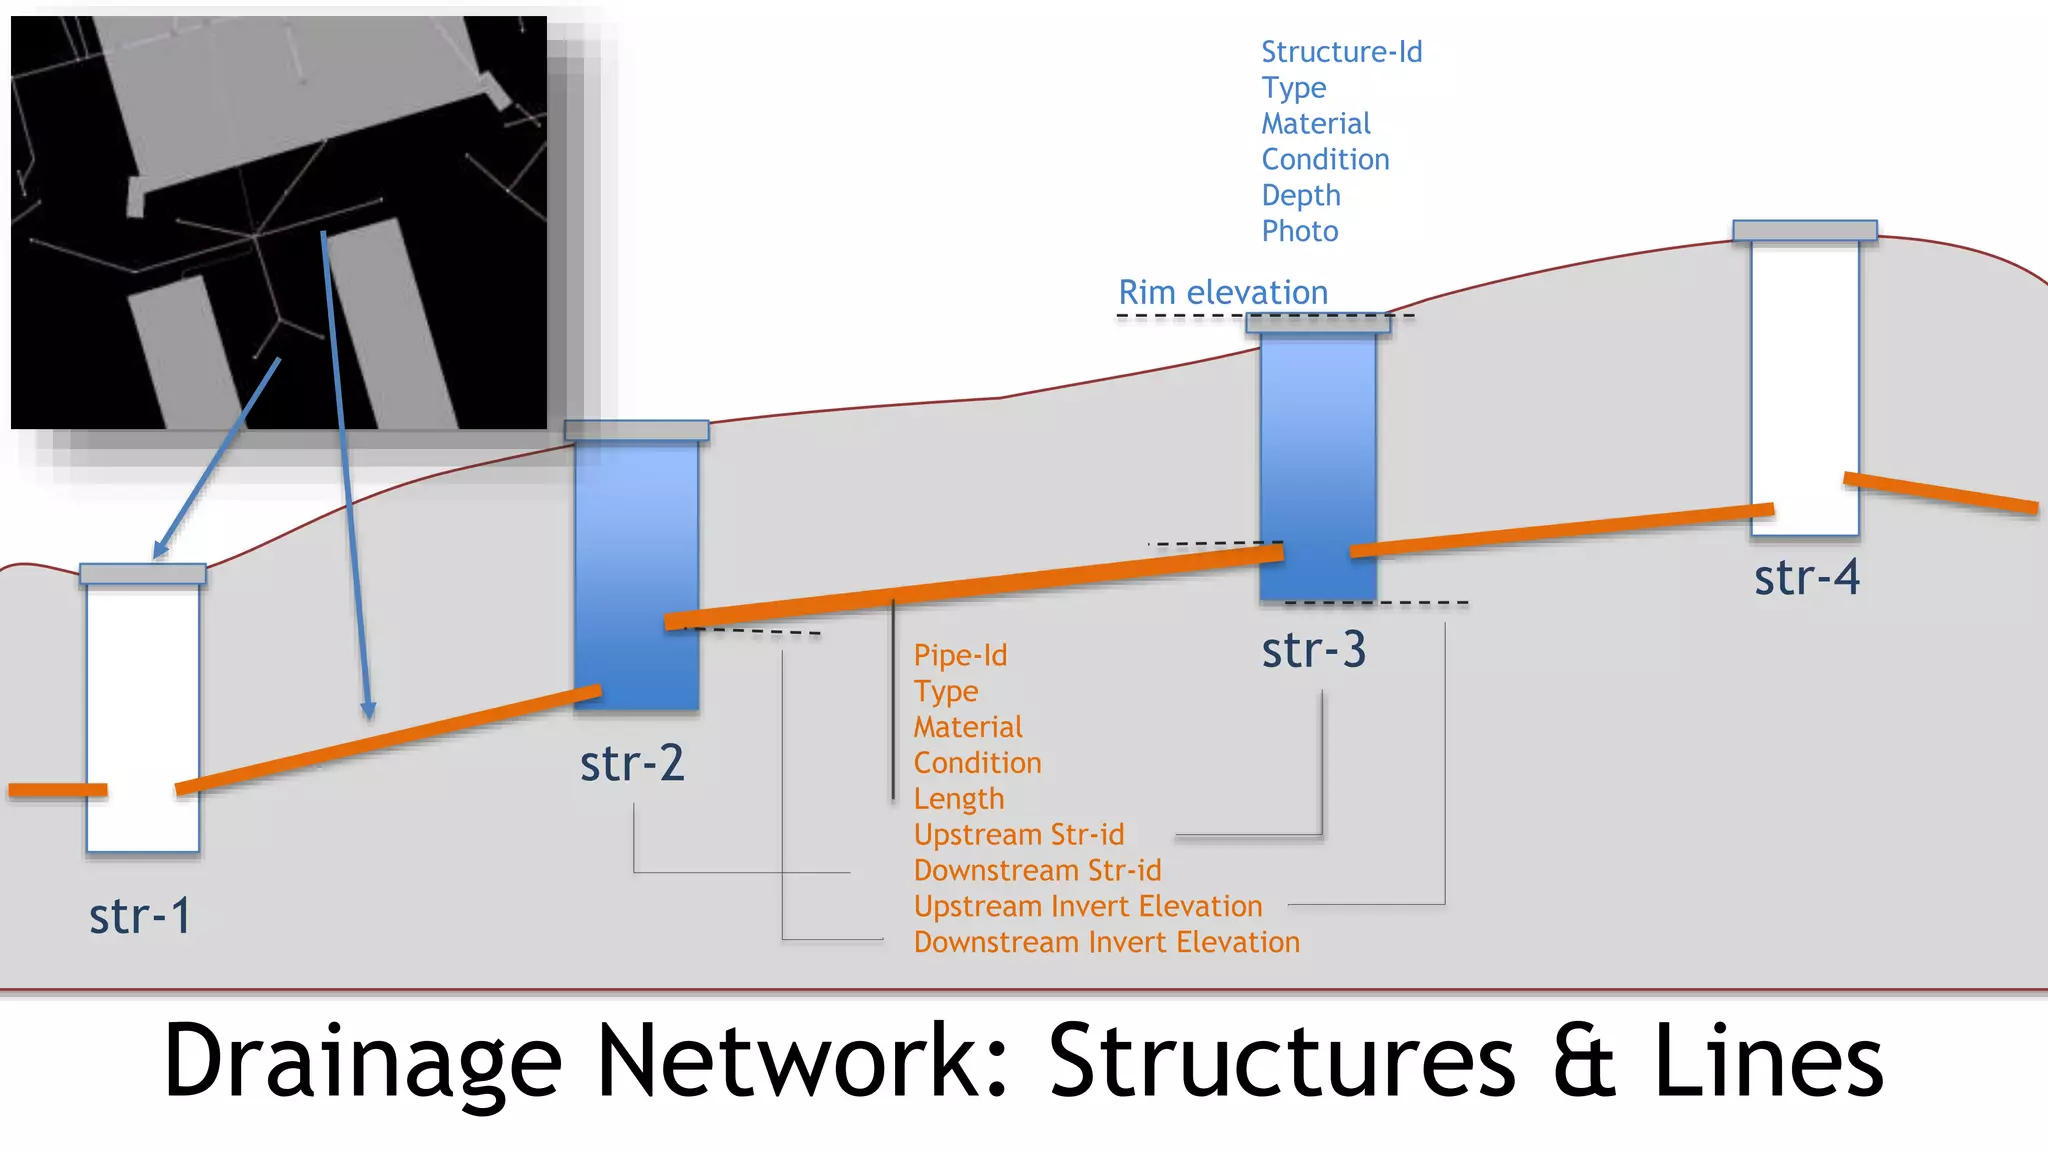
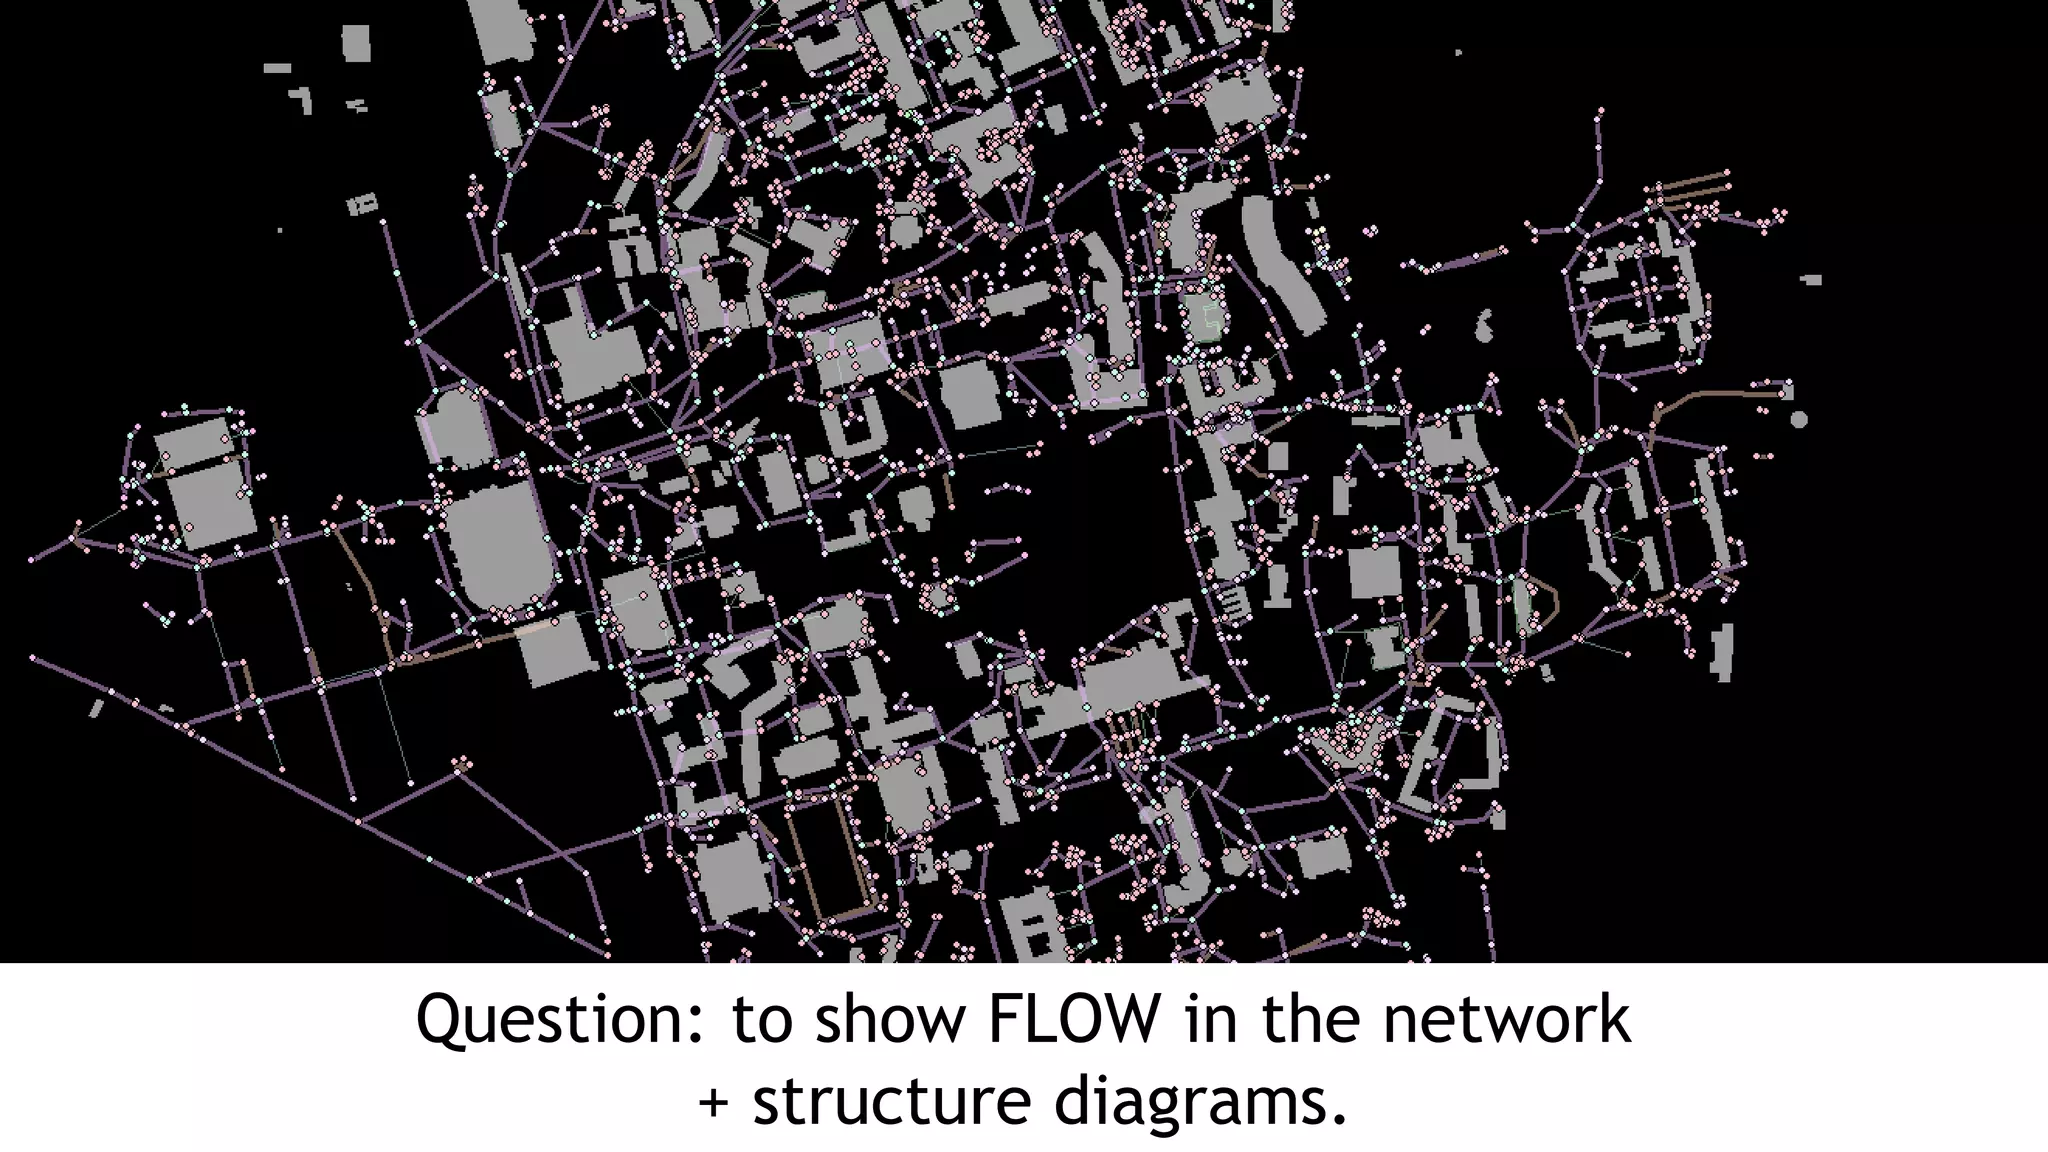
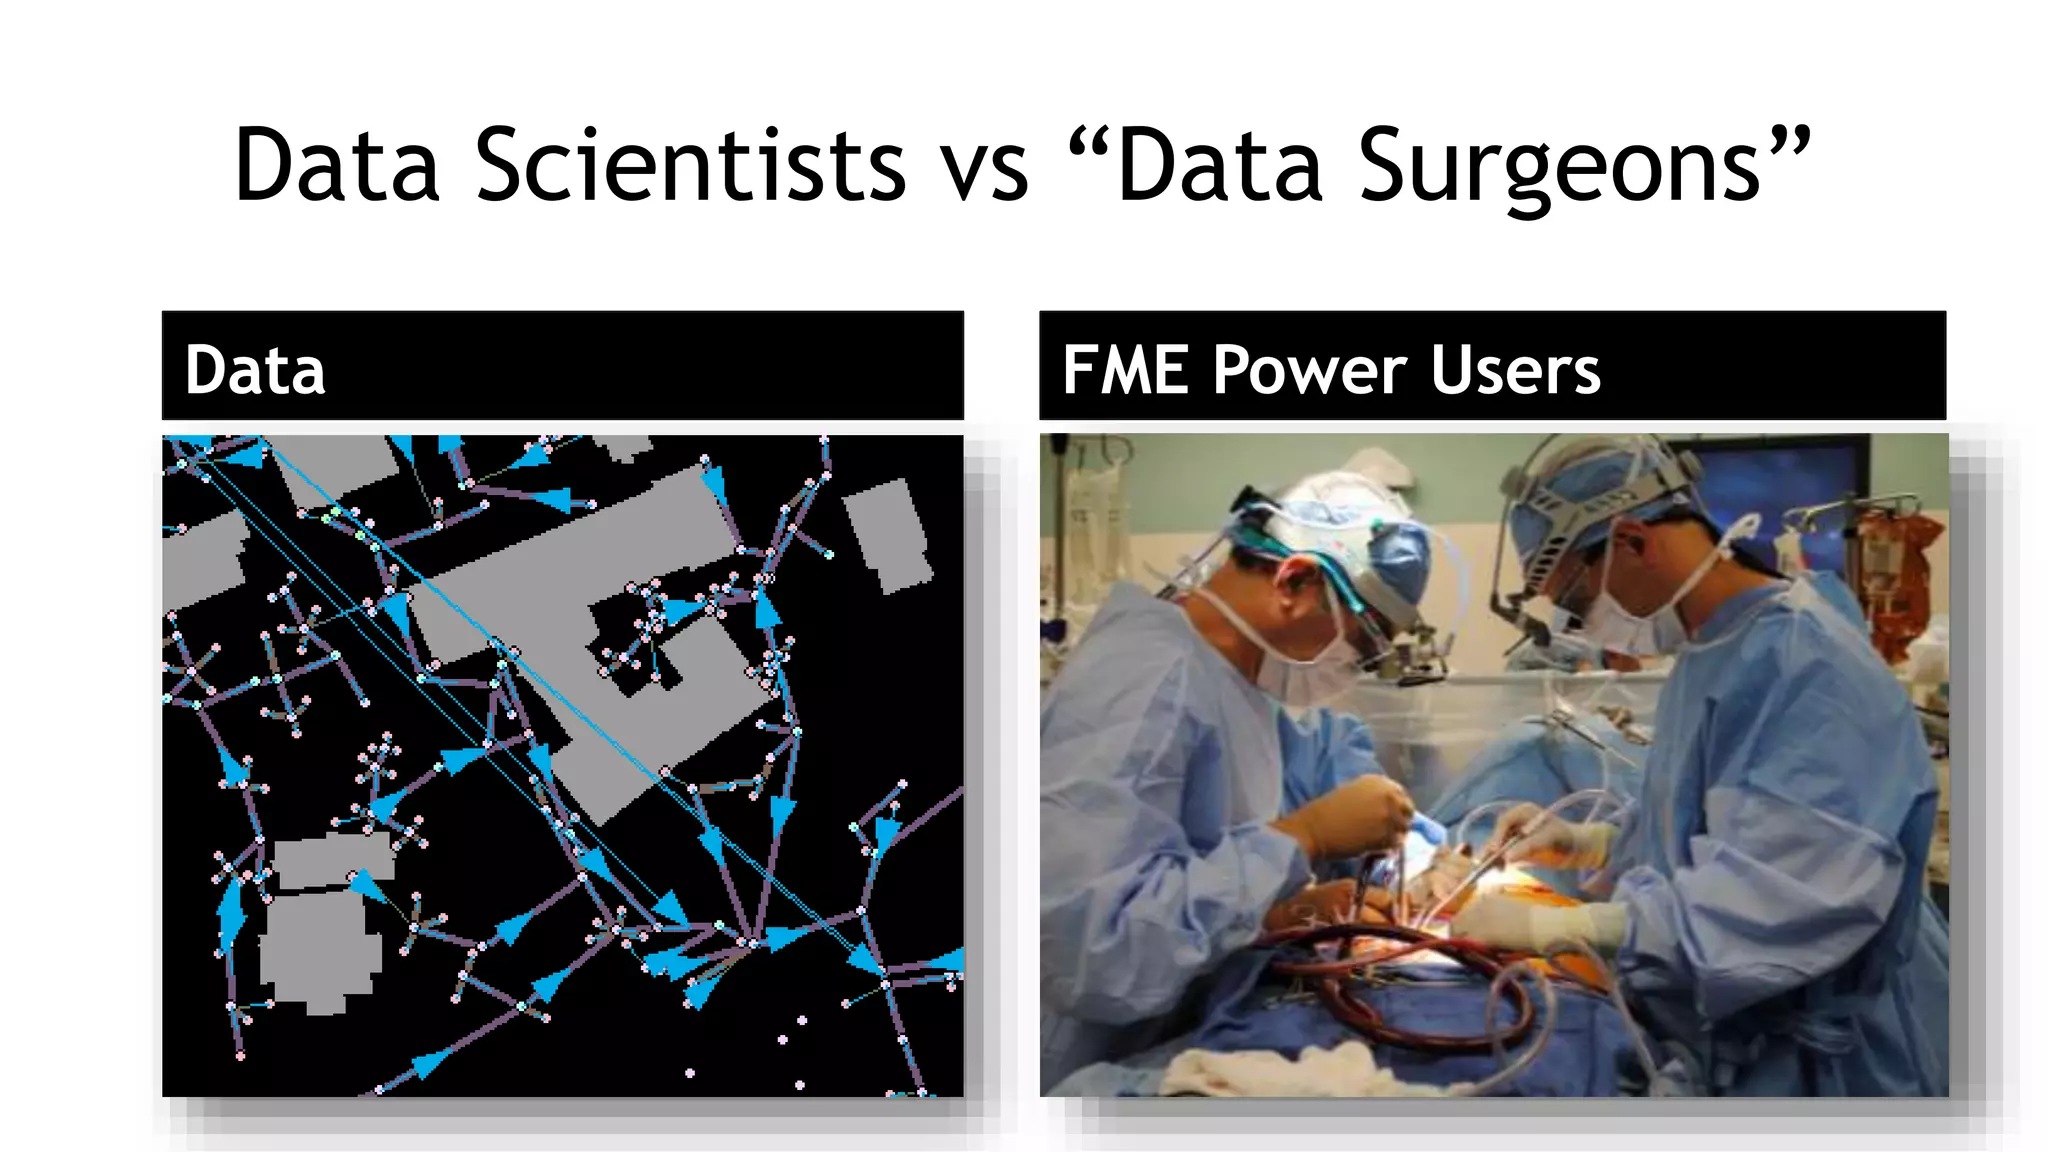
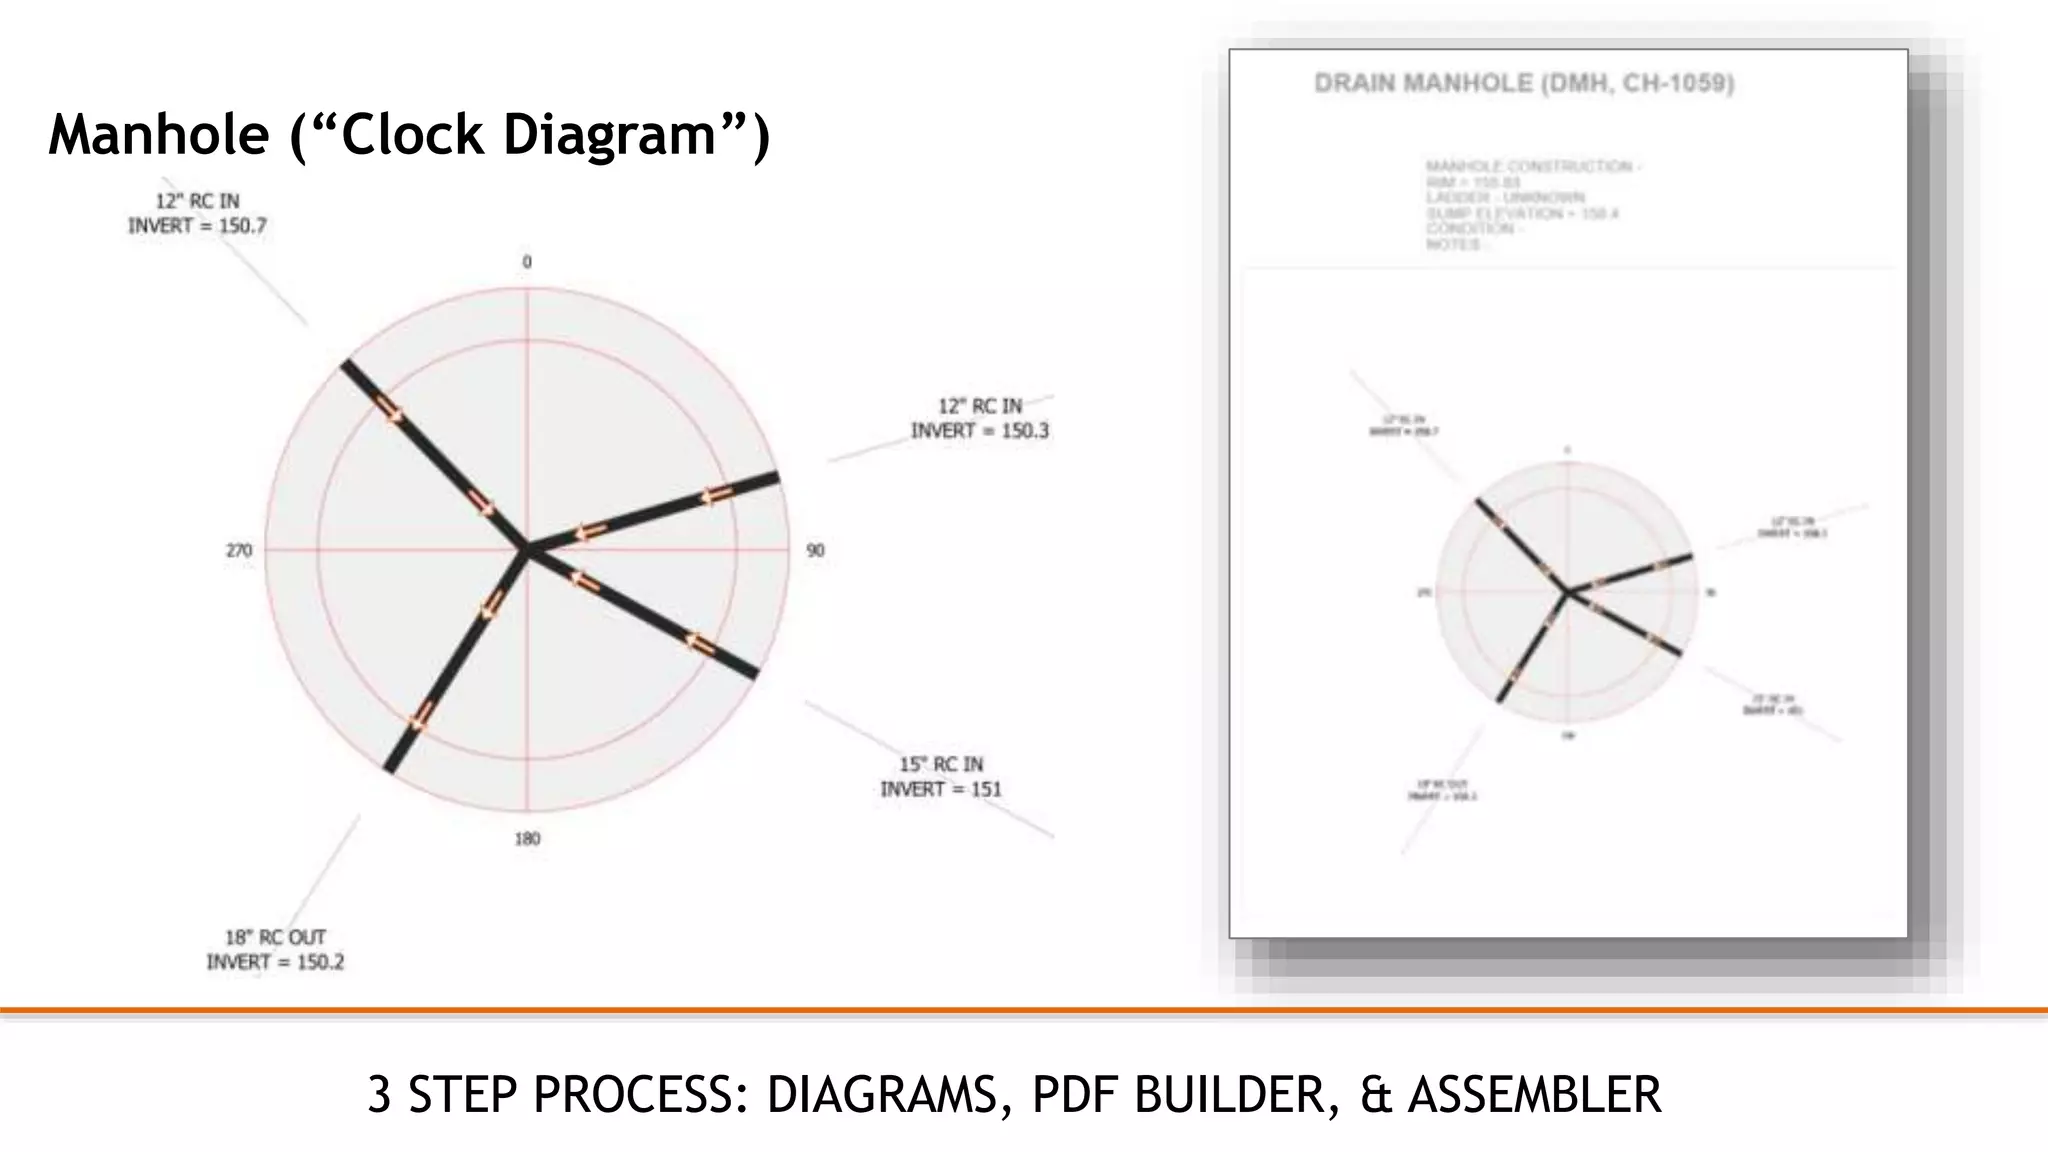
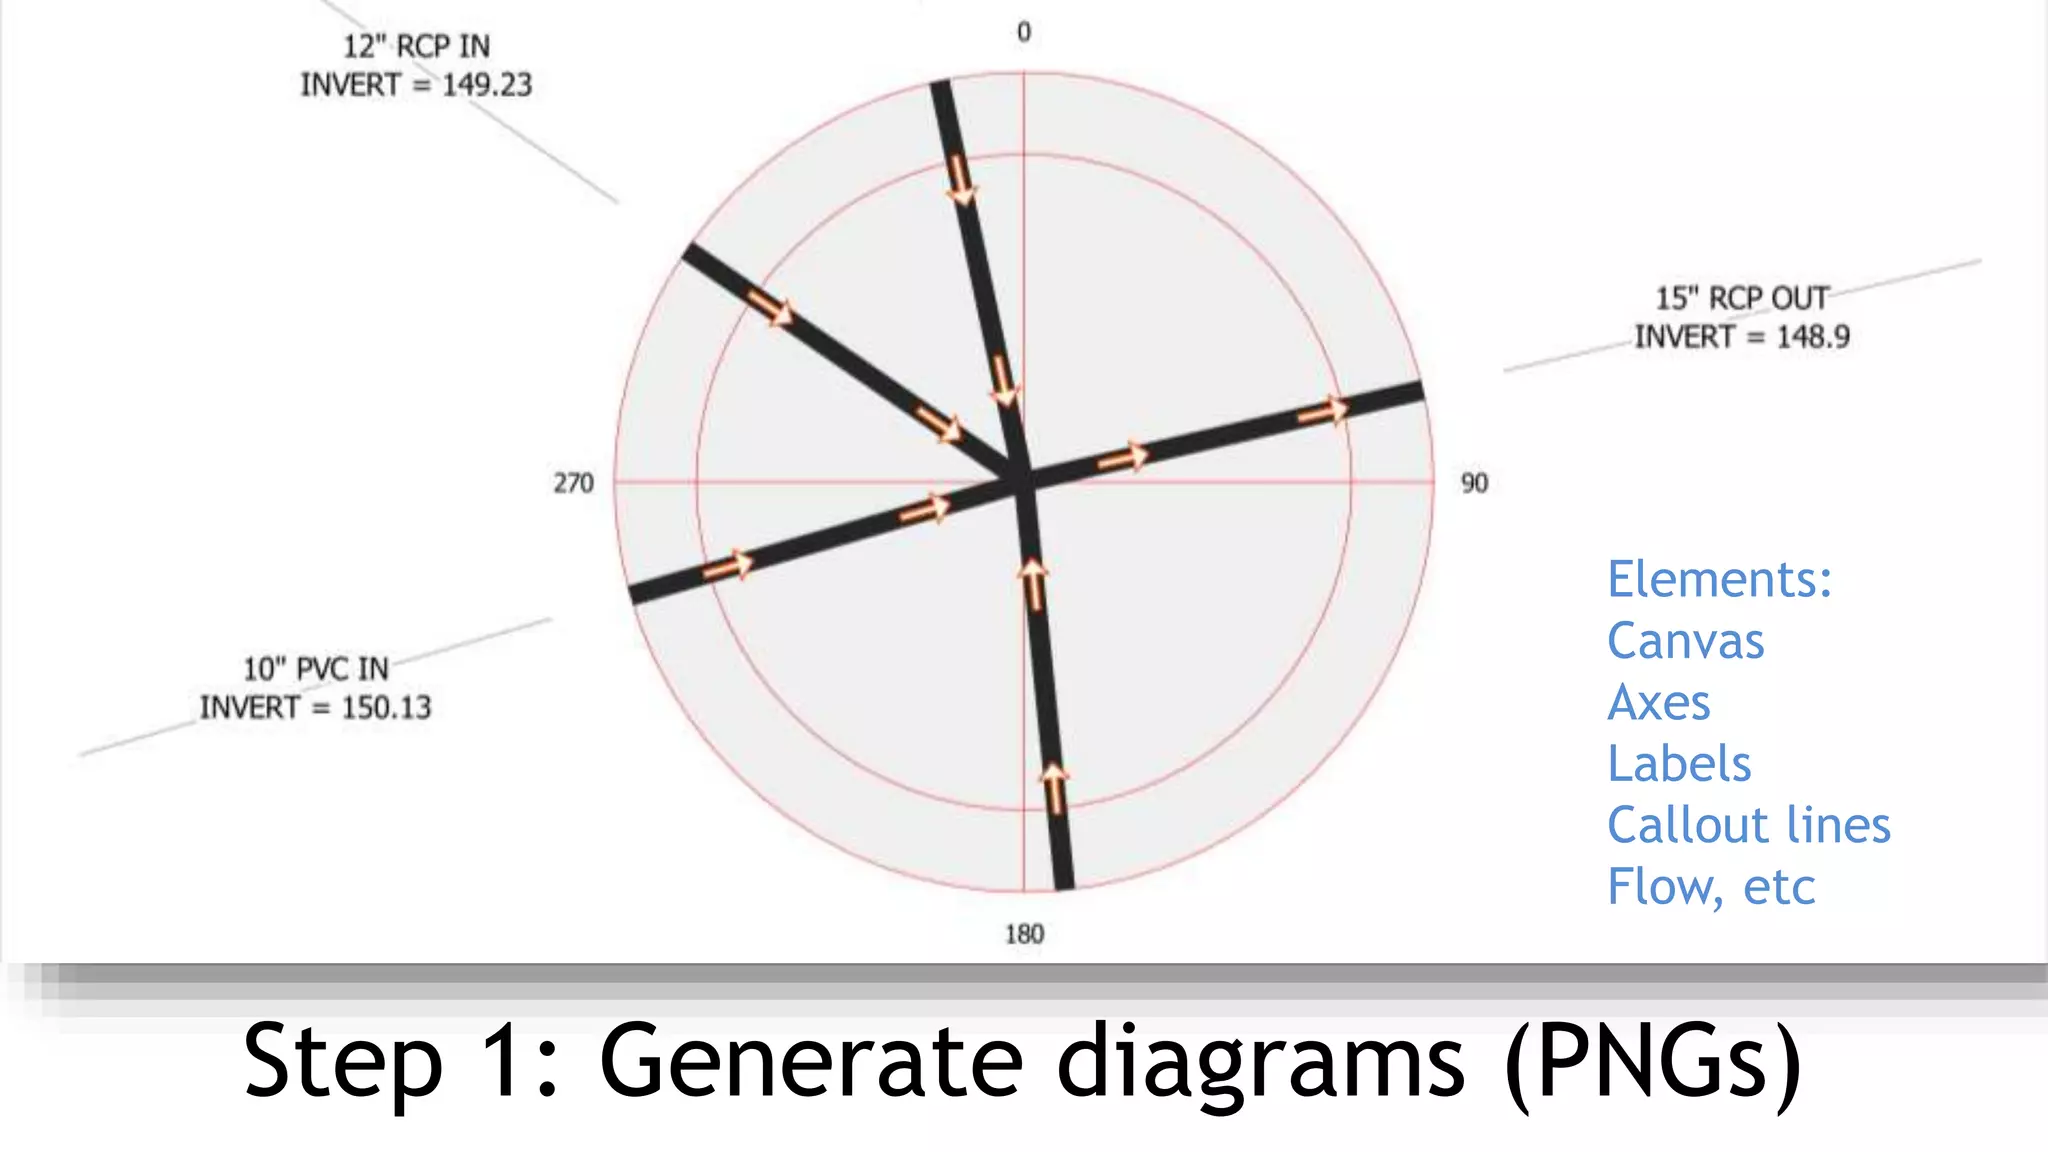
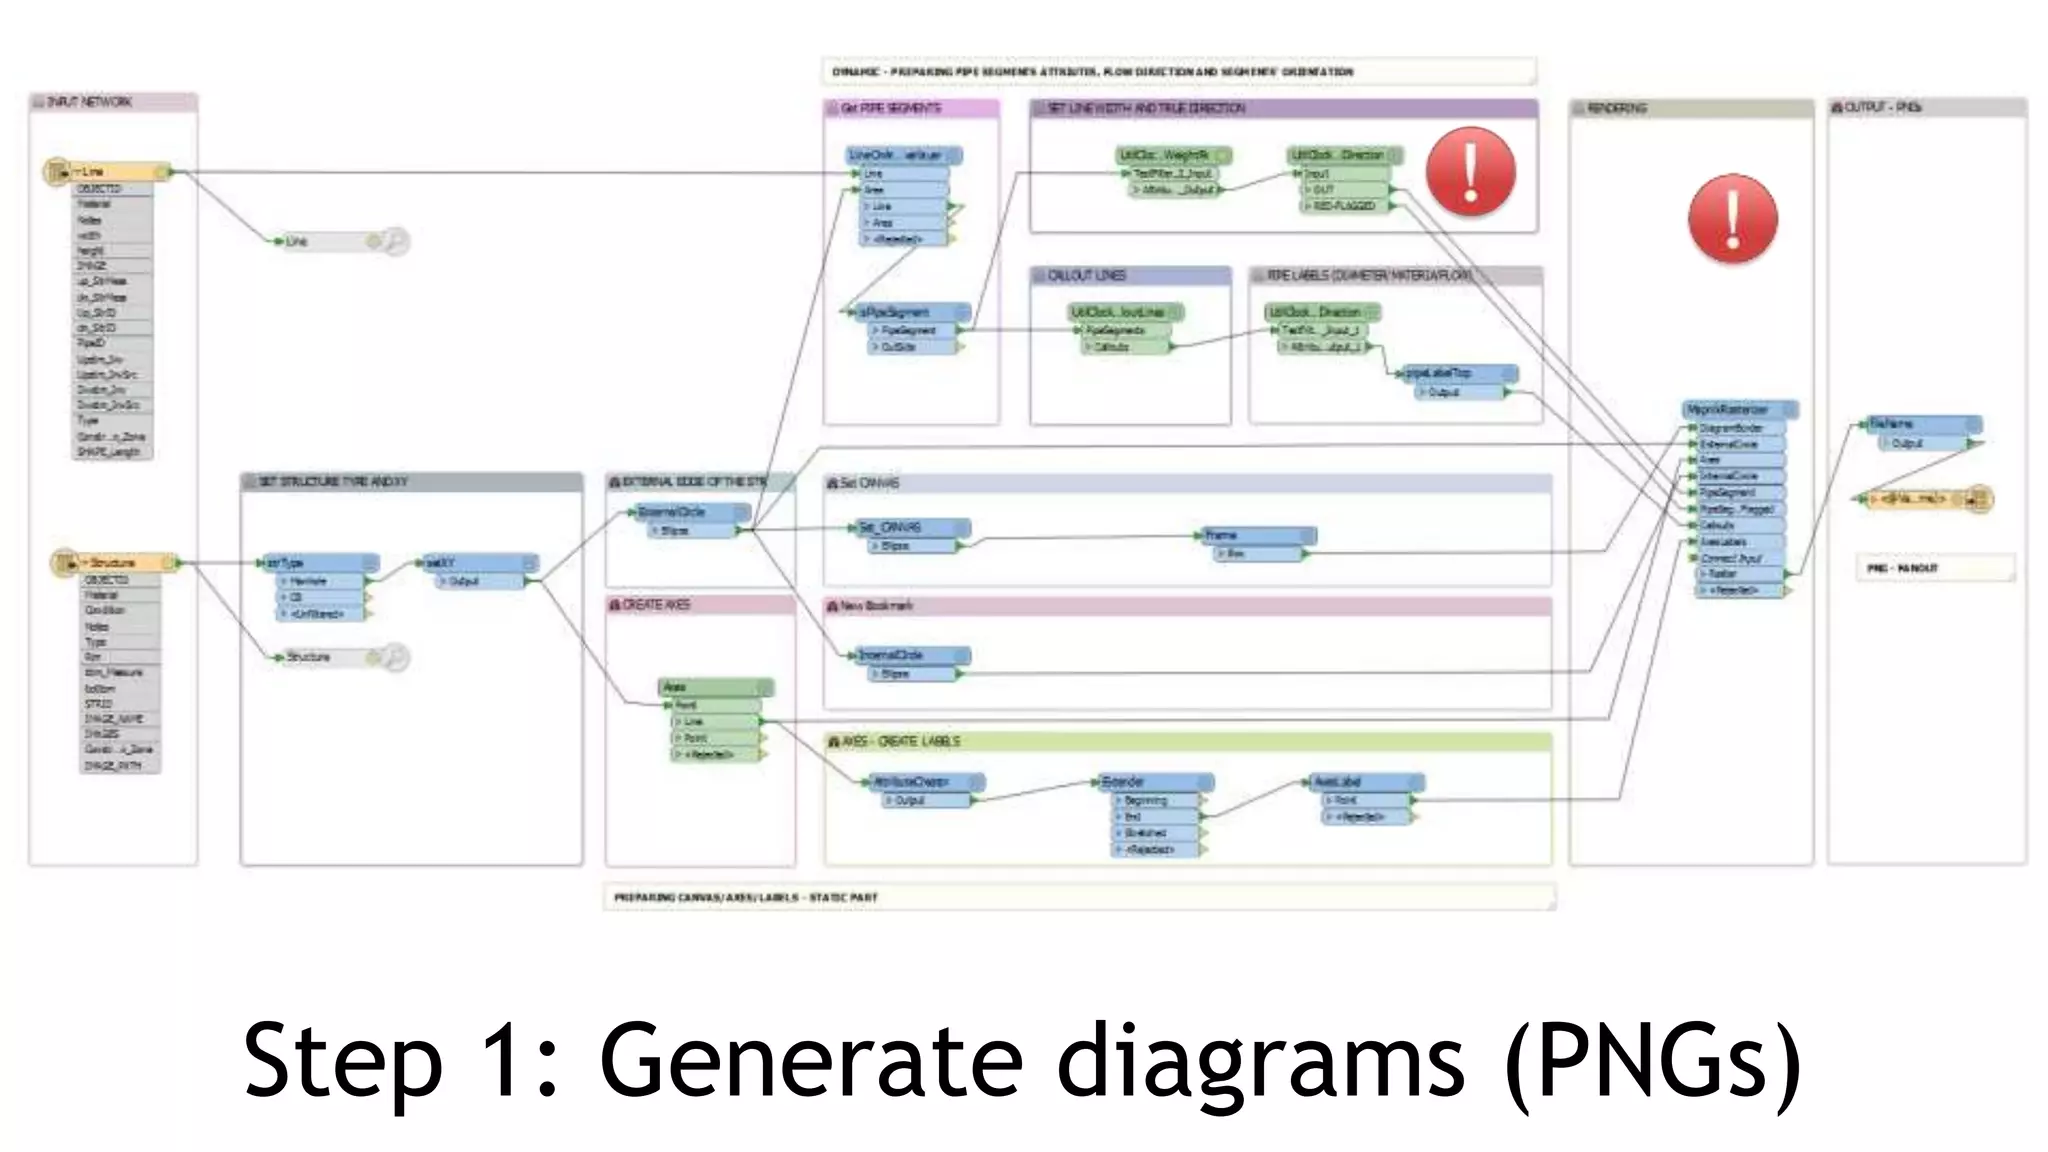
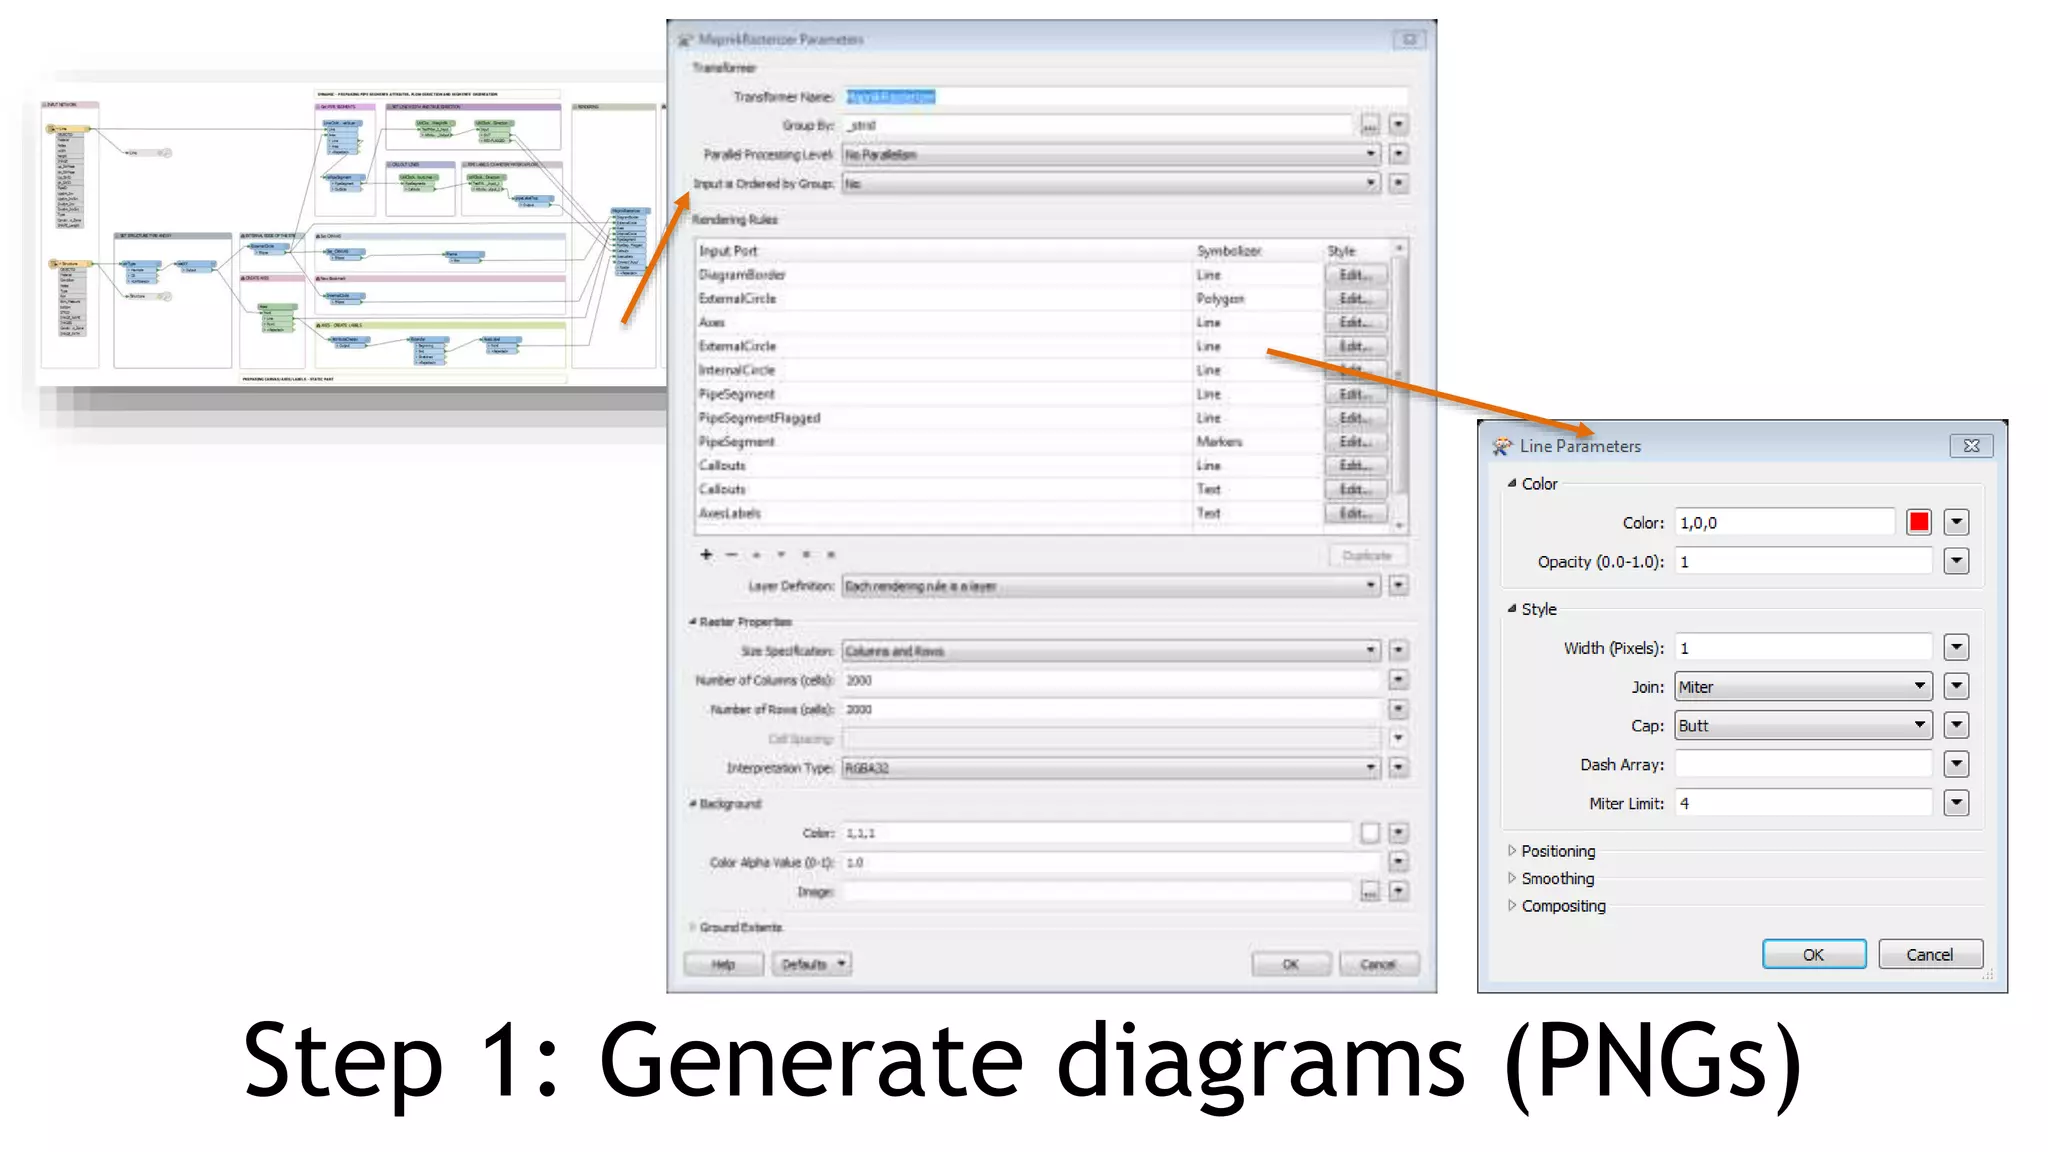
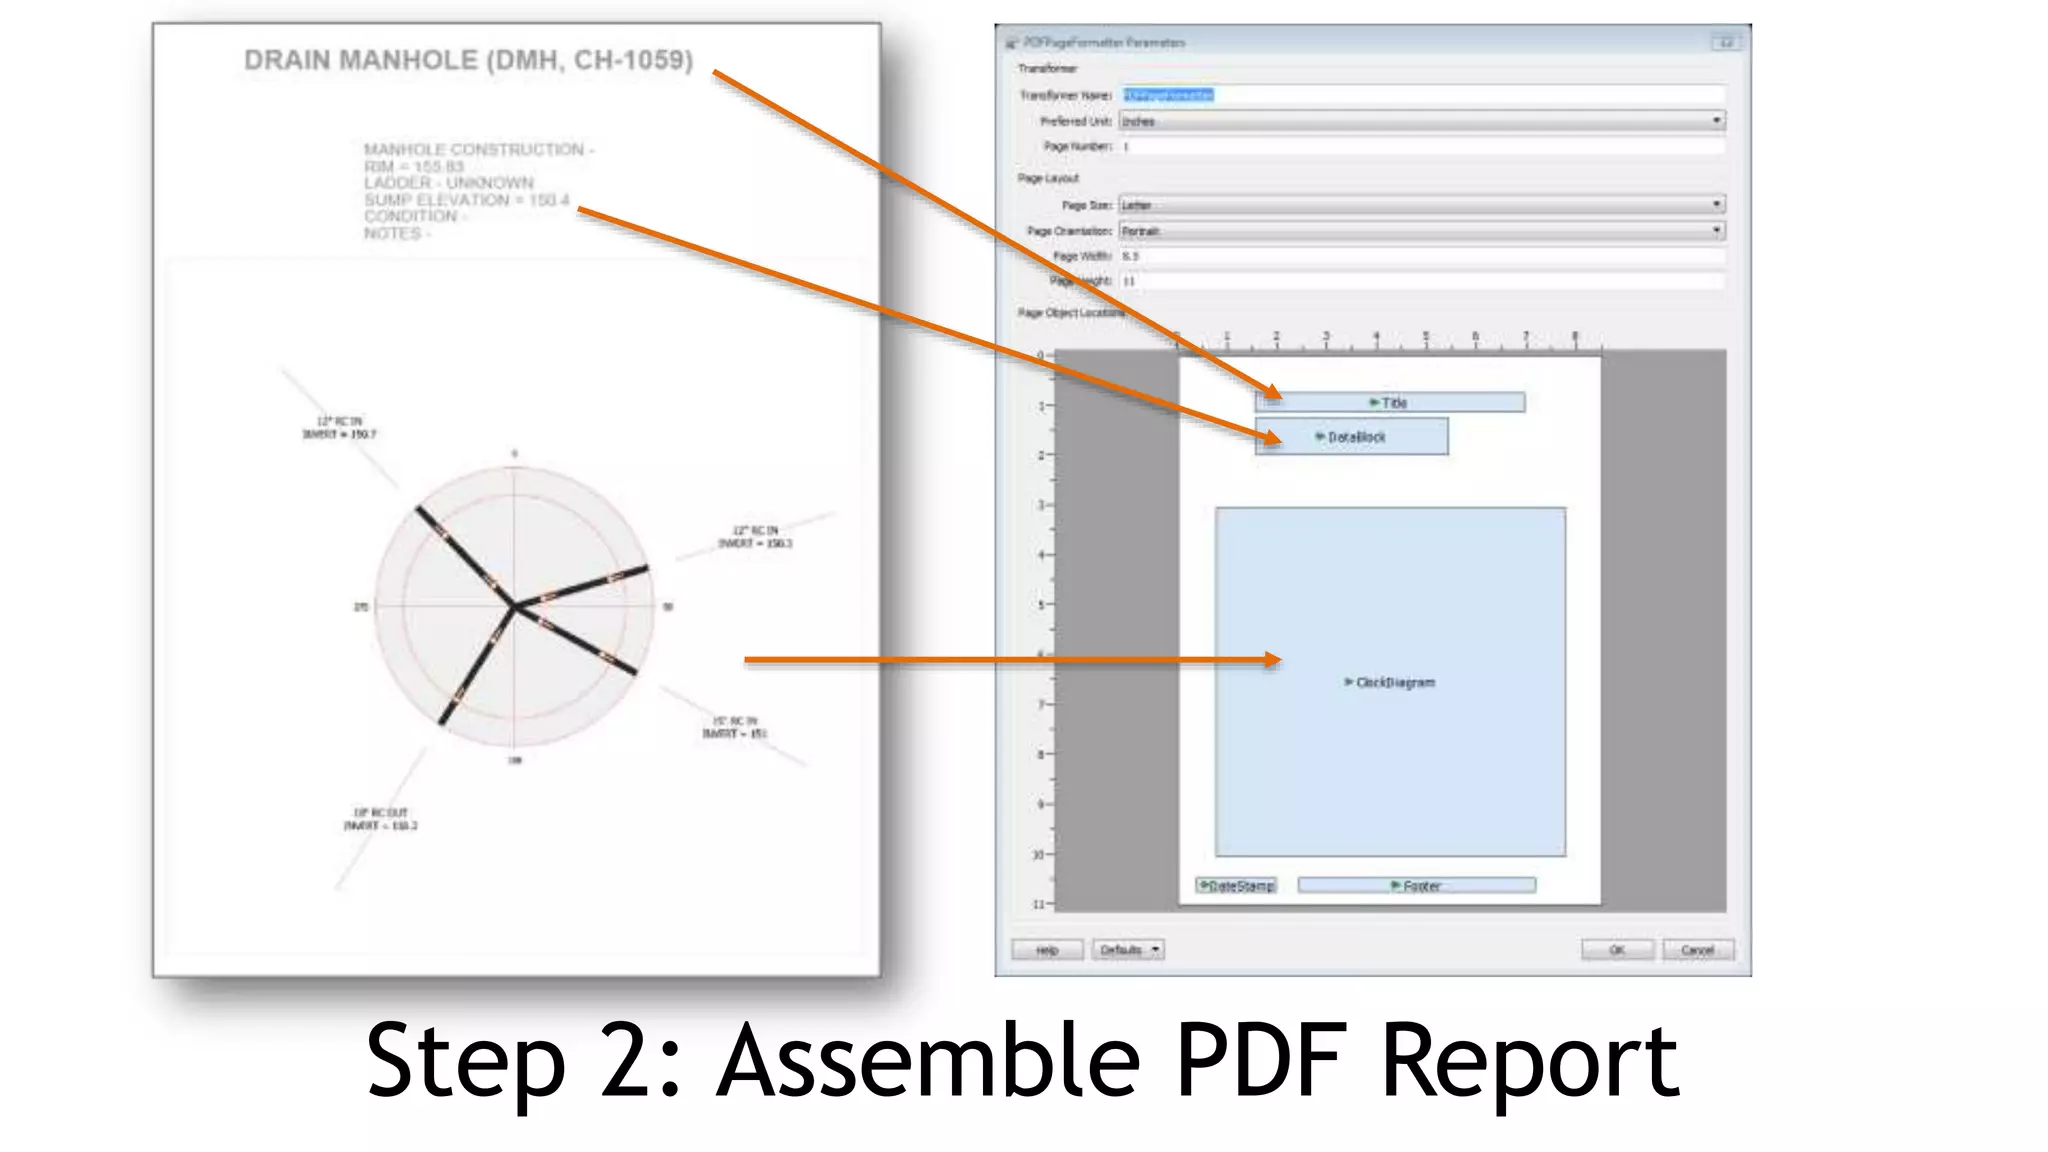
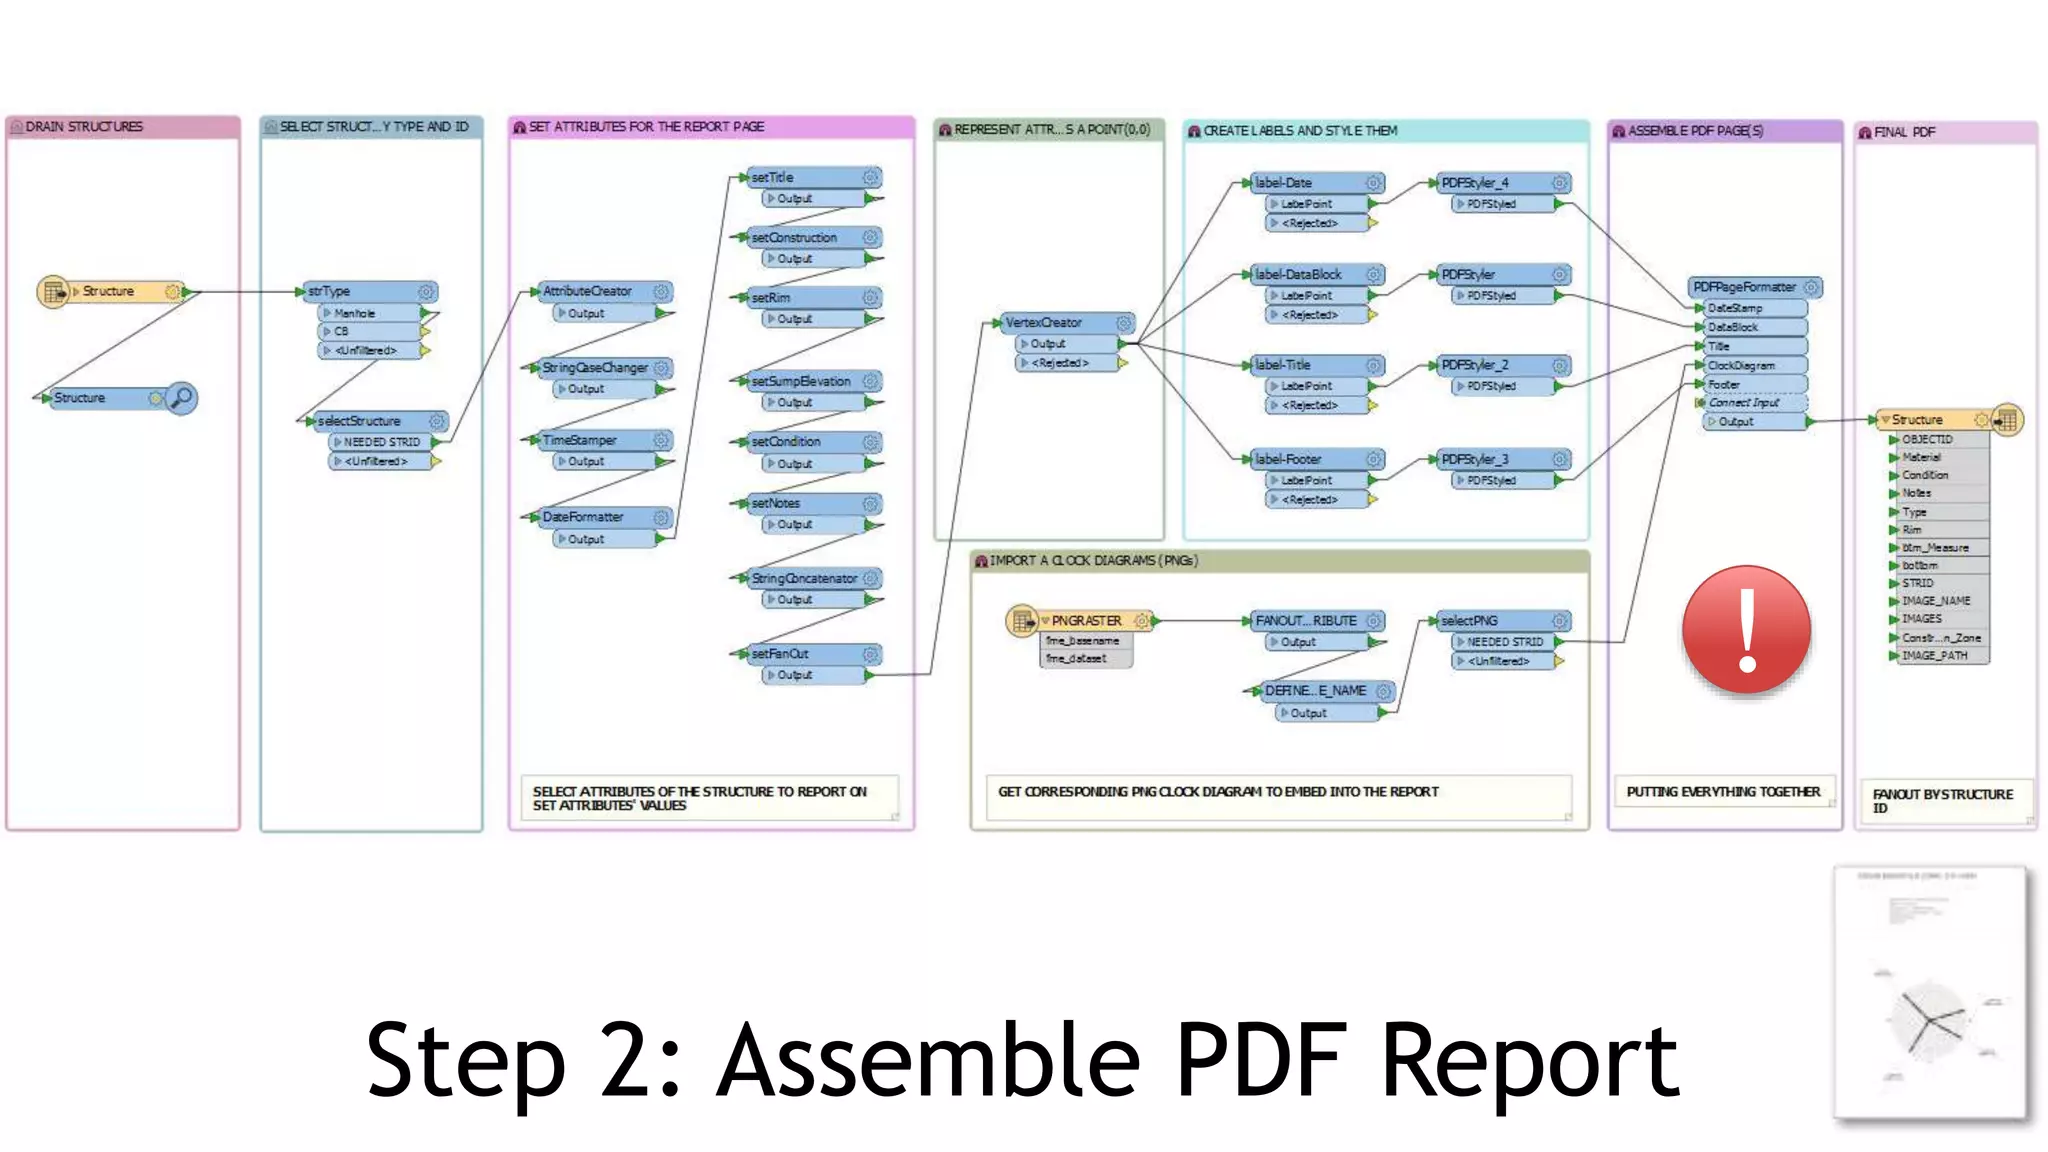
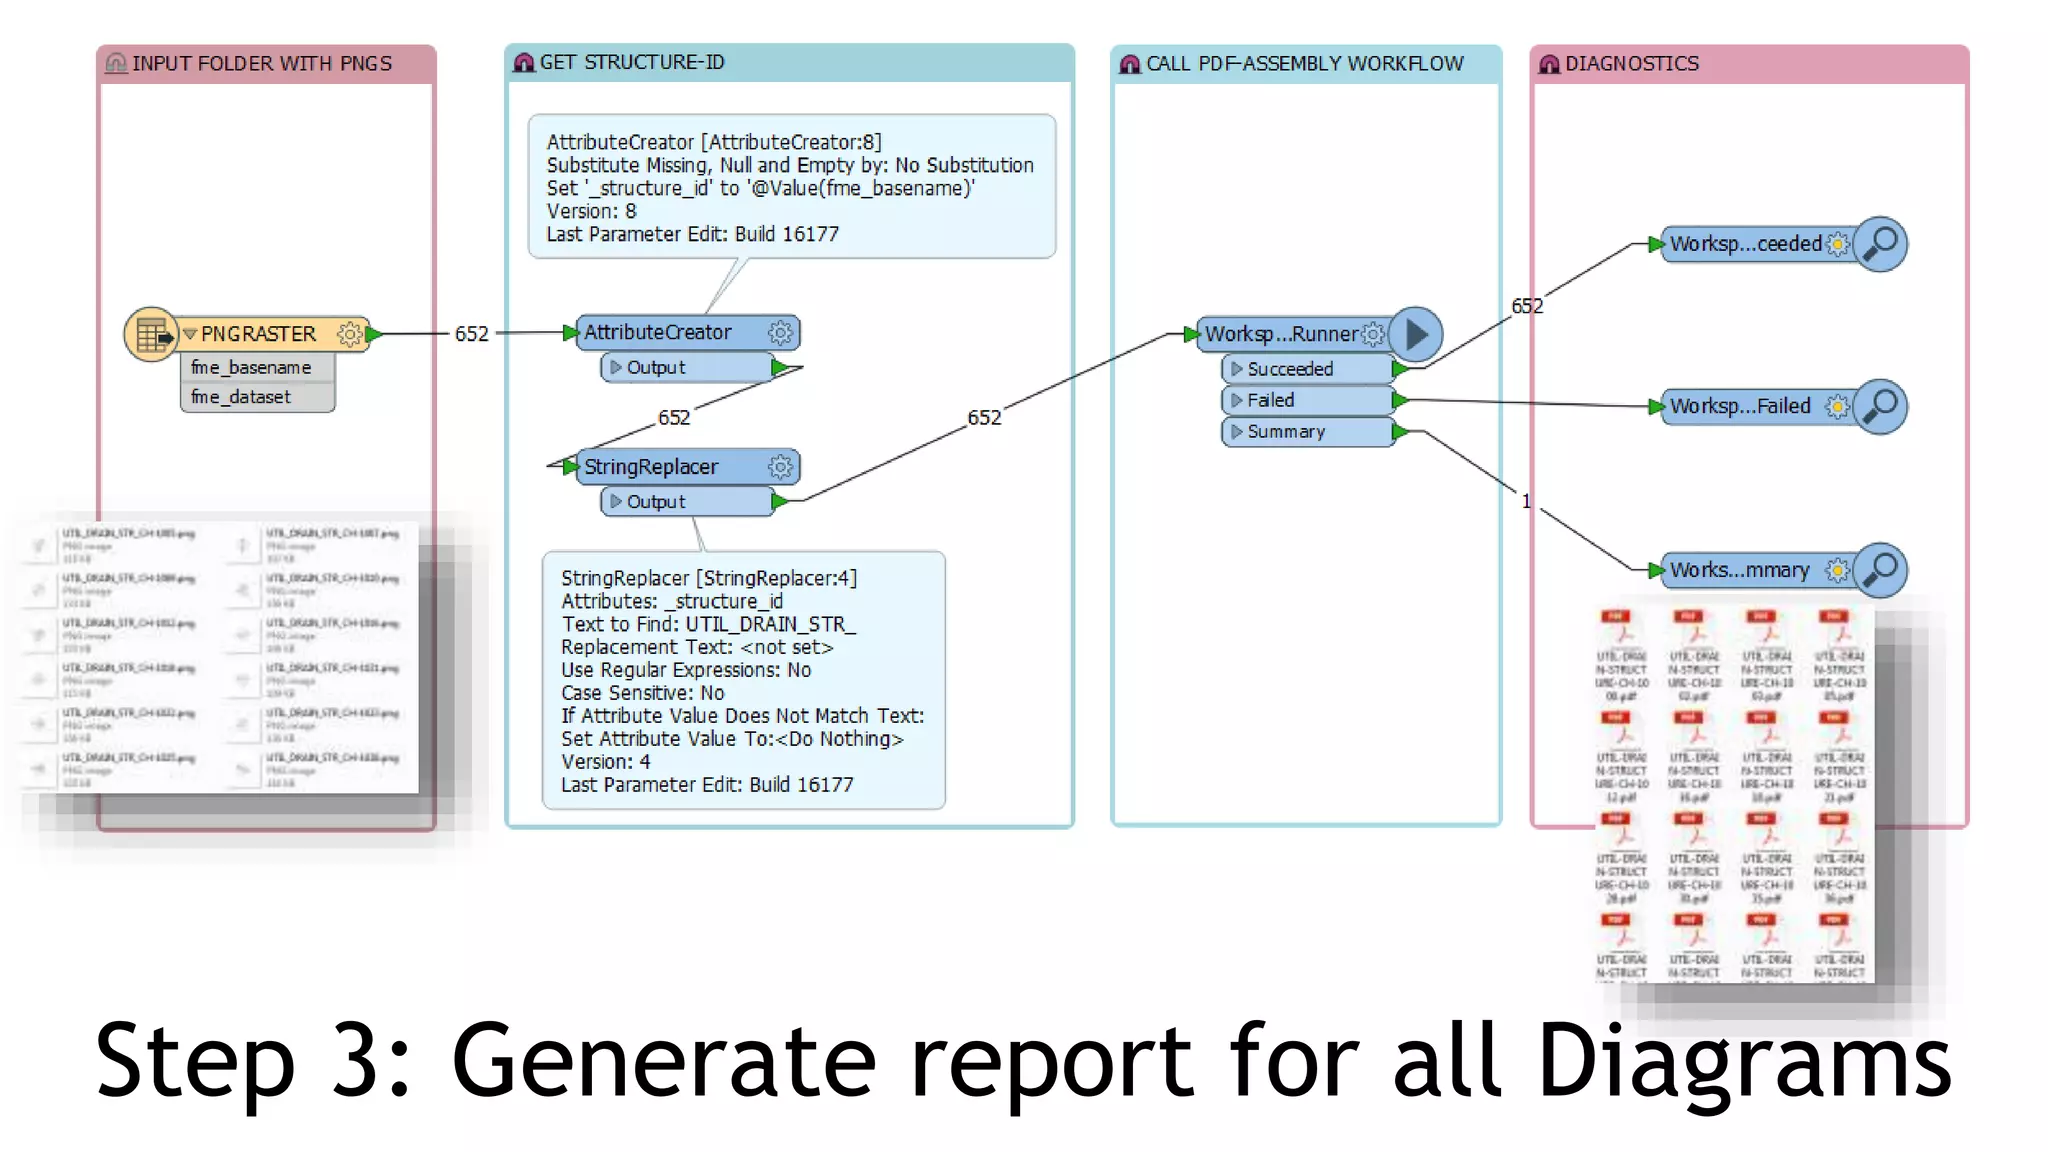
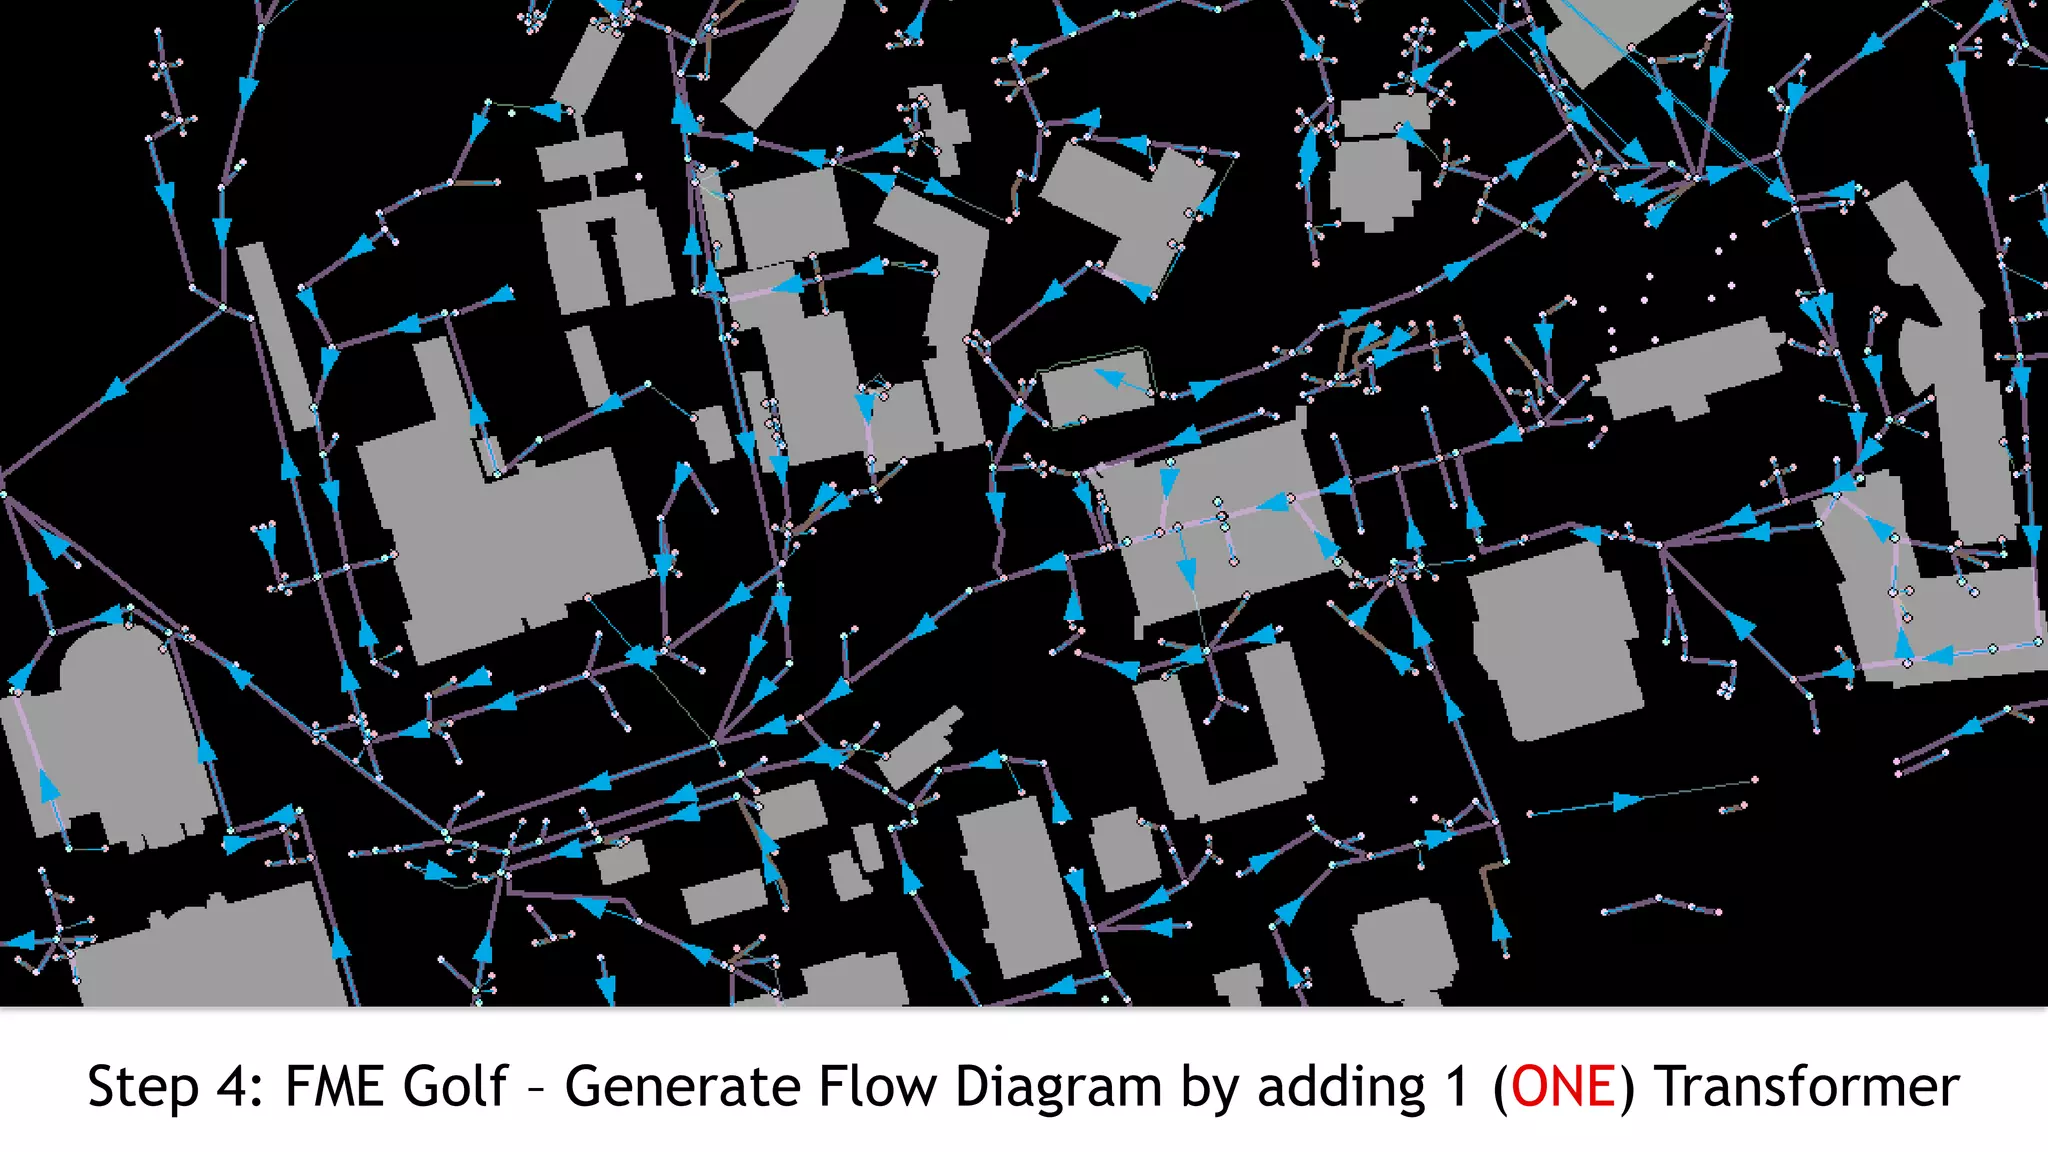
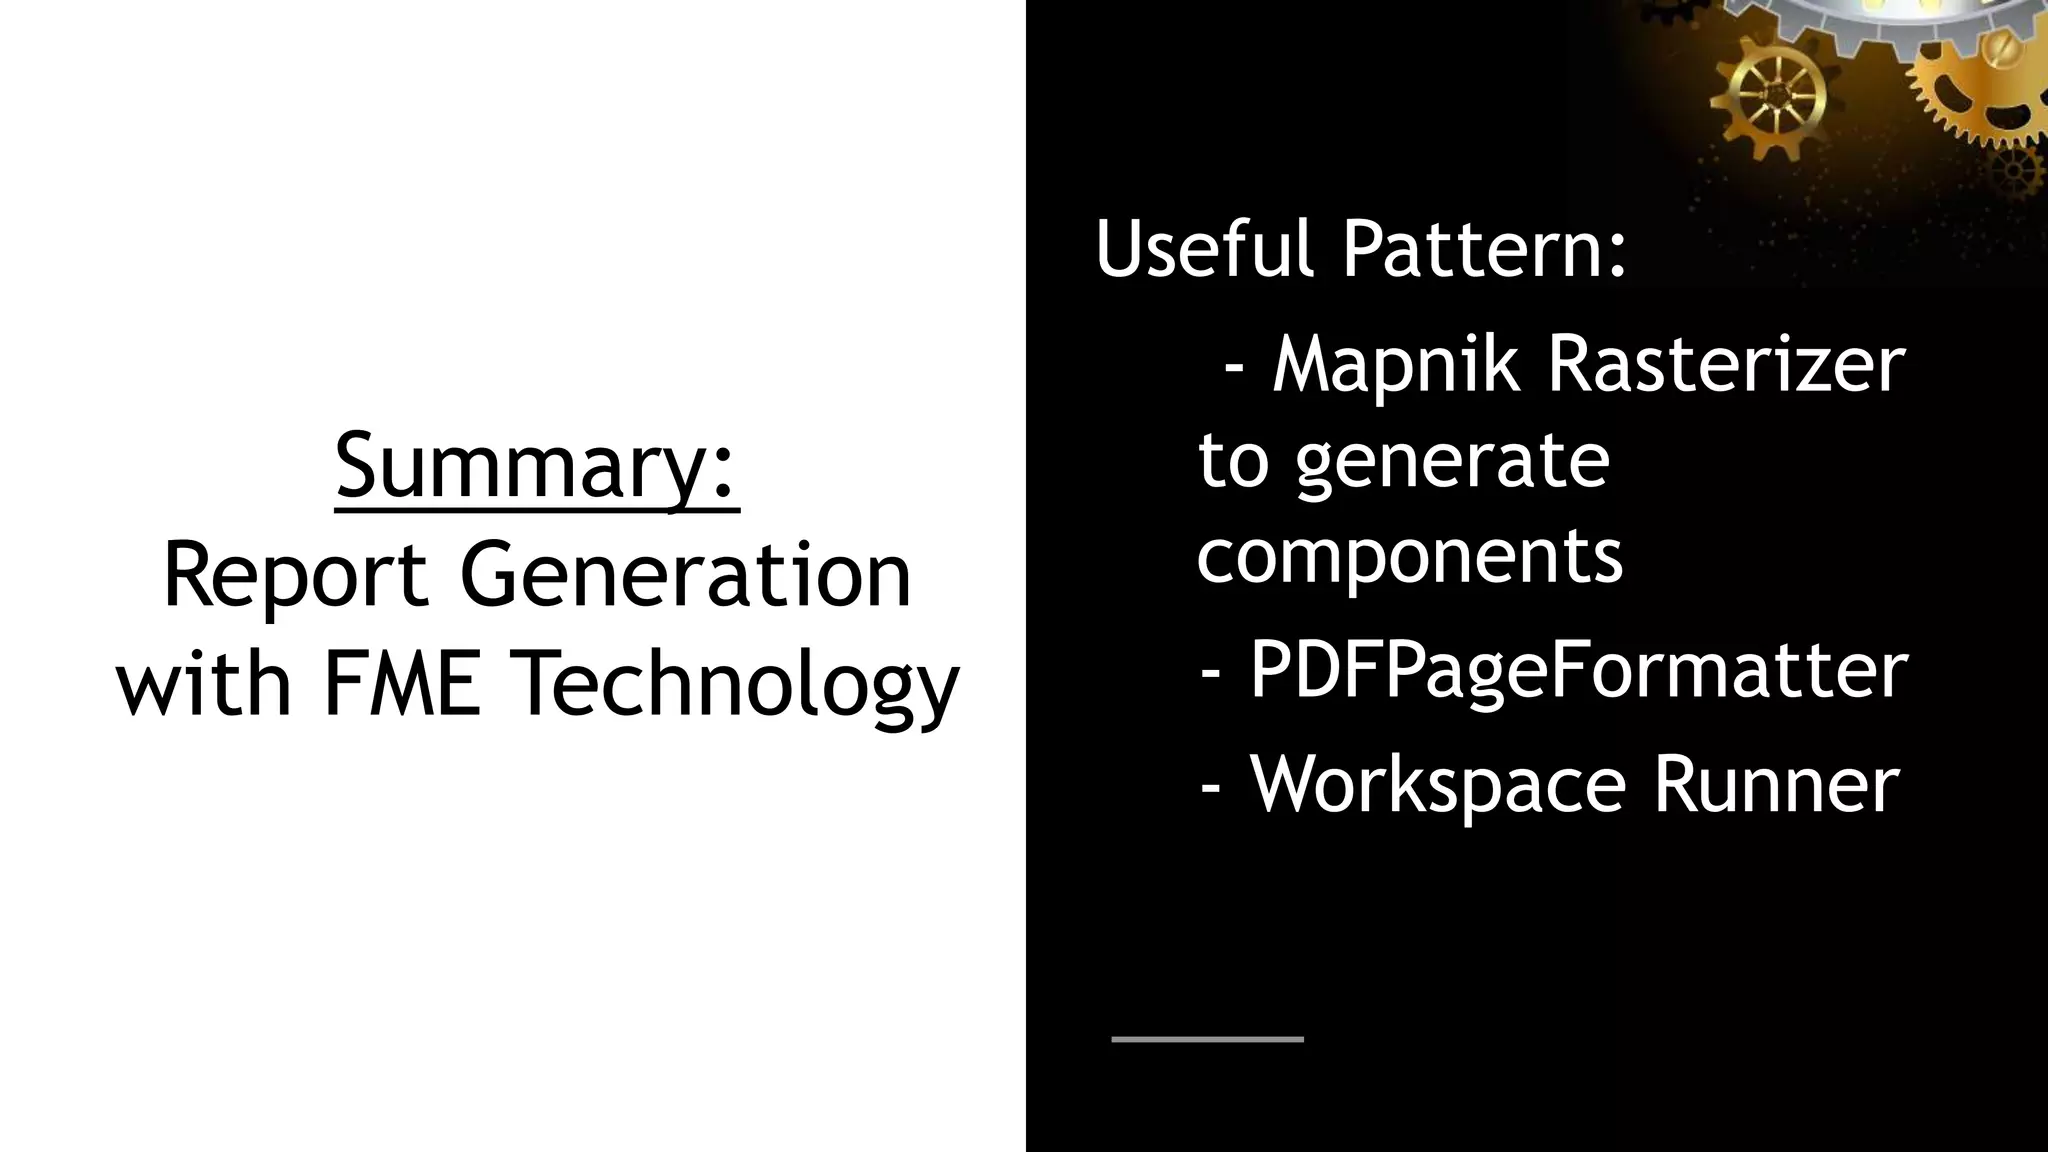
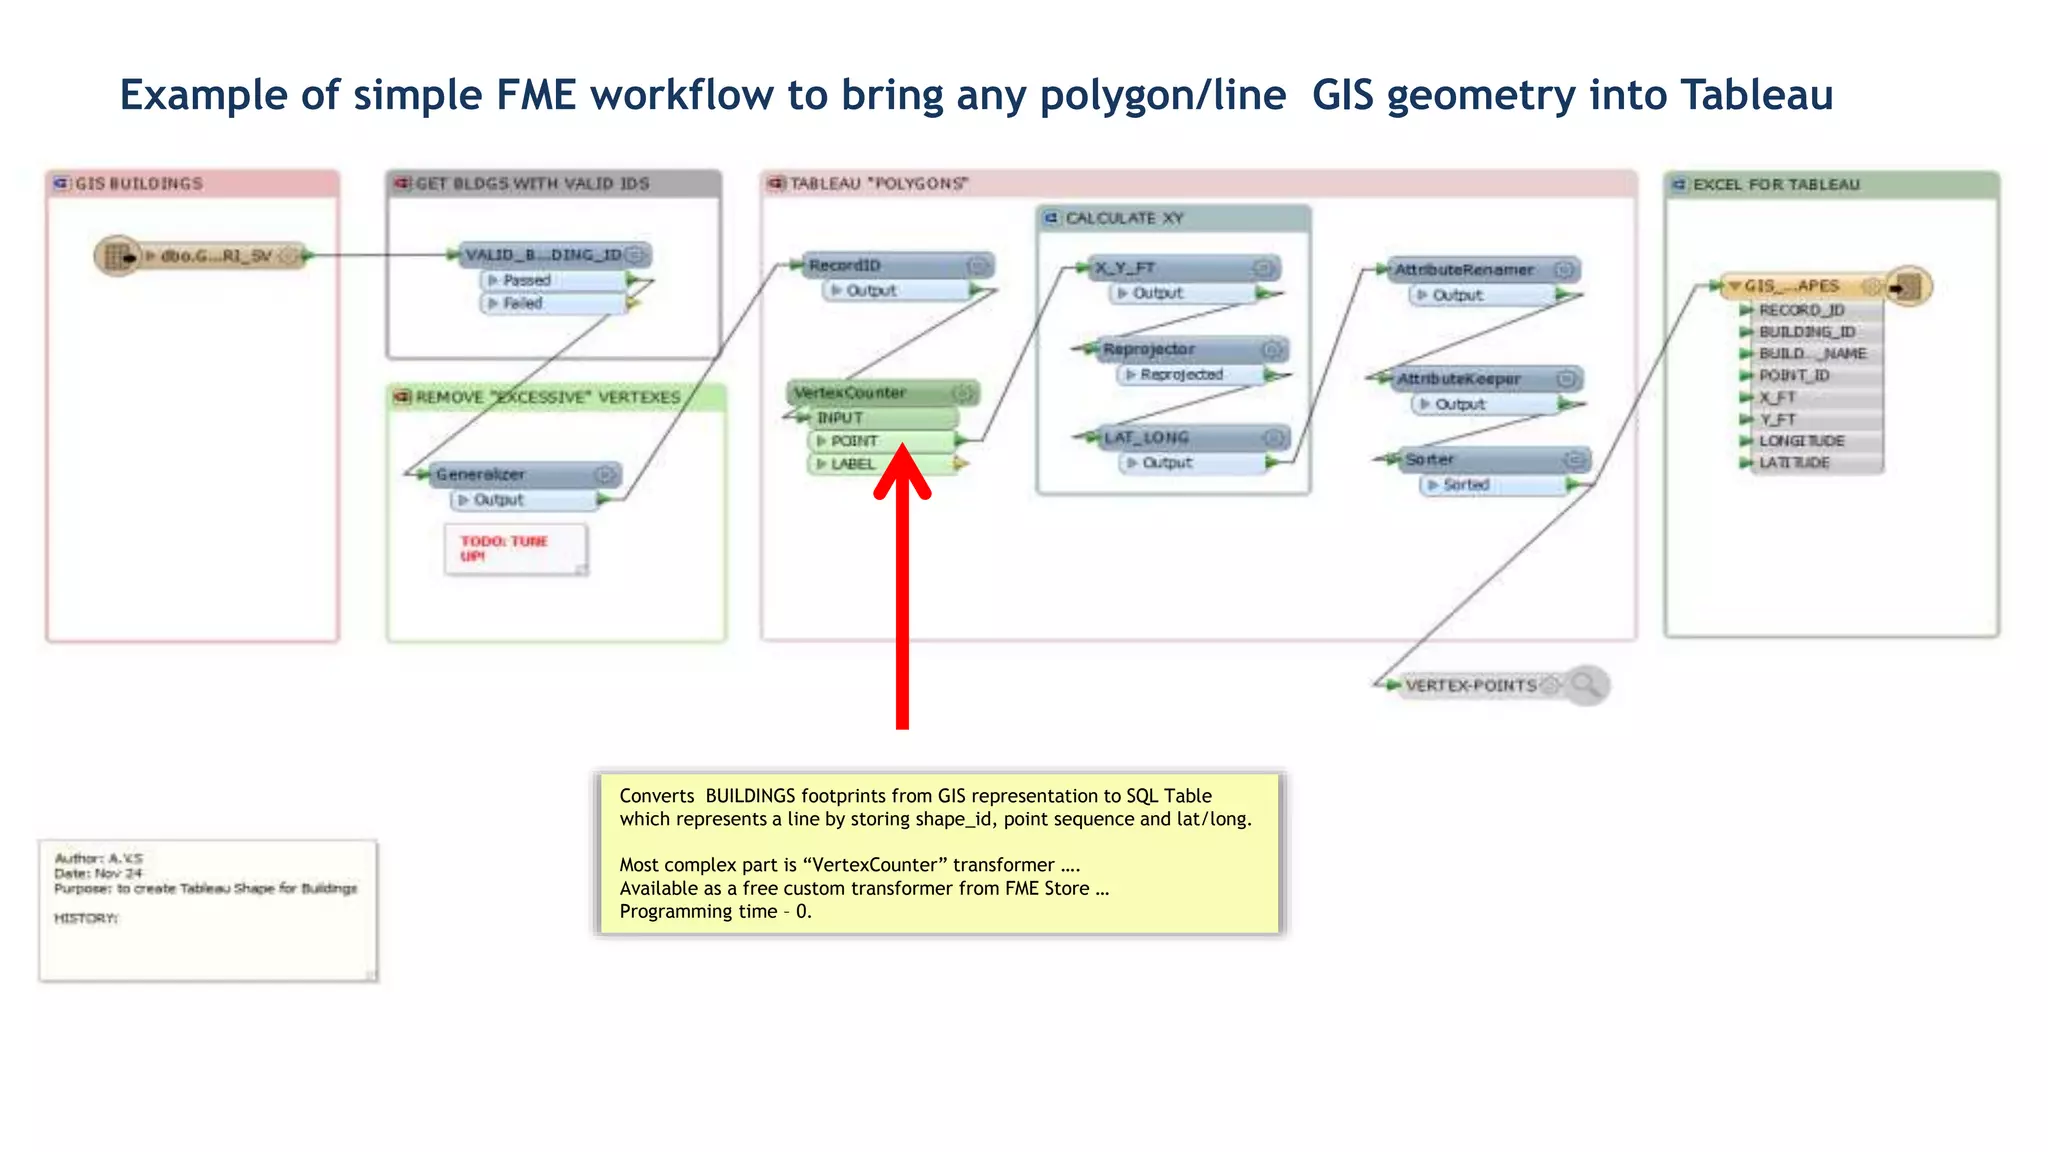
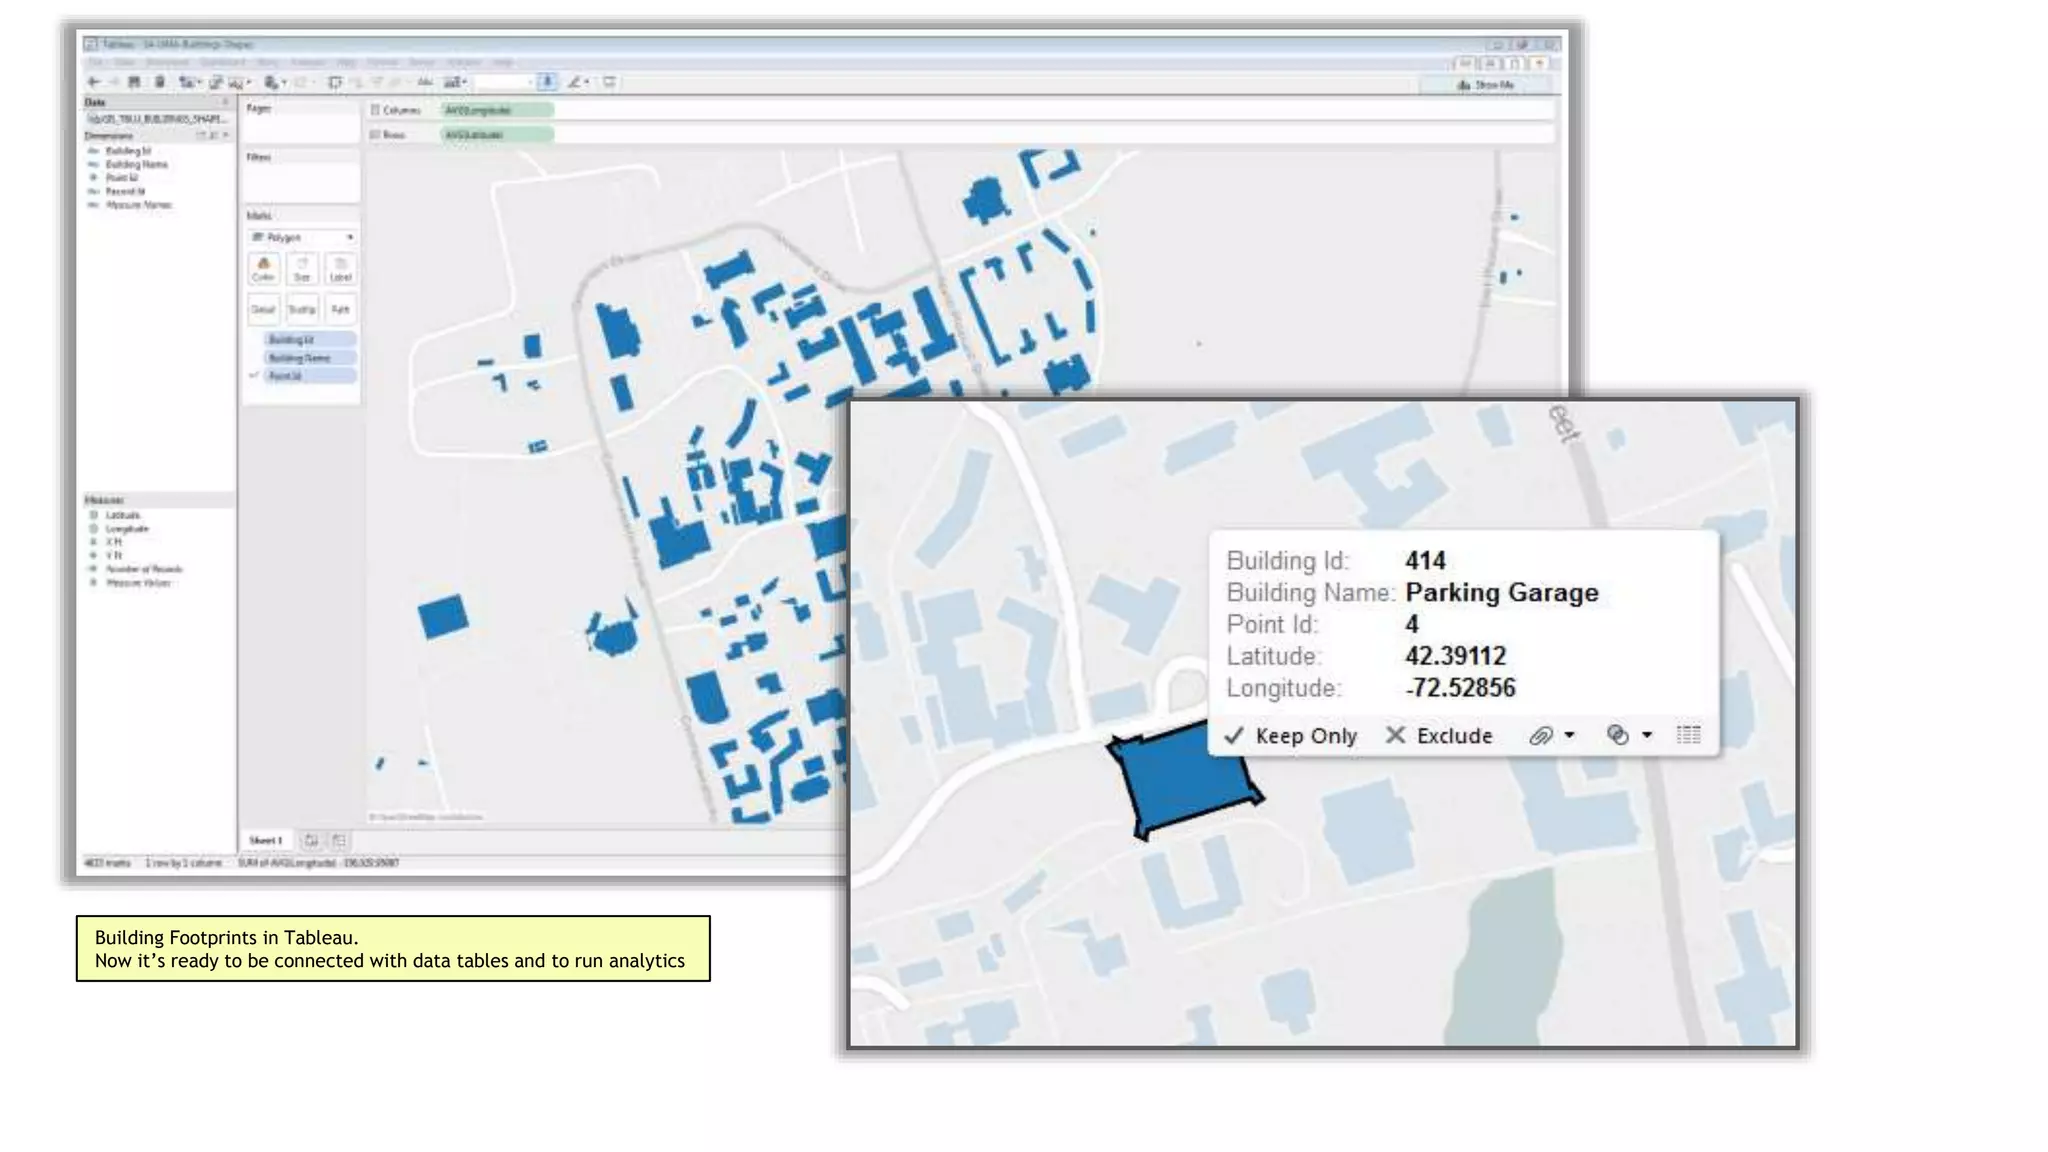
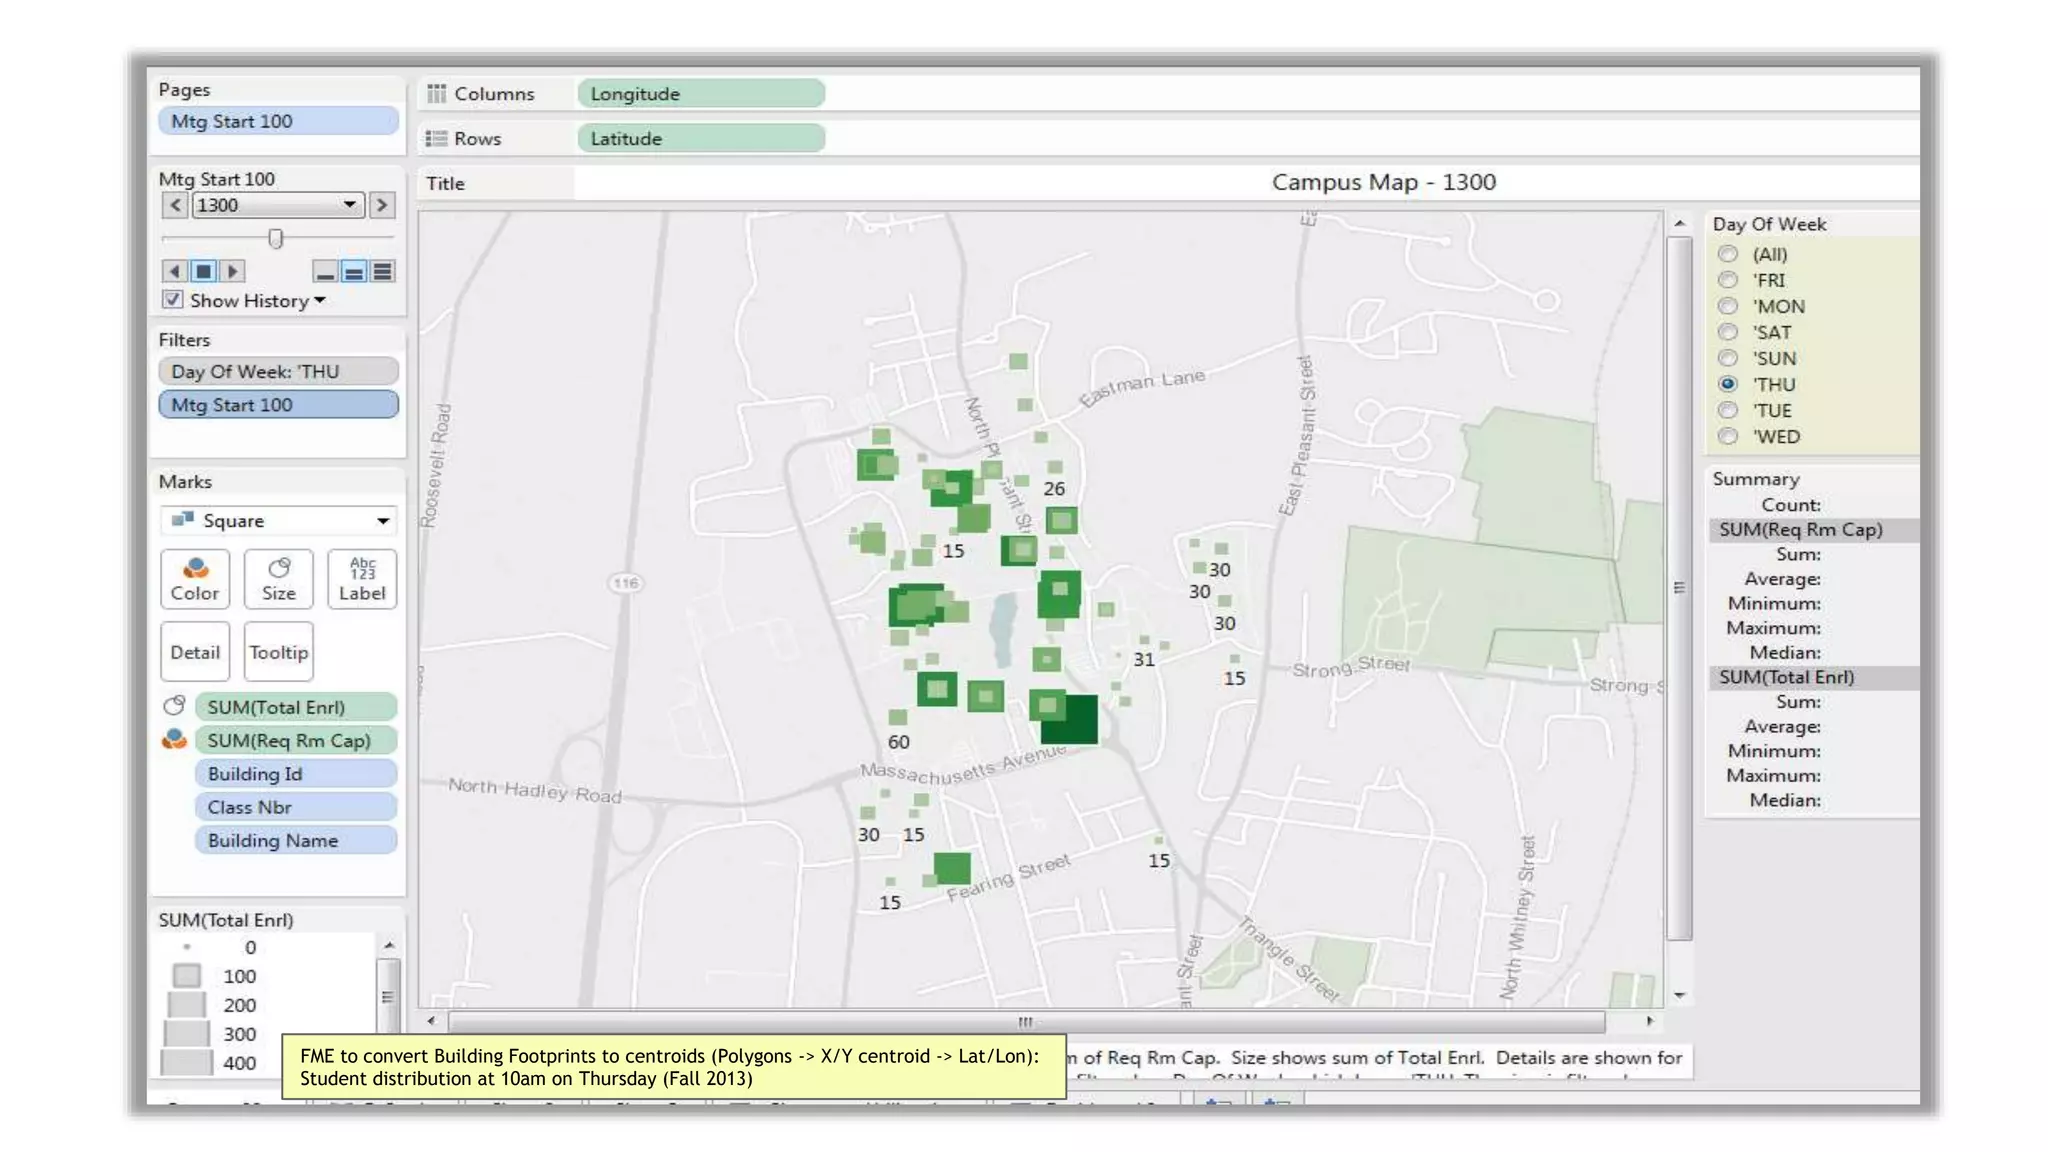
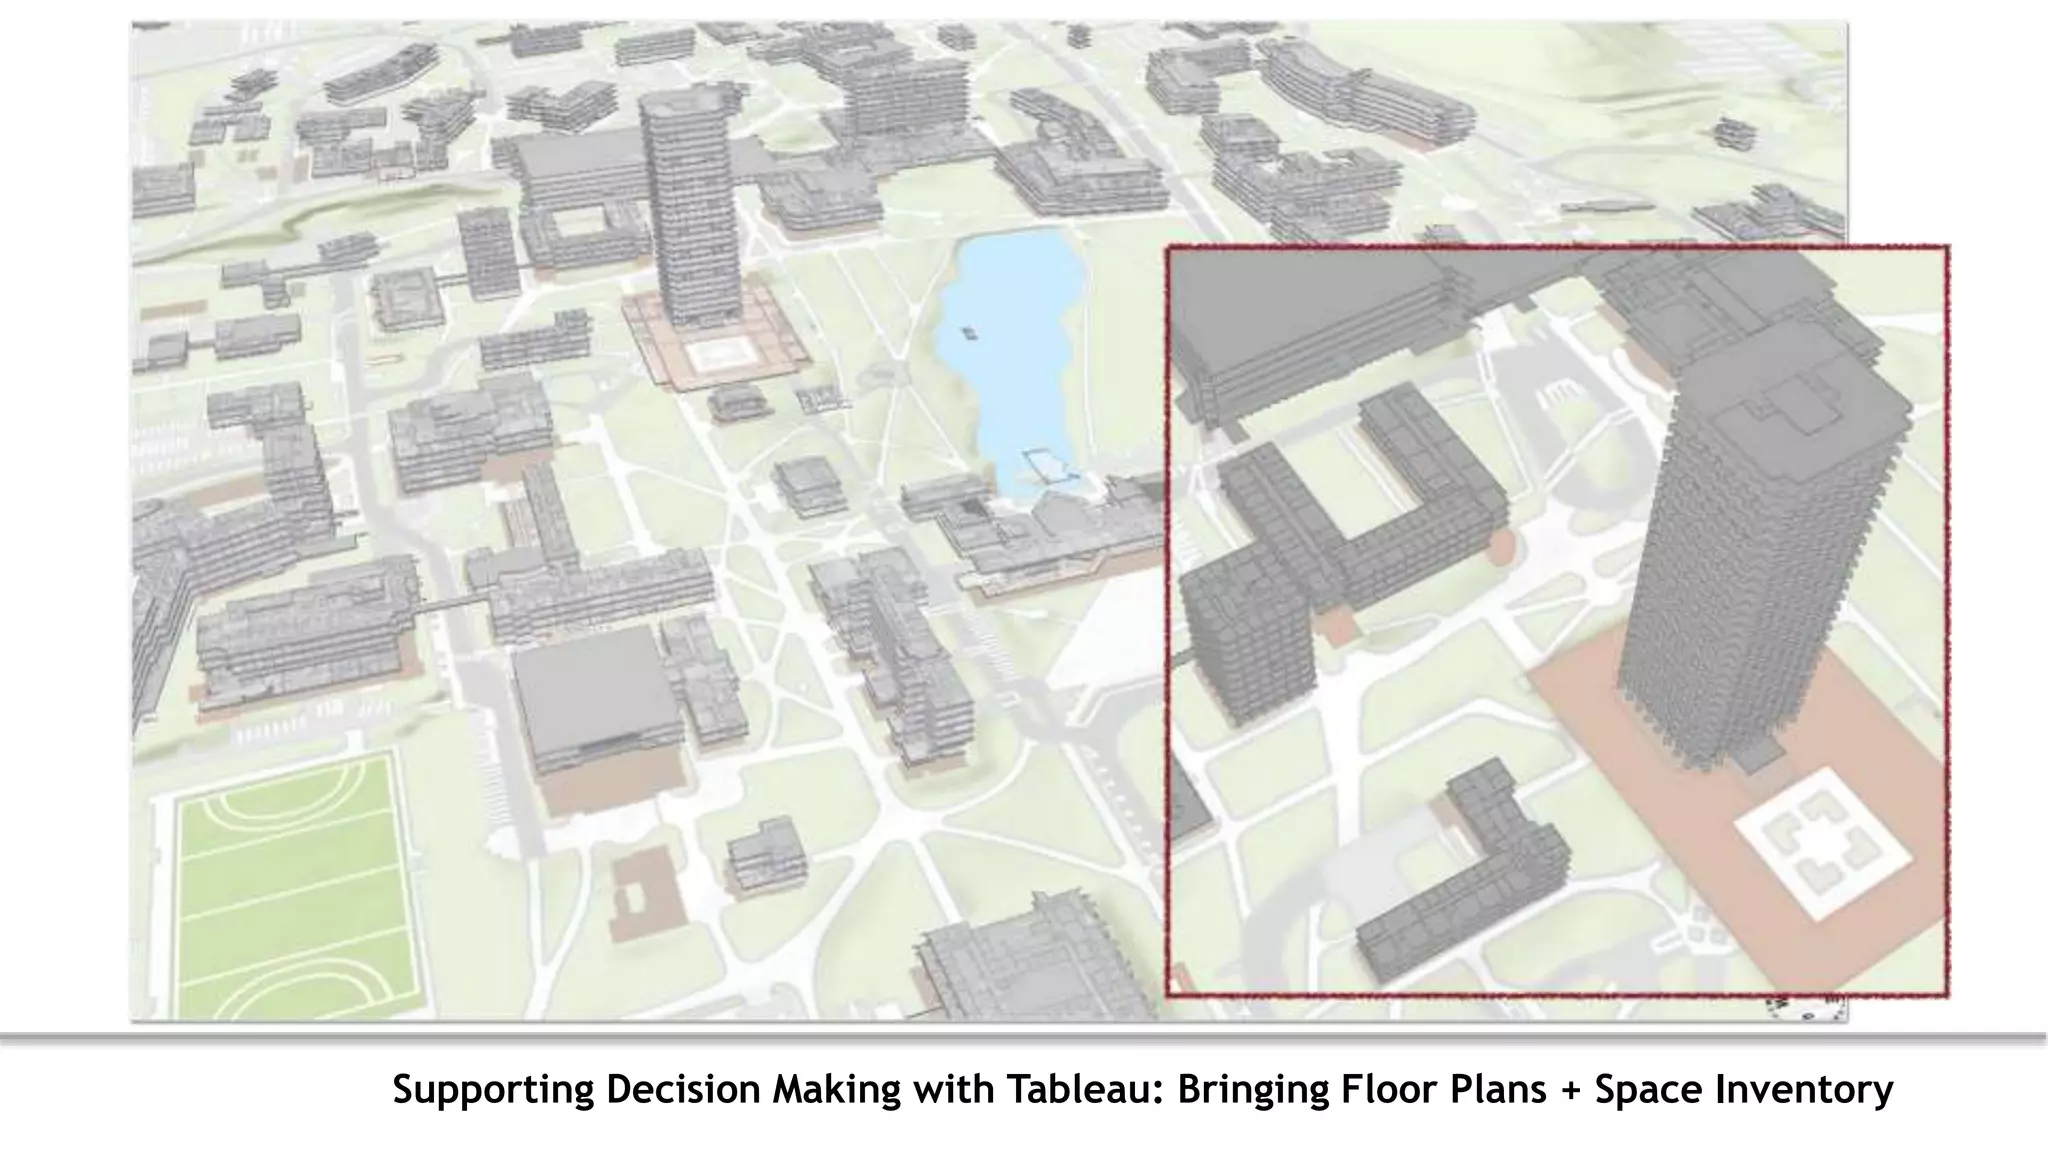
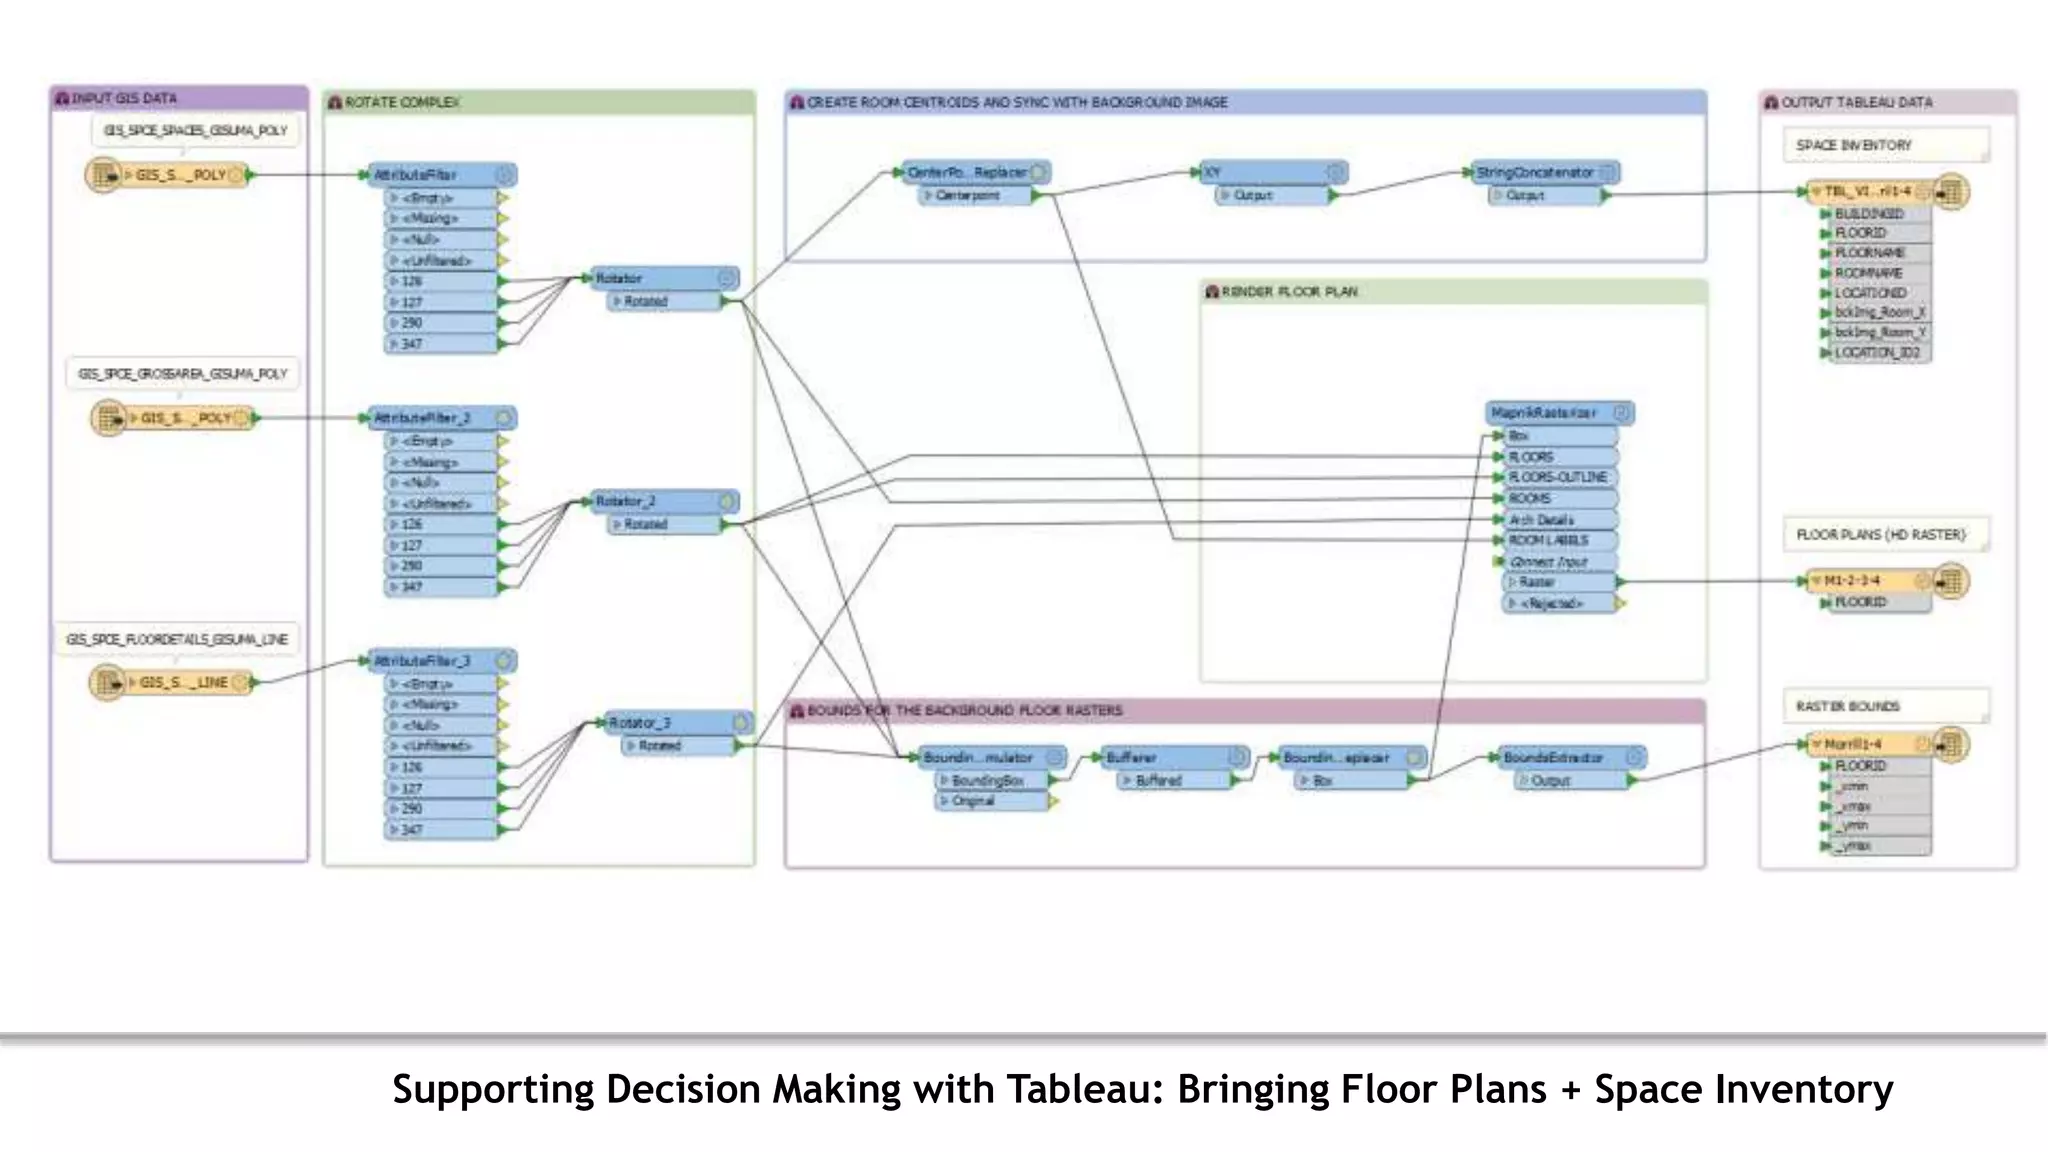
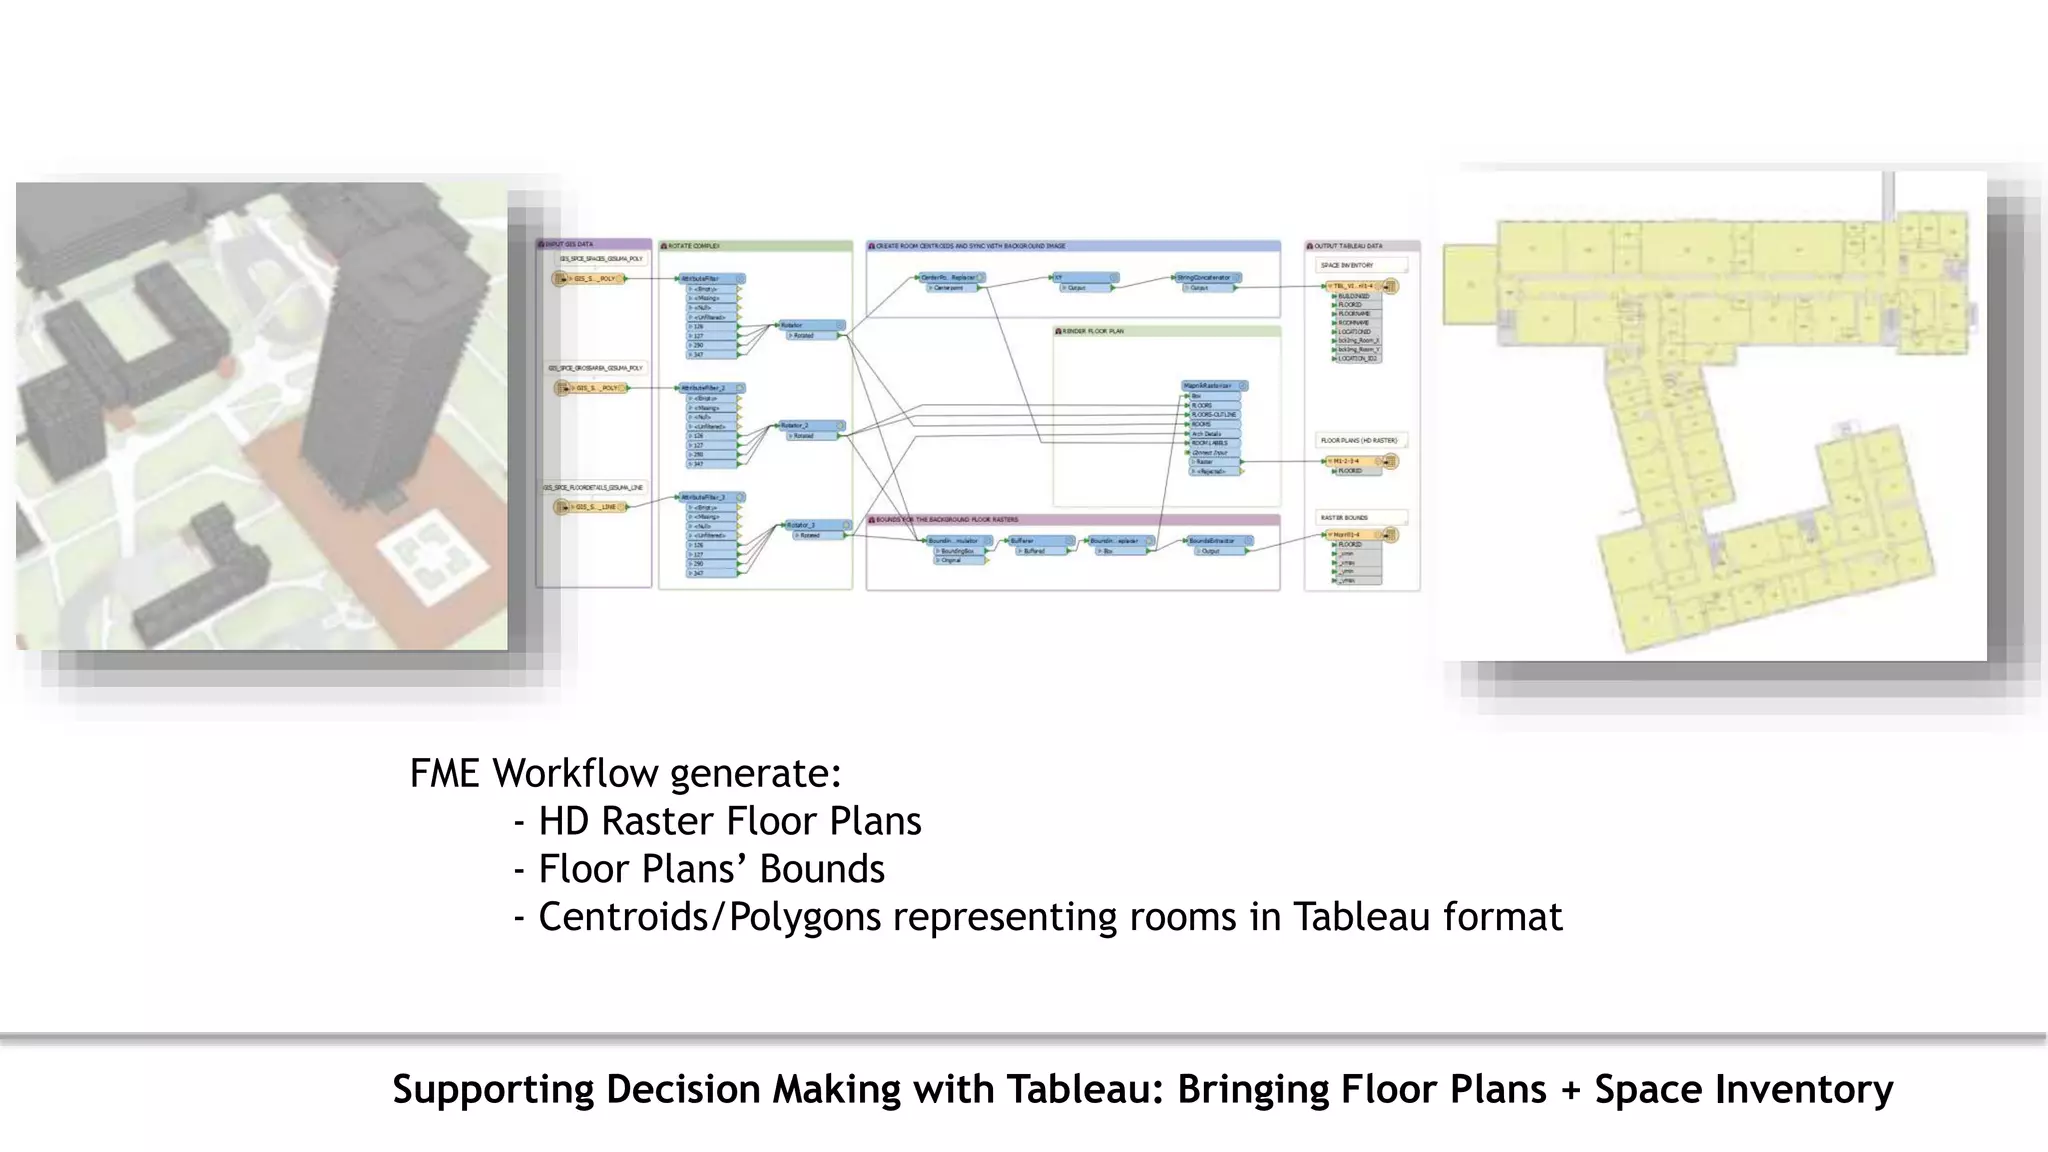
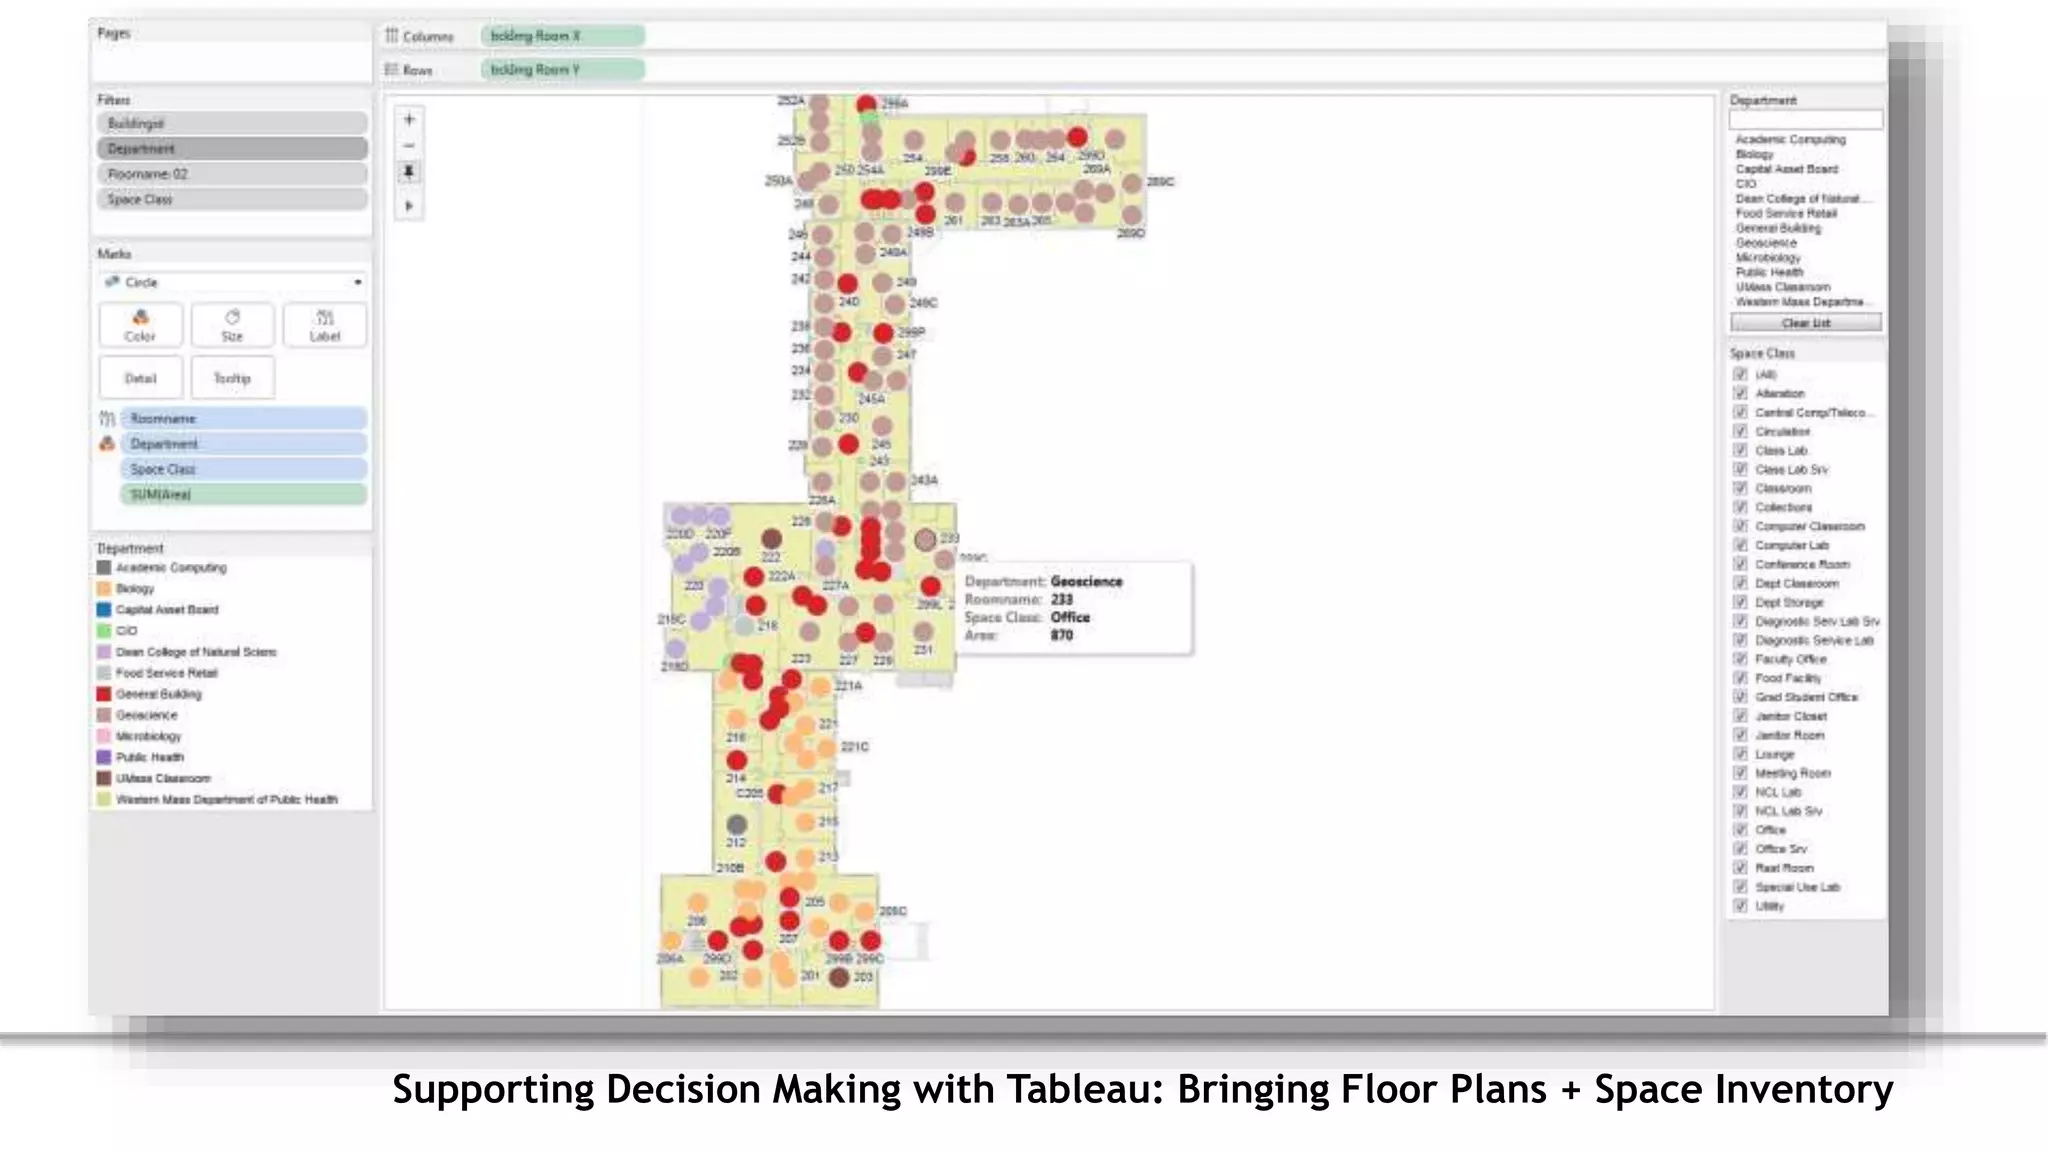
University and College Campuses are complex environments. The campus comprises many physical sub-systems, such as buildings, outdoor spaces, utilities, transportation, which are maintained by several divisions using multiple IT tools and different formats. Making campus-wide analytics requires bringing all these data elements and different formats (CAD, GIS, BIM) together to create a comprehensive common operating picture. In this presentation we will demonstrate that FME Technology is a key and crucial component in data automation and integration on Campus scale.
Enabling Spatial Decision Support and Analytics on a Campus Scale with FME Technology: Bringing GIS, CAD, BIM and Tableau Together
1. Enabling Spatial Decision
Support and Analytics on a
Campus Scale with FME
Technology: Bringing GIS, CAD,
BIM and Tableau Together
“Do more with less”
Alexander Stepanov
GIS Architect
AFS, UMass-Amherst
2. About Us
GIS Architect, AFS Systems
FME Certified Professional
Alexander Stepanov “Do more with less” “Essential Tool”
I use FME technology
everyday for last 6 years.
FME Golf
4. Campus is a complex system (decomposition)
Processes
• Academic/Teaching
• Research
• Operations
• Residential Life
“No buffer space”
“Changes all the time”
“Divide & Conquer”
10. 3. Campus is a Complex System
Spatial Data: CAD, GIS, BIM, NavisWorks
Non-Spatial Data: MS SQL Server, SharePoint, Excel, Other DBs, Text files
Diff IT
Systems
• Specialization (to cope with complexity)
• Multiple databases
• “Silos” & “Silos Paradox”
• Living organization/changes!
Location/Space & Time as KEY to join and
relate entities/features in the DBs.
How can we create & maintain
‘comprehensive’ spatial model/db of
Campus efficiently.
12. Decision Problems on Campus Scale +
My definition of Data InterOp problem
• Within Spatial Context
• Effect ‘other’ sub-systems
• KPIs have spatial component
• Awareness of trends/projects
• Require integration of multiple data-sources
• Snapshot of performance matrix
• Snapshot of current ‘state’ of the system
• Data Interoperability issue is a native issue
for large organizations
14. Why FME
Technology is a
right tool for
the job
• Automation
• Re-use of workflows
• Easy to teach and
learn
• Adaptive to user
requests or problem
nature
• Data-centric &
format-agnostic
15. Innovate or Perish …
http://www.faberinfinite.com/are-we-too-busy-to-improve-2/
30. Gartner's Magic Quadrant for Business Intelligence and Analytics Platforms
Tableau is a powerful and an intuitive BI
package. Many examples and use cases are
based on a regional scale.
How we can integrate it with GIS on a Campus
scale?
Gartner Technology Review: 2015 & 2016
32. Default Tableau map (service) UMass-Amherst GIS map ( + 200 Buildings)
How we can approach reporting on building level with Tableau?
a) How to bring GIS Building footprints into Tableau shapes?
b) How to bring centroids of Buildings as X/Y (lat/lon) into Tableau?
Example of case use: Teaching/Instruction/Operations happen in Buildings …
33. Converts BUILDINGS footprints from GIS representation to SQL Table
which represents a line by storing shape_id, point sequence and lat/long.
Most complex part is “VertexCounter” transformer ….
Available as a free custom transformer from FME Store …
Programming time – 0.
Example of simple FME workflow to bring any polygon/line GIS geometry into Tableau
34. Building Footprints in Tableau.
Now it’s ready to be connected with data tables and to run analytics
35. FME to convert Building Footprints to centroids (Polygons -> X/Y centroid -> Lat/Lon):
Student distribution at 10am on Thursday (Fall 2013)