Download to read offline
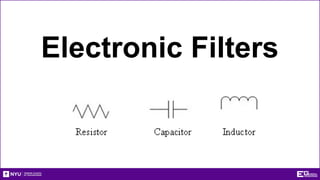
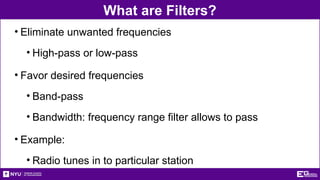
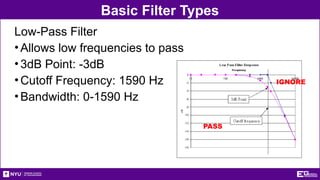


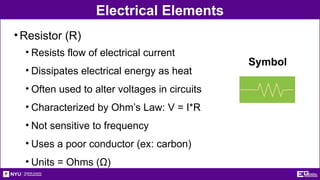
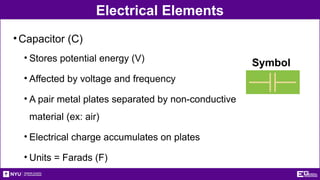


The document outlines the objectives, types, and applications of electronic filters, including low-pass, high-pass, and band-pass filters with associated cutoff frequencies and bandwidths. It details the materials and procedures for assembling circuits and testing their performance using NI ELVIS II equipment, along with requirements for individual reports and team presentations. Electrical terminology, elements, and wiring configurations are also explained to support practical applications in the experiments.