From ELANA Trading: Why Bulgaria?
•
1 like•704 views

This document provides an overview of Bulgaria and its economy. Some key points: - Bulgaria has a population of 7.3 million people and its currency is the lev, which is pegged to the euro. It has been a member of NATO and the EU since 2004 and 2007 respectively. - Bulgaria has a well-educated workforce, low costs of doing business including favorable tax rates and rents, and a strategic location providing access to key European and Middle Eastern markets. - The economy has grown in recent years and outperformed the EU average. Unemployment is decreasing and inflation is low. The government maintains fiscal discipline with a low debt level. - Major industries include manufacturing, trade, mining, and tourism

Recommended
Recommended
More Related Content
What's hot
What's hot (20)
Viewers also liked
Viewers also liked (16)
Similar to From ELANA Trading: Why Bulgaria?
Similar to From ELANA Trading: Why Bulgaria? (20)
More from ELANA Group
More from ELANA Group (20)
Recently uploaded
Recently uploaded (20)
From ELANA Trading: Why Bulgaria?
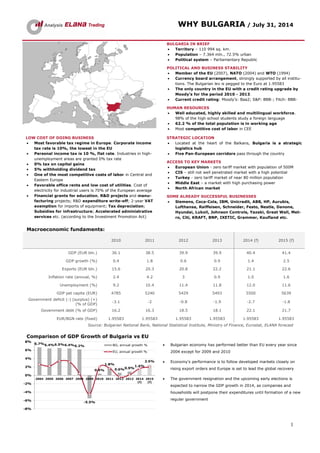
- 1. WHY BULGARIA / November, 2016 1 BULGARIA IN BRIEF Territory – 110 994 sq. km. Population – 7.364 mln, 72.5% urban Political system – Parliamentary Republic POLITICAL AND BUSINESS STABILITY Member of the EU (2007), NATO (2004) and WTO (1994) Currency board arrangement, strongly supported by all institu- tions. The Bulgarian lev is pegged to the Euro at 1.95583 The only country in the EU with a credit rating upgrade by Moody’s for the period 2010 - 2013. Current credit rating: Moody’s: Baa2; S&P: BB+; Fitch: BBB- HUMAN RESOURCES Well educated, highly skilled and multilingual workforce. 98% of the high school students study a foreign language 62.2 % of the total population is in working age Most competitive cost of labor in CEE LOW COST OF DOING BUSINESS Most favorable tax regime in Europe. Corporate income tax rate is 10%, the lowest in the EU Personal income tax is 10 %, flat rate. Industries in high- unemployment areas are granted 0% tax rate 0% tax on capital gains 5% withholding dividend tax One of the most competitive costs of labor in Central and Eastern Europe Favorable office rents and low cost of utilities. Cost of electricity for industrial users is 70% of the European average Financial grants for education, R&D projects and manu- facturing projects; R&D expenditure write-off; 2-year VAT exemption for imports of equipment; Tax depreciation; Subsidies for infrastructure; Accelerated administrative services etc. (according to the Investment Promotion Act) STRATEGIC LOCATION Located at the heart of the Balkans, Bulgaria is a strategic lo- gistics hub Five Pan-European corridors pass through the country ACCESS TO KEY MARKETS European Union - zero tariff market with population of 500M CIS – still not well penetrated market with a high potential Turkey - zero tariff market of near 80 million population Middle East – a market with high purchasing power North African market SOME ALREADY SUCCESSFUL BUSINESSES Siemens, Coca-Cola, IBM, Unicredit, ABB, HP, Aurubis, Lufthansa, Raiffeisen, Schneider, Festo, Nestle, Danone, Hyundai, Lukoil, Johnson Controls, Yazaki, Great Wall, Metro, Citi, KRAFT, BNP, IXETIC, Grammer, Kaufland etc. KEY Indicators 2014 2015 2016f 2017f 2018f GDP (EUR bln.) 42.7 44.2 45.4 47.2 49.3 GDP growth (%) 1.5 3 2.6 2.5 2.7 GDP pet capita (EUR) 5 810 6 136 6 265 6 419 6 693 Private consumption 2.2 0.7 1.5 2.7 2.5 Fixed capital formation 3.4 2.5 0.1 1.1 3.2 Exports -0.1 7.6 4.4 3.9 4.1 Imports 1.5 4.4 3.5 3.8 4.1 Inflation rate (annual, %) -1.6 -1.1 -1 1.5 1.6 Unemployment (%) 11.4 9.1 8.1 7.3 6.8 Government deficit (-) (surplus) (+) (% of GDP) -3.7 -2.1 -2 -1.4 -1 Government debt (% of GDP) 26.9 26.7 29.2 25 25 EUR/BGN rate (fixed) 1.95583 1.95583 1.95583 1.95583 1.95583 FDI (% of GDP) 3.6 3.6 3.7 3.7 3.8 Copporate lending (real) -10.8 -1.8 0 2.9 4.9 Household lending (real) -1.6 -1.3 0.4 3.3 3.8 Source: Bulgarian National Bank, National Statistical Institute, Ministry of Finance, Eurostat, ELANA forecast Comparison of GDP Growth of Bulgaria vs EU Bulgarian economy has outperformed EU’s overall real growth every year since 2004 except for 2009 and 2010 Economy’s performance is to follow developed markets closely on ris- ing export orders and improving labor market Russian/Ukraine conflict uncertainty was easily overcome in 2015 with increased government spending and improving labor market. Domestic demand is expected to strengthen further in 2016 and compensate for slower exports and government spending. 6.9% 5.8% -5.0% 0.7% 2.0% 0.5% 1.1% 1.5% 3.0% 2.6% 2.5% -6% -4% -2% 0% 2% 4% 6% 8% BG, annual growth % EU, annual growth %
- 2. WHY BULGARIA / November, 2016 2 Structure of GVA by output in 2014, annual data, percentage share INCREASING INDUSTRY SHARE A strong industrial basis in the country is a condition for boosting competitiveness, sustainable growth and new jobs Bulgaria is among the few EU countries, which have increased not only the industry share during the last decade, but the manufactur- ing share of the total GDP – to around 23% in 2015 In comparison – since 2000 the average share of manufacturing in EU countries had declined to average 15% of GDP General government balance, 2013-2015 average, % of GDP; Eurostat PRESERVED FISCAL DISCIPLINE Due to a challenging economic and financial environment over the last couple of years, including a government support for banks, the last few governments have been running budget deficits Improving revenue collection is a key objective to stimulate the economy together with better EU funds absorption. Accordingly, preliminary October 2016 budget numbers came at 3.8% of GDP budget surplus Yet, the government expects to end 2016 with a balanced budget rather than a 2% planned 2016 deficit and continue gradually de- creasing the gap to a balance in 2019 Government gross debt in 2015;% of GDP; Eurostat LOW GOVERNMENT DEBT Since 1999, Bulgaria has managed to reduce the ratio of govern- ment debt to GDP from around 80% to below 30% Growing economy and tight fiscal discipline contributed to low debt- to-GDP ratio vs EU average Bulgaria has the lowest debt-to-GDP ratio in EU after Estonia and is among countries with low debt-servicing costs New debt issuance is funding the small budget deficits the govern- ment is running to stimulate economic growth and invest in the country’s outdated infrastructure Main export partners in 2015; Exports in EUR m; Eurostat EU – MAJOR TRADING PARTNER Bulgaria has close commercial ties with the EU, which accounts for around 60% of exports During the last few years there is an increase of the share of ex- ports to countries with higher economic growth potential, such as Germany and Turkey. 2016 Turkish coup has not affected exports more than normal trading dynamics There is also a shift of the geographical structure of exports to- wards third markets, especially in Asia Exports to China have nearly tripled for the last five years 5.3% 28.3% 66.4% 0% 10% 20% 30% 40% 50% 60% 70% 80% Agriculture Industry Services 2000 2013 +1 p.p.
- 3. WHY BULGARIA / November, 2016 3 FDI flows by industry, 1996-2014, EUR m SIGNIFICANT AMOUNT OF FDI IN INDUSTRY Industry has attracted 1/3 of the total FDIs for the period, as big- gest investors are supported through a priority investment scheme The freeze of the main tax rates during the crisis ensured a predict- able business and investment environment Bulgaria has significant advantages and investment potential in Chemistry and related industry; Electrical engineering and electron- ics; IT; Transport and logistics; Tourism; Food and agriculture; Me- chanical engineering EU co-funding for Bulgaria for next programming period 2014-2020 amounts to EUR 15.9bn (c. 5% of the forecast GDP for the period) 5-year CDS Levels; Bloomberg STABLE CDS LEVEL Bulgarian 5-year USD CDS stands at 166 in June 2016 – one of the lowest among Frontier/Emerging markets It has been permanently below 200 for the last 4 years Yields on 10-year BG Government bonds have aggressively fallen from 7.5% in 2009 to around 2.5% at current market quotes in June 2016 In 2015, Bulgaria place EUR 3.1bn in 7-, 12- and 20- year notes at 2%, 2.65% and 3.125% yields, respectively. In 2016, it plans to tap international market again with a EUR 2bn issue *As of 1 July 2011 the Japan Credit Rating Agency (JCRA) withdrew its rating due to termination of contract relations with Bulgaria GRADUAL UPGRADING OF THE SOVEREIGN CREDIT RATING The stable fiscal position of the country in the last 17 years con- firmed the ability of the several governments to meet their deficit targets and maintain public finance stability 2014 political and banking instability affected negatively the coun- try's credit rating. Nevertheless, the new government is yet to per- form needed reforms to substantiate a credit rating upgrade. In June 2016, the three US credit rating agencies confirmed their ratings on Bulgaria with stable perspectives citing regulatory and institutional weaknesses despite stable fiscal position and low debt/GDP. Government Securities (GS) continue to attract significant interest from banks, pension funds, insurance companies and guarantee funds Market capitalization to GDP in 2014, % HUGE UPSIDE POTENTIALOF MARKET CAP TO GDP RATIO Bulgarian capital market capitalization is 10% of the GDP - signifi- cantly below peer markets in the CEE region With the forecasted better market performance in next years, new interesting IPOs are expected The government is expected to sell its stake in different state com- panies through the stock exchange 12,249 10,834 7,686 6,876 2,062 3,007 0 4,000 8,000 12,000 Manufacturing, energy and mining Construction and real estates Finance Trade Telecommunications Other Moofy's S&P Fitch JCRA* Aaa AAA AAA AAA … … … … Aa1 AA+ AA+ AA+ Aa2 AA AA AA Aa3 AA- AA- AA- A1 A+ A+ A+ A2 A A A A3 A- A- A- Baa1 BBB+ BBB+ BBB+ Dec. 2014 Baa2 BBB BBB BBB last change Baa3 BBB- BBB- BBB- Ba1 BB+ BB+ BB+ Ba2 BB BB BB Ba3 BB- BB- BB- B1 B+ B+ B+ B2 B B B B3 B- B- B- Dec. 1996 Caa CCC+ CCC CCC … … … … Caa D D D InvestmetgradeSubinvestment grade 0% 20% 40% 60% 80% Ukraine Bulgaria Romania Slovenia Hungary Greece Italy Turkey Croatia Poland Russia Germany France
- 4. BULGARIAN STOCK MARKET / November, 2016 4 STOCK MARKET INFRASTRUCTURE STOCK MARKET SNAPSHOT Market Operator Bulgarian Stock Exchange- Sofia Market Capitalization EUR 4.7 bln. Custody Central Depository Market Capitalization/GDP 10% Regulator Financial Supervision Commission Main Index SOFIX Legislation Fully EU/MIFID Harmonized Total 2015 turnover EUR 210 m. Trading platform XETRA (provided by Deutsche Boerse) Average daily turnover (2015) EUR 850 k. Bulgarian stock ex- change shareholder structure Government owns 50% (expected privatiza- tion in the coming years) Top 10 Average free float 33% Corporate govern- ance National code since 2007, National commis- sion since 2009, Corporate Governance In- dex (CGIX) since 2011 SOFIX P/E 10.5 SOFIX P/B 0.90 TOP 5 COMPANIES BY MARKET CAP, (Oct 2016, in EUR m) TOP 5 MOST TRADED STOCKS IN Q3’16 (in EUR m). Company Name (Ticker) Market Cap Company Name (Ticker) Turnover Sopharma (3JR) 204 Monbat (5MB) 8.5 Tchaikapharma (7TH) 186 Agria Group Holding (A72) 4.0 Chimimport (6C4) 166 Biovet (53B) 3.46 Monbat (5MB) 153 Chimimport (6C4) 1.68 First Investment Bank (5F4) 134 First Investment Bank (5F4) 1.4 SOFIX BEST PERFORMER IN CEE OVER THE LAST 12M… …. AS WELL AS OVER THE LAST 5 YEARS Source:Bloomberg RECENT MARKET PERFORMANCE Bulgarian market has outperformed its regional peers YTD and over the last 5 years three key factors: increased local demand both from retail and institutional investors, the inception of the first SOFIX ETF and the attractive market valuation Yet, the market has significant long term potential for catching up with global markets’ recovery In 2009, Bulgarian market dropped by 87% from its 2007 peaks. Currently it has only recovered around 15% from the 2007 peak, while most of the developed markets have already reached or are close to their peaks. Bulgarian market has also strong potential to increase com- pared to other frontier markets, as some of attractive frontier markets, such as Baltic stock markets, are already above their pre-crisis peak levels The stable potential for growth is also based on the already started gradual increase of the economy and disposable per- sonal income, as well as the high level of bank deposits of indi- viduals (50% of GDP) WIG20 BET BELEX15 CRO SOFIX -10% -5% 0% 5% 10% 15% 20% 25% 60 80 100 120 140 160 180 200 SOFIX BET CRO WIG20 BELEX15
- 5. BULGARIAN STOCK MARKET / November, 2016 5 Pension funds AUM, EUR bn, FSC BULGARIAN PENSION FUNDS ASSETS DOUBLED IN FIVE YEARS Assets under management of the local pension funds more than doubled over the last five years to EUR 4.86 bn at the end of 2015 Pension fund assets to Bulgarian stock exchange market capital- ization exceeded 100% in 2015 16% of the pension funds’ assets are in equities and approx. 50% are in government and government guaranteed debt at the end of 2015 ATTRACTIVE MULTIPLES POSITION VS THE REGION AND THE WORLD INDICE COUNTRY P/E* P/B* SOFIX Bulgaria 10.36 1.10 DAX Germany 19.34 1.64 S&P500 USA 19.92 2.77 WIG 20 Poland 30.21 1.04 ASE Greece n/a 0.49 BET Romania 16.84 0.83 CROBEX Croatia 17.45 1.06 MSCI FM CEE+CIS World 9.03 0.91 *As of November 7th , 2016, Source: Bloomberg ELANA TOP PICKS COMPANY TICKER MARKET CAP LAST PRICE (Nov 8, 2016) 1-YEAR PRICE TARGET fP/E RECOMMENDATION Speedy 0SP BU 192 m 36.10 38.42 15.80 HOLD Monbat 5MB BU 313 m 8.03 9.45 8.3 BUY Sopharma 3JR BU 411 m 3.04 3.09 14.56 BUY Sopharma Trading SO5 BU 197 m 6.00 6.12 11.08 BUY Bulgarian Real Estate Fund REIT* 5BU BU 45 m 2.25 2.70 (intr.value.) 0.43 (p/b) BUY Sirma Group Holding SKK BU 57 m 0.96 1.78 28.2 BUY P/E ratios are on a forward 12M base; figures are in Bulgarian lev /BGN/*3-for-1 stock split as of Feb 29th , 2016
- 6. BULGARIAN STOCK MARKET / November, 2016 6 FIRST ETF IN BULGARIA EXPAT BULGARIA SOFIX UCITS ETF SEEKS TO TRACK THE PERFORMANCE OF SO- FIX, THE LEADING MARKET INDEX ON THE BULGARIAN STOCK EXCHANGE. FUND FACTSHEET PERFORMANCE, PORTFOLIO BREAKDOWN AND NET ASSET INFORMATION OCTOBER, 2016 ALL DATA AS OF OCTOBER 26TH , 2016 KEY BENEFITS Full replication of SOFIX’ performance aka direct exposure to 15 best stocks in Bulgaria. Direct macro exposure to the Bulgarian economy Better liquidity vs individual stock position on the Bulgarian Stock Exchange as the fund has three prime brokers as market makers Tax efficient as capital gains are not taxed in Bulgaria but special taxation ar- rangements may prevail for foreign investors Ease of trading as the fund trades as any other ordinary stock on the market Potential considerable inflows from local and international institutional investors; BGN 20m attracted at the beginning Nov. 2016 from local pension funds KEY SHORTCOMINGS Short history Higher expense ratio more in line with a general UCITS mutual fund rather than an ETF may lead to higher tracking error Can exhibit higher tracking error as up to 20% of assets can be invested in cash due to UCITS regulation FUND PERFORMANCE Since inception 1M 6M 12M Fund 3.32% 1.88% n/a n/a Benchmark 6.23% 2.64% 19.06% 16.66% PERFORMANCE OVER THE LAST MONTH Source: Bloomberg EXCHANGE RATES EUR/BGN (FIXED): 1.95583 USD/BGN: 1.74239 KEY FACTS Asset Class Equity Fund Base Currency BGN Inception Date Sept. 27th , 2016 Trading Venue Bulgarian Stock Exchange Benchmark SOFIX Index ISIN BG900001163 Expense Ratio 1% Operation expenses 1.5% Domicile Bulgaria UCITS Yes Use of Income Reinvest Net Assets: BGN 1.97m Number of Holdings 15 Shares Outstanding 1.88m BSE Ticker BGX Bloomberg Ticker BGX BU Distributor Expat Capital Market Makers ELANA Trading; Benchmark and FFBH HOLDINGS (%) SECTORS BREAKDOWN (%)* Company Ticker SOFIX weight BGX weight Sopharma 3JR 14.60% 12.56% Advance Terrafund REIT 6A6 11.84% 9.85% Chimimport 6C4 10.79% 8.99% Monbat 5MB 10.28% 8.56% Stara Planina Hold 5SR 7.58% 6.19% Albena 6AB 7.38% 6.10% M+S Hydraulic 5MH 6.00% 4.88% CB First Investment Bank 5F4 5.32% 4.35% Holding Varna 5V2 4.46% 3.70% Neochim 3NB 4.49% 3.68% Bulgarian Real Estate Fund REIT 5BU 3.97% 3.30% Industrial Capital Holding 4I8 3.62% 2.98% Trace Group Hold T57 3.47% 2.94% CB Central Cooperative Bank 4CF 3.15% 2.61% Industrial Holding Bulgaria 4I8 3.05% 2.54% Source: Company data 0 50 100 150 200 250 300 350 400 0.990 0.995 1.000 1.005 1.010 1.015 1.020 1.025 1.030 BGNThousands Fund Flow (right) BGX NAV SOFIX Industrials; 40.76% Healthcare; 12.56% Real Estate; 13.15% Consumer Discretionary; 9.80% Financials; 6.96% Cash; 16.76%
- 7. BULGARIAN STOCK MARKET / November, 2016 7 1 – year stock performance ELANA AGROCREDIT (0EA BU) The first leasing company in Bulgaria specialized in extending funds to farmers for land acquisition and working capital loans. Reaps profits from the ongoing land appreciation as prices in Bul- garia are still 3x below EU average and the steady EU funding Started active operations in 2014. Currently, has a portfolio of BGN 25m of leasing at an average interest of 9.5% Incorporated as a joint stock company, but operates as a REIT distributing 90% of profits 5% average DY and 8% average ROE since inception, both to double with portfolio expansion 1 – year stock performance SOPHARMA TRADING (SO5 BU) Leading pharmaceutical distributor in Bulgaria Key hospitals’ medicine, equipment and consumables provider; developing own pharmacy chain; Expanding in Serbia 8% CAGR of the top line to BGN 600m+ in FY2015 with 15% av- erage ROE Good corporate governance with a constant dividend payout of 80% with 6% average DY over the last five years Expected stable market growth of 3-5%, supported by rising government healthcare spending, outdate hospital infrastructure and continued consolidation and investment in the sector 1 – year stock performance MONBAT (5MB BU) The largest lead-acid batteries producer in Bulgaria with 9% CAGR of revenues for the last five years Own recycling facilities in Bulgaria, Romania and Serbia, reducing the risk of lead price volatility and stabilizing profitability at 16- 19% average EBITDA margin Excellent market diversification, as the company exports to over 20 countries with key market in Western Europe 15% average ROE and 3% average DY over the last five years 1 – year stock performance SPEEDY (0SP BU) Leading courier in Bulgaria with a strong position in both B2B and B2C segments, incl. e-commerce. Joined forces with La Poste’s land courier – GeoPost and its DPD network in Europe. GeoPost has the option to increase its current stake from 25% to 70% in 2020 at 8x EV/EBITDA. In expansion mode with aggressive market penetration in Roma- nia in 2015 26% CAGR of revenues over the last five years, including the ac- quisition of DPD Romania at the end of 2014 57% average ROE and 4% average DY over the last five years 0 5000 10000 15000 20000 25000 30000 35000 40000 45000 50000 6.00 6.50 7.00 7.50 8.00 8.50 Oct'15 Jan'16 Apr'16 Jul'16 Oct'16 Volume (RS) Stock price in BGN
- 8. BULGARIAN STOCK MARKET / November, 2016 8 1 – year stock performance SIRMA GROUP HOLDING (SKK BU) Leading software and product development IT group in Bulgaria diversified in software engineering, semantic technologies, sys- tem integration, cloud and mobile solutions, e-government, CAD/CAM and collocation services 19% CAGR of revenues over the last five years. Raised BGN 11.5m in an IPO in Sofia in the autumn of 2015 Started expanding in the US in 2015 with key emphasis on the sales and project management function Targets 4x top line expansion by 2020 HIGHEST DIVIDEND PAYERS ON THE MARKET # COMPANY TICKER DIVIDEND YIELD* 2011 2012 2013 2014 2015 5 YEAR AVERAGE DY 1 Agrofinance REIT 6AG 3.27% 2.44% 3.23% 2.99% 6.15% 3.62% 2 Sopharma Properties REIT 6S6 2.46% 15.36% 7.03% 6.64% 6.00% 7.50% 3 Hydraulic Elements and Systems 4HE 3.48% 3.01% 1.98% 4.65% 5.97% 3.82% 4 Bulland Investments REIT 5BD 11.28% 10.54% 7.33% 14.60% 5.88% 9.93% 5 Sopharma Trading SO5 9.26% 7.69% 4.51% 4.91% 5.26% 6.33% 6 Stara Planina Hold 5SR 0.66% 0.58% 1.15% 2.39% 5.15% 1.98% 7 Advance Terrafund REIT 6A6 13.23% 18.95% 14.22% 12.24% 4.90% 12.71% 8 M+S Hydraulic 5MH 5.97% 6.47% 3.47% 4.11% 4.32% 4.87% 9 Bulgarian Real Estate Fund REIT 5BU 30.64% 10.64% 4.05% - 4.27% 12.40% 10 Oli&Gas Exploration and Production 4O1 0.00% 0.00% 9.57% 7.66% 4.13% 7.12% 11 Elana Agrocredit 0EA 0.00% 0.00% 0.00% 5.92% 4.12% 5.02% 12 Monbat 5MB 4.18% 3.16% 2.59% 1.83% 3.83% 3.12% 13 Korado 4KX 0.00% 0.00% 0.00% 4.00% 3.60% 3.80% 14 Unipharm 59X 6.58% 1.67% 3.00% 4.65% 3.57% 3.89% 15 Chimimport 6C4 - - - - 3.52% - 16 Elhim Iskra 52E 2.63% 2.81% 1.63% 4.00% 3.38% 2.89% 17 Speedy 0SP 0.00% 5.58% 4.00% 3.23% 3.10% 3.98% 18 Fazerles 4F6 2.40% 1.52% 2.02% 4.00% 2.77% 2.54% 19 Trace Group Hold T57 - 0.84% 1.98% 1.94% 2.70% 1.86% * Data on 2015 Source: Bulgarian Stock Exchange Now you know Why Bulgaria, find us at: DIMITAR GEORGIEV Head of Trading direct: +359 2 81 000 25 dept: +359 2 81 000 20 mobile: +359 887 695 745 fax: +359 2 958 15 23 mail: georgievd@elana.net TATYANA PUNCHEVA-VASSILEVA Head of Research direct: +359 2 81 000 24 dept: +359 2 81 000 20 mobile: +359 889 531 209 fax: +359 2 958 15 23 mail: vasileva@elana.net Research reports on Bulgaria ELANA Trading www.elana.net/trading 5, Lachezar Stanchev St., Sopharma Business Towers, Tower B, Floor 12-13 1756 Sofia, Bulgaria