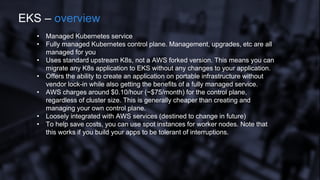
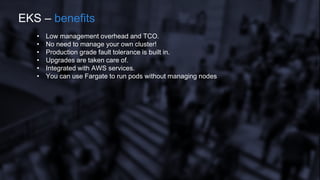
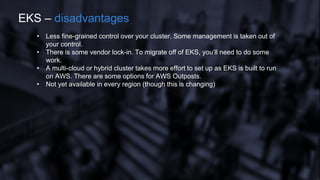
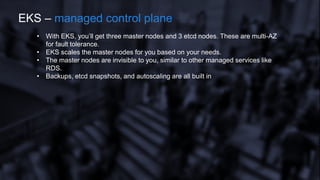
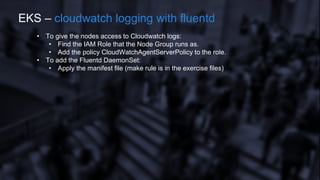
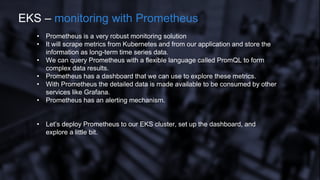
AWS Elastic Container
service for kubernetes
(EKS)
• Managed Kubernetes service
• Fully managed Kubernetes control plane. Management, upgrades, etc are all
managed for you
• Uses standard upstream K8s, not a AWS forked version. This means you can
migrate any K8s application to EKS without any changes to your application.
• Offers the ability to create an application on portable infrastructure without
vendor lock-in while also getting the benefits of a fully managed service.
• AWS charges around $0.10/hour (~$75/month) for the control plane,
regardless of cluster size. This is generally cheaper than creating and
managing your own control plane.
• Loosely integrated with AWS services (destined to change in future)
• To help save costs, you can use spot instances for worker nodes. Note that
this works if you build your apps to be tolerant of interruptions.
EKS – overview
• Low management overhead and TCO.
• No need to manage your own cluster!
• Production grade fault tolerance is built in.
• Upgrades are taken care of.
• Integrated with AWS services.
• You can use Fargate to run pods without managing nodes
EKS – benefits
• Less fine-grained control over your cluster. Some management is taken out of
your control.
• There is some vendor lock-in. To migrate off of EKS, you’ll need to do some
work.
• A multi-cloud or hybrid cluster takes more effort to set up as EKS is built to run
on AWS. There are some options for AWS Outposts.
• Not yet available in every region (though this is changing)
EKS – disadvantages
• With EKS, you’ll get three master nodes and 3 etcd nodes. These are multi-AZ
for fault tolerance.
• EKS scales the master nodes for you based on your needs.
• The master nodes are invisible to you, similar to other managed services like
RDS.
• Backups, etcd snapshots, and autoscaling are all built in
EKS – managed control plane
• You provision and manage the worker nodes
• VPC is tightly integrated with Kubernetes networking. This means you can
control traffic with standard VPC tools like Security Groups, ACLs, etc. Pods
are given elastic network interface IPs, meaning you can control traffic at the
VPC level granularly. This is a nice benefit. This is all accomplished by using a
DaemonSet on your worker nodes which assigns IP addresses and interfaces
with the VPC service, and then hands the relevant information off to the
kubelet on the node.
• You create worker nodes from an Amazon EKS optimized AMI which runs
Amazon Linux 2. It comes preconfigured with Docker, IAM Authenticator, and
the necessary K8s pieces. Using a user data script, it automatically joins your
EKS cluster.
EKS – worker nodes
• EKS wraps RBAC with IAM, allowing you to connect to and manage your
cluster’s security using IAM instead of the standard Kubernetes RBAC system.
EKS – Authentication/authorization
• Because EKS is a managed AWS service, integration with Elastic Container
Registry is provided.
• Logging to CloudWatch is easy.
• VPC, EC2 (instances, load balancing, autoscaling, etc), etc. are tightly
integrated
• IAM integration
EKS – integration with aws services
• There is a new CLI for working directly with EKS clusters called eksctl.
• To install it, you’ll need the AWS CLI version 2
• Use Homebrew to install eksctl:
• brew tap weaveworks/tap
• brew install weaveworks/tap/eksctl
EKS – eksctl
eks
walkthrough
• I will create the EKS cluster using eksctl
• I will deploy the RV Store application to the cluster using Helm
• I will deploy Cloudwatch logging after an introduction
• I will deploy a Cluster Autoscaler after an introduction and we will watch the
cluster scale up from one node to 4-5 depending on need.
• I will set up detailed monitoring
• I will deploy Prometheus (using Helm) after a brief introduction
• I will deploy Grafana to expose the Prometheus data as a dashboard
EKS – rvstore walkthrough
• Let’s take a look at the Cluster Autoscaler running in EKS
EKS – autoscaling in eks
Log aggregation
With cloudwatch
• With Kubernetes pods are mortal, so it is important to collect logs from our
pods and ship them to a centralized location. Popular tools are Cloudwatch (to
stay AWS native), and EFK (coming up).
• With EKS you can set up log collection in Cloudwatch.
• You can also set up Cloudwatch insights to get additional information. This will
give us access to a new Container Insights section of Cloudwatch.
• We want to set up logging of the control plane as well as our own application
logs.
• The necessary steps are:
• Give the nodes the necessary IAM permissions to be able to create
Cloudwatch Log Groups, Log Streams, etc.
• Set up a Fluentd DaemonSet on the cluster to collect and push logs to
Cloudwatch.
EKS – cloudwatch logging with fluentd
• To give the nodes access to Cloudwatch logs:
• Find the IAM Role that the Node Group runs as.
• Add the policy CloudWatchAgentServerPolicy to the role.
• To add the Fluentd DaemonSet:
• Apply the manifest file (make rule is in the exercise files)
EKS – cloudwatch logging with fluentd
Log collection
With efk
• EFK (commonly just generically referred to as ELK) is a common
logging/visualization platform.
• Elasticsearch (the database of log data)
• Fluentd (the agent for shipping logs to Elasticsearch). Another popular
option is Logstash (where the L comes from).
• Kibana (for visualizing the logs in a web dashboard)
• Elasticseach runs as a StatefulSet in our cluster.
• Fluentd will run as a Daemonset, collecting logs from each node and shipping
them to the Stateful Elasticsearch pods
• Kibana will run as a Deployment and Service.
• Unlike Cloudwatch, nothing is fully hosted and managed, and we don’t need
IAM changes to make it work. But we do have manage things ourselves.
• Let’s add EFK to our EKS cluster and bring up the Kibana dashboard to see
the log data.
EKS – logs with efk
monitoring
With
Prometheus/grafana
• Prometheus is a very robust monitoring solution
• It will scrape metrics from Kubernetes and from our application and store the
information as long-term time series data.
• We can query Prometheus with a flexible language called PromQL to form
complex data results.
• Prometheus has a dashboard that we can use to explore these metrics.
• With Prometheus the detailed data is made available to be consumed by other
services like Grafana.
• Prometheus has an alerting mechanism.
• Let’s deploy Prometheus to our EKS cluster, set up the dashboard, and
explore a little bit.
EKS – monitoring with Prometheus
• Grafana is a popular dashboard tool that integrates seamlessly with
Prometheus to expose the data in an easily consumable way.
• This includes a collection of popular dashboards that others have developed,
and you can just add to your instance.
• Let’s add Grafana to our EKS cluster and explore it a bit.
EKS – dashboards with grafana

EKS AWS Presentation kuberneted oriented

  • 1.
    AWS Elastic Container servicefor kubernetes (EKS)
  • 2.
    • Managed Kubernetesservice • Fully managed Kubernetes control plane. Management, upgrades, etc are all managed for you • Uses standard upstream K8s, not a AWS forked version. This means you can migrate any K8s application to EKS without any changes to your application. • Offers the ability to create an application on portable infrastructure without vendor lock-in while also getting the benefits of a fully managed service. • AWS charges around $0.10/hour (~$75/month) for the control plane, regardless of cluster size. This is generally cheaper than creating and managing your own control plane. • Loosely integrated with AWS services (destined to change in future) • To help save costs, you can use spot instances for worker nodes. Note that this works if you build your apps to be tolerant of interruptions. EKS – overview
  • 3.
    • Low managementoverhead and TCO. • No need to manage your own cluster! • Production grade fault tolerance is built in. • Upgrades are taken care of. • Integrated with AWS services. • You can use Fargate to run pods without managing nodes EKS – benefits
  • 4.
    • Less fine-grainedcontrol over your cluster. Some management is taken out of your control. • There is some vendor lock-in. To migrate off of EKS, you’ll need to do some work. • A multi-cloud or hybrid cluster takes more effort to set up as EKS is built to run on AWS. There are some options for AWS Outposts. • Not yet available in every region (though this is changing) EKS – disadvantages
  • 5.
    • With EKS,you’ll get three master nodes and 3 etcd nodes. These are multi-AZ for fault tolerance. • EKS scales the master nodes for you based on your needs. • The master nodes are invisible to you, similar to other managed services like RDS. • Backups, etcd snapshots, and autoscaling are all built in EKS – managed control plane
  • 6.
    • You provisionand manage the worker nodes • VPC is tightly integrated with Kubernetes networking. This means you can control traffic with standard VPC tools like Security Groups, ACLs, etc. Pods are given elastic network interface IPs, meaning you can control traffic at the VPC level granularly. This is a nice benefit. This is all accomplished by using a DaemonSet on your worker nodes which assigns IP addresses and interfaces with the VPC service, and then hands the relevant information off to the kubelet on the node. • You create worker nodes from an Amazon EKS optimized AMI which runs Amazon Linux 2. It comes preconfigured with Docker, IAM Authenticator, and the necessary K8s pieces. Using a user data script, it automatically joins your EKS cluster. EKS – worker nodes
  • 7.
    • EKS wrapsRBAC with IAM, allowing you to connect to and manage your cluster’s security using IAM instead of the standard Kubernetes RBAC system. EKS – Authentication/authorization
  • 8.
    • Because EKSis a managed AWS service, integration with Elastic Container Registry is provided. • Logging to CloudWatch is easy. • VPC, EC2 (instances, load balancing, autoscaling, etc), etc. are tightly integrated • IAM integration EKS – integration with aws services
  • 9.
    • There isa new CLI for working directly with EKS clusters called eksctl. • To install it, you’ll need the AWS CLI version 2 • Use Homebrew to install eksctl: • brew tap weaveworks/tap • brew install weaveworks/tap/eksctl EKS – eksctl
  • 10.
  • 11.
    • I willcreate the EKS cluster using eksctl • I will deploy the RV Store application to the cluster using Helm • I will deploy Cloudwatch logging after an introduction • I will deploy a Cluster Autoscaler after an introduction and we will watch the cluster scale up from one node to 4-5 depending on need. • I will set up detailed monitoring • I will deploy Prometheus (using Helm) after a brief introduction • I will deploy Grafana to expose the Prometheus data as a dashboard EKS – rvstore walkthrough
  • 12.
    • Let’s takea look at the Cluster Autoscaler running in EKS EKS – autoscaling in eks
  • 13.
  • 14.
    • With Kubernetespods are mortal, so it is important to collect logs from our pods and ship them to a centralized location. Popular tools are Cloudwatch (to stay AWS native), and EFK (coming up). • With EKS you can set up log collection in Cloudwatch. • You can also set up Cloudwatch insights to get additional information. This will give us access to a new Container Insights section of Cloudwatch. • We want to set up logging of the control plane as well as our own application logs. • The necessary steps are: • Give the nodes the necessary IAM permissions to be able to create Cloudwatch Log Groups, Log Streams, etc. • Set up a Fluentd DaemonSet on the cluster to collect and push logs to Cloudwatch. EKS – cloudwatch logging with fluentd
  • 15.
    • To givethe nodes access to Cloudwatch logs: • Find the IAM Role that the Node Group runs as. • Add the policy CloudWatchAgentServerPolicy to the role. • To add the Fluentd DaemonSet: • Apply the manifest file (make rule is in the exercise files) EKS – cloudwatch logging with fluentd
  • 16.
  • 17.
    • EFK (commonlyjust generically referred to as ELK) is a common logging/visualization platform. • Elasticsearch (the database of log data) • Fluentd (the agent for shipping logs to Elasticsearch). Another popular option is Logstash (where the L comes from). • Kibana (for visualizing the logs in a web dashboard) • Elasticseach runs as a StatefulSet in our cluster. • Fluentd will run as a Daemonset, collecting logs from each node and shipping them to the Stateful Elasticsearch pods • Kibana will run as a Deployment and Service. • Unlike Cloudwatch, nothing is fully hosted and managed, and we don’t need IAM changes to make it work. But we do have manage things ourselves. • Let’s add EFK to our EKS cluster and bring up the Kibana dashboard to see the log data. EKS – logs with efk
  • 18.
  • 19.
    • Prometheus isa very robust monitoring solution • It will scrape metrics from Kubernetes and from our application and store the information as long-term time series data. • We can query Prometheus with a flexible language called PromQL to form complex data results. • Prometheus has a dashboard that we can use to explore these metrics. • With Prometheus the detailed data is made available to be consumed by other services like Grafana. • Prometheus has an alerting mechanism. • Let’s deploy Prometheus to our EKS cluster, set up the dashboard, and explore a little bit. EKS – monitoring with Prometheus
  • 20.
    • Grafana isa popular dashboard tool that integrates seamlessly with Prometheus to expose the data in an easily consumable way. • This includes a collection of popular dashboards that others have developed, and you can just add to your instance. • Let’s add Grafana to our EKS cluster and explore it a bit. EKS – dashboards with grafana