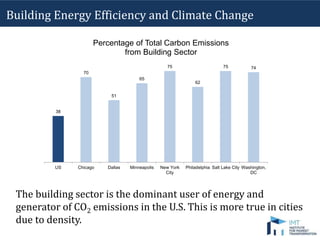
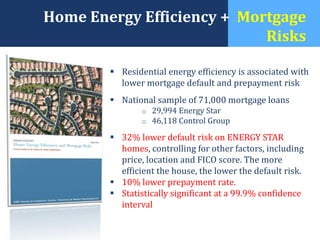
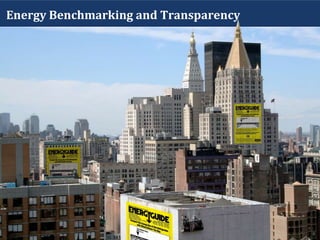
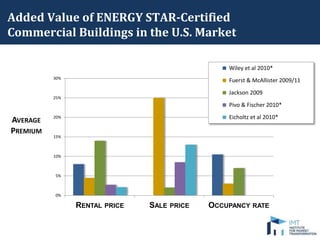
Building Energy
Performance Data
Transforming Markets
Cliff Majersik,
Executive Director
cliff@imt.org;@IMTCliff.
June 16, 2015
US spends $400 billion per year to
power buildings
The building sector is the dominant user of energy and
generator of CO2 emissions in the U.S. This is more true in cities
due to density.
38
70
51
65
75
62
75 74
US Chicago Dallas Minneapolis New York
City
Philadelphia Salt Lake City Washington,
DC
Percentage of Total Carbon Emissions
from Building Sector
Building Energy Efficiency and Climate Change
You Can’t Manage What You Don’t Measure
5
Home Energy Efficiency + Mortgage
Risks
 Residential energy efficiency is associated with
lower mortgage default and prepayment risk
 National sample of 71,000 mortgage loans
o 29,994 Energy Star
o 46,118 Control Group
 32% lower default risk on ENERGY STAR
homes, controlling for other factors, including
price, location and FICO score. The more
efficient the house, the lower the default risk.
 10% lower prepayment rate.
 Statistically significant at a 99.9% confidence
interval
Energy Benchmarking and Transparency
ENERGY STAR Rating for Building Efficiency
• EPA ENERGY STAR offers a
1 – 100 score, which is based on
data from DOE’s Commercial
Building Energy Consumption
Survey (CBECS). It is available for
21 different types of buildings
and plants.
• Enables you to compare your
facility’s actual energy
performance to similar facilities
nationwide.
• On average, ENERGY STAR
certified buildings use 35 percent
less energy and cause 35 percent
fewer greenhouse gas emissions
than similar buildings.
8
Through 2014:
• More than
400,000
properties
benchmarking
energy use
• More than 25,000
properties are
ENERGY STAR
certified
9
ENERGY STAR Benchmarking is industry standard
What is CBECS?
10
• Commercial Buildings Energy Consumption
Survey (CBECS)
–the only national level source of data on the
characteristics and energy use of commercial
buildings
–conducted every 3 or 4 years since 1979
–mandated by the Department of Energy (DOE)
Organization Act of 1977, Public Law 95-91
Information courtesy of EIA, 2012
CBECS Stakeholder Meeting, May 15,
2012
11
• CBECS interviews…
– conducted by professional interviewers using a computerized
survey instrument, usually in-person – average interview lasts 30
minutes
– advance package of materials (including worksheets) is provided
to the building a few days before the interview
– sample size historically 5,000-7,000 buildings
– building interview covers many topics – building size and use;
ownership and occupancy; energy sources, uses, and equipment;
energy consumption and cost
– building survey is followed by an energy supplier survey – if
useable energy usage information is not available from the
building respondent
Information courtesy of EIA, 2012
CBECS Stakeholder Meeting, May 15,
2012
What is CBECS?
Consistent
benchmarking in
buildings results in
energy savings and
improved
performance
www.energystar.gov/datatrends
Benchmarking and Energy Savings
Transparency Drives Cycle of Improvement
U.S. Benchmarking Policy Landscape
Currently Benchmarked Area
4,859 6,700 24,000
58,000
350,000
756,000
-
100,000
200,000
300,000
400,000
500,000
600,000
700,000
800,000
2003 CBECS 2012 CBECS EnergyStar
Certified
Buildings
Mandatory
Benchmarking
Programs
Voluntary
Energy Star
Benchmarking
DOE Buildings
Performance
Database
Growth in Building Performance Data Sets
Presenting Benchmarking Information
20
Benchmarking Benefits
Energy Cost Savings
• Average 7% energy
savings over
three-years
• Increased customer
enrollment in utility
rebate and incentive
programs
• High correlation with
building energy
improvements
Smarter Business
• In Massachusetts,
multifamily benchmarking
data is used as a screening
tool to target low-
performing buildings for
improvements.
• In San Francisco, account
representatives of PG&E
use benchmarking data to
streamline outreach efforts
and reach out to building
owners about specific
efficiency programs.
Added Value of ENERGY STAR-Certified
Commercial Buildings in the U.S. Market
0%
5%
10%
15%
20%
25%
30%
RENTAL PRICE SALE PRICE OCCUPANCY RATE
AVERAGE
PREMIUM
Wiley et al 2010*
Fuerst & McAllister 2009/11
Jackson 2009
Pivo & Fischer 2010*
Eicholtz et al 2010*
22
Benchmarking Benefits
Market Competition
and Reward
• Higher occupancy
levels, rental
premiums, and sale
prices
• Help U.S. buildings
remain globally
competitive
Job Creation
• Significant new
demand for energy
efficiency services
• More than 1,000 jobs
each in Chicago and
Atlanta
23
Benchmarking Benefits
Better-Informed Consumers
• Individual owners retain
the choice of investment
• Data can help drive more
cost-effective investments
• Ability to improve over
time
• Low cost to benchmarking
and low-cost options for
quick ROI
www.imt.org/policy/building-energy-performance-policy
By improving the
poorest performers
citywide energy
reductions of 18%
to 31% could be
achieved.
Early Findings from Energy Benchmarking in New York City
Energy intensity is
greater in newer office
buildings than older
buildings.
ENERGY STAR
scores are higher in
older office
buildings than
newer buildings.
Early Findings from Energy Benchmarking in New York City
Early Energy Intensity Findings in New York City
The poorest performing buildings use 3 to 7 times
the energy and roughly 8 to 13 times the water of
the highest performing buildings.
Thank you!
Cliff Majersik
Executive Director, Institute for Market Transformation
Washington, DC
cliff@imt.org
@IMTCliff
The Data Access and Transparency Alliance (DATA) is
a collaborative effort led by the commercial real estate
industry and energy efficiency organizations to provide
building operators with energy consumption data to
advance energy-efficiency and energy cost savings in
buildings.
More information can be found:
http://www.energydataalliance.org/
Utility Data Access Programs

Building Energy Performance Data Transforming Markets - EIA 6-16-2015

  • 1.
    Building Energy Performance Data TransformingMarkets Cliff Majersik, Executive Director cliff@imt.org;@IMTCliff. June 16, 2015
  • 2.
    US spends $400billion per year to power buildings
  • 3.
    The building sectoris the dominant user of energy and generator of CO2 emissions in the U.S. This is more true in cities due to density. 38 70 51 65 75 62 75 74 US Chicago Dallas Minneapolis New York City Philadelphia Salt Lake City Washington, DC Percentage of Total Carbon Emissions from Building Sector Building Energy Efficiency and Climate Change
  • 4.
    You Can’t ManageWhat You Don’t Measure
  • 5.
  • 6.
    Home Energy Efficiency+ Mortgage Risks  Residential energy efficiency is associated with lower mortgage default and prepayment risk  National sample of 71,000 mortgage loans o 29,994 Energy Star o 46,118 Control Group  32% lower default risk on ENERGY STAR homes, controlling for other factors, including price, location and FICO score. The more efficient the house, the lower the default risk.  10% lower prepayment rate.  Statistically significant at a 99.9% confidence interval
  • 7.
  • 8.
    ENERGY STAR Ratingfor Building Efficiency • EPA ENERGY STAR offers a 1 – 100 score, which is based on data from DOE’s Commercial Building Energy Consumption Survey (CBECS). It is available for 21 different types of buildings and plants. • Enables you to compare your facility’s actual energy performance to similar facilities nationwide. • On average, ENERGY STAR certified buildings use 35 percent less energy and cause 35 percent fewer greenhouse gas emissions than similar buildings. 8
  • 9.
    Through 2014: • Morethan 400,000 properties benchmarking energy use • More than 25,000 properties are ENERGY STAR certified 9 ENERGY STAR Benchmarking is industry standard
  • 10.
    What is CBECS? 10 •Commercial Buildings Energy Consumption Survey (CBECS) –the only national level source of data on the characteristics and energy use of commercial buildings –conducted every 3 or 4 years since 1979 –mandated by the Department of Energy (DOE) Organization Act of 1977, Public Law 95-91 Information courtesy of EIA, 2012 CBECS Stakeholder Meeting, May 15, 2012
  • 11.
    11 • CBECS interviews… –conducted by professional interviewers using a computerized survey instrument, usually in-person – average interview lasts 30 minutes – advance package of materials (including worksheets) is provided to the building a few days before the interview – sample size historically 5,000-7,000 buildings – building interview covers many topics – building size and use; ownership and occupancy; energy sources, uses, and equipment; energy consumption and cost – building survey is followed by an energy supplier survey – if useable energy usage information is not available from the building respondent Information courtesy of EIA, 2012 CBECS Stakeholder Meeting, May 15, 2012 What is CBECS?
  • 12.
    Consistent benchmarking in buildings resultsin energy savings and improved performance www.energystar.gov/datatrends Benchmarking and Energy Savings
  • 13.
  • 14.
  • 15.
  • 16.
    4,859 6,700 24,000 58,000 350,000 756,000 - 100,000 200,000 300,000 400,000 500,000 600,000 700,000 800,000 2003CBECS 2012 CBECS EnergyStar Certified Buildings Mandatory Benchmarking Programs Voluntary Energy Star Benchmarking DOE Buildings Performance Database Growth in Building Performance Data Sets
  • 17.
  • 18.
  • 19.
  • 20.
    20 Benchmarking Benefits Energy CostSavings • Average 7% energy savings over three-years • Increased customer enrollment in utility rebate and incentive programs • High correlation with building energy improvements Smarter Business • In Massachusetts, multifamily benchmarking data is used as a screening tool to target low- performing buildings for improvements. • In San Francisco, account representatives of PG&E use benchmarking data to streamline outreach efforts and reach out to building owners about specific efficiency programs.
  • 21.
    Added Value ofENERGY STAR-Certified Commercial Buildings in the U.S. Market 0% 5% 10% 15% 20% 25% 30% RENTAL PRICE SALE PRICE OCCUPANCY RATE AVERAGE PREMIUM Wiley et al 2010* Fuerst & McAllister 2009/11 Jackson 2009 Pivo & Fischer 2010* Eicholtz et al 2010*
  • 22.
    22 Benchmarking Benefits Market Competition andReward • Higher occupancy levels, rental premiums, and sale prices • Help U.S. buildings remain globally competitive Job Creation • Significant new demand for energy efficiency services • More than 1,000 jobs each in Chicago and Atlanta
  • 23.
    23 Benchmarking Benefits Better-Informed Consumers •Individual owners retain the choice of investment • Data can help drive more cost-effective investments • Ability to improve over time • Low cost to benchmarking and low-cost options for quick ROI www.imt.org/policy/building-energy-performance-policy
  • 24.
    By improving the poorestperformers citywide energy reductions of 18% to 31% could be achieved. Early Findings from Energy Benchmarking in New York City
  • 25.
    Energy intensity is greaterin newer office buildings than older buildings. ENERGY STAR scores are higher in older office buildings than newer buildings. Early Findings from Energy Benchmarking in New York City
  • 26.
    Early Energy IntensityFindings in New York City The poorest performing buildings use 3 to 7 times the energy and roughly 8 to 13 times the water of the highest performing buildings.
  • 27.
    Thank you! Cliff Majersik ExecutiveDirector, Institute for Market Transformation Washington, DC cliff@imt.org @IMTCliff
  • 29.
    The Data Accessand Transparency Alliance (DATA) is a collaborative effort led by the commercial real estate industry and energy efficiency organizations to provide building operators with energy consumption data to advance energy-efficiency and energy cost savings in buildings. More information can be found: http://www.energydataalliance.org/
  • 30.