Download to read offline


![- 9 -
plants, which are the technologies that best respond to the increase of flexibility required
by the system.
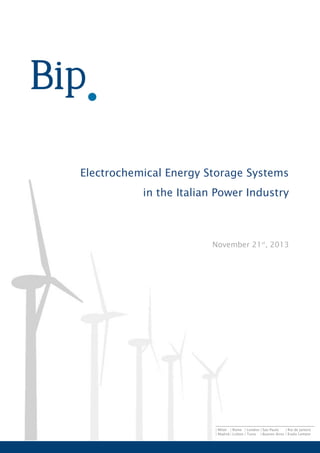
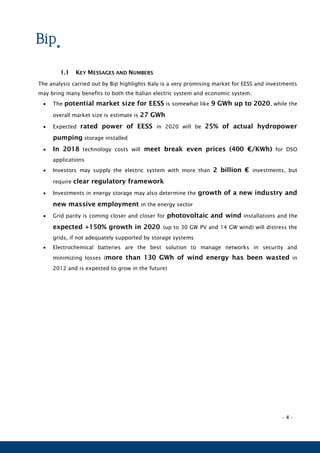
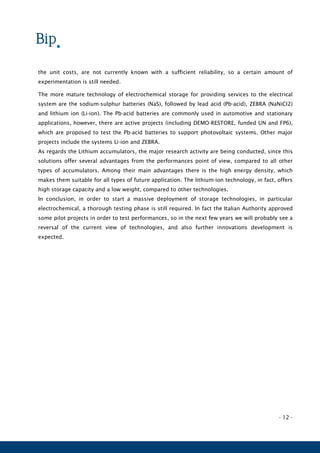
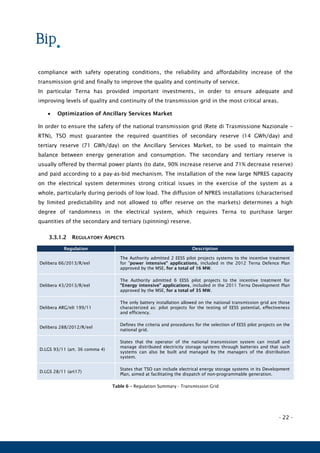
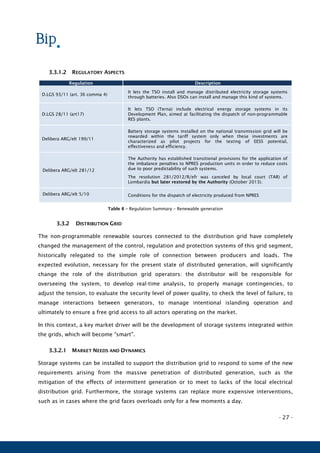
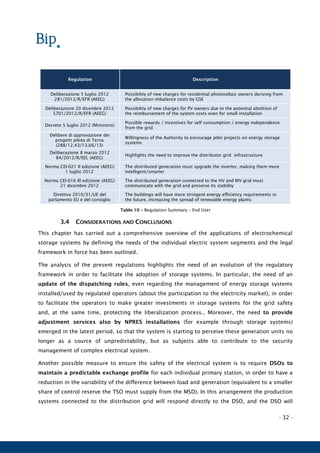
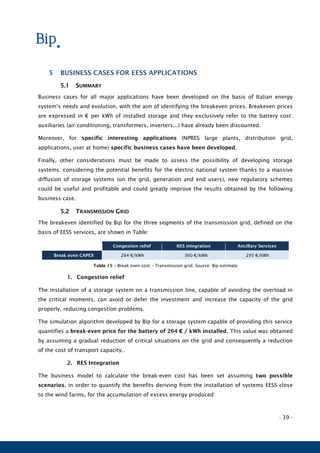
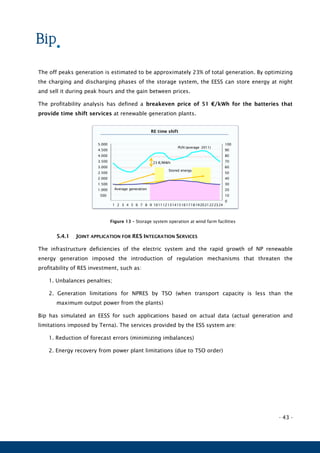
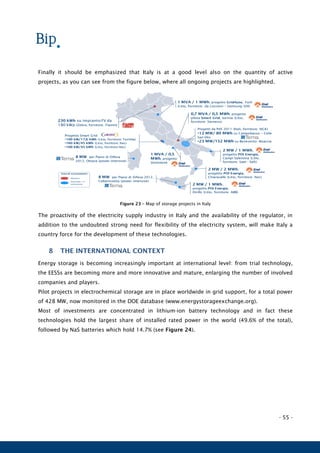
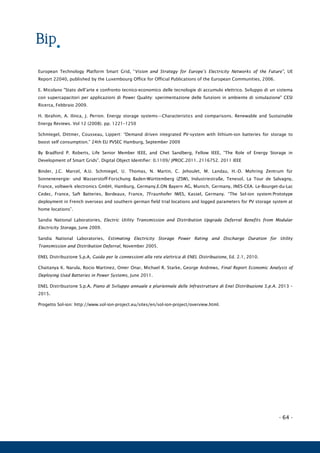
5. New dynamics on the Day-Ahead Market: The increase of renewable sources has
reduced tradable demand on the market and created new hour profiles of the energy
price (PUN). The figure shows two Sundays in which there was a high variability of the
PUN profile. The price profile of the two Sundays of 2013 compared to 2012 decreased
substantially, reaching a null value in the hours when energy produced by photovoltaic
systems is at its maximum; at the same time has increased the price in the evening
hours.
Figure 1 – Price (PUN) in two 2012-2013 significant days (Sundays)
6. Reduction in the availability of primary reserve after markets negotiations: changes
in the operational management for system safety. In order to comply with the safety
standards in the exercise of the electrical system, an adequate capacity of primary
reserve must be provided, able to ensure the stability of the power supply in all operating
conditions. The rise of NPRES power plants and DG occurred in Italy in recent years
involves a substantial reduction in the primary reserve due to the lack of inertia of most
of the systems used to produce energy from NP sources (full-converter wind turbines and
PV generators).
The issues raised can be resolved or effectively limited by the implementation of systems that
allow greater interaction between grid, users and generation. Such systems are called smart
grids: they consist in a clever use of communication systems that allow to overcome the present
limitations of energy grids and that enable a significant increase in the contribution of DG, while
maintaining a high level of security and reliability of the entire system.
-60
-40
-20
0
20
40
60
80
100
120
140
1 2 3 4 5 6 7 8 9 101112131415161718192021222324
delta PUN 02/06/2013 e
03/06/2012 [€/MWh]
delta PUN 16/06/2013 e
17/06/2012 [€/MWh]
PUN 02/06/2013
[€/MWh]
PUN 16/06/2013
[€/MWh]
PUN 03/06/2012
[€/MWh]
PUN 17/06/2012
[€/MWh]](https://image.slidesharecdn.com/3a739d7b-eac4-4d4e-9a34-c4bbe0e7cd94-160102133228/85/EESS-Bip-Paper_Short_1-0-10-320.jpg)


![- 37 -
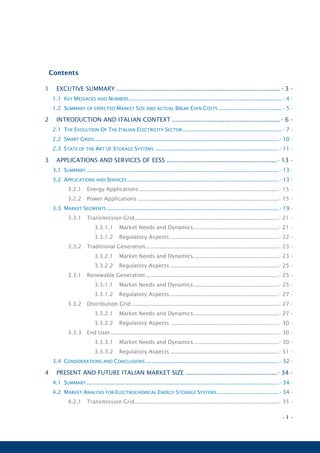
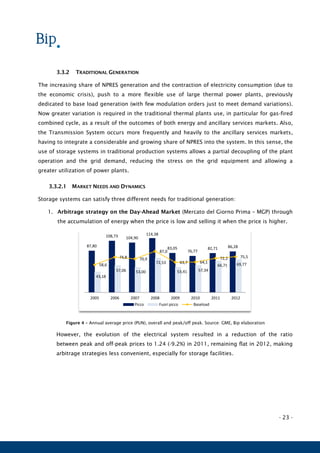
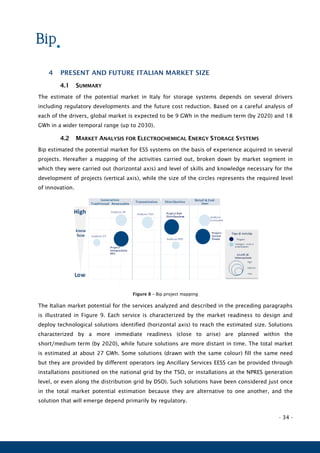
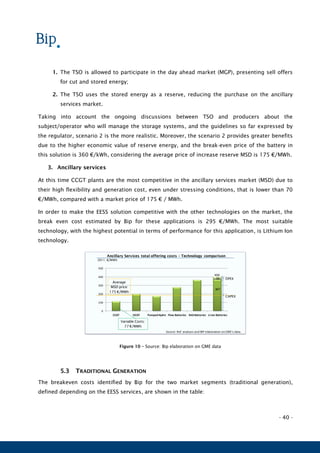
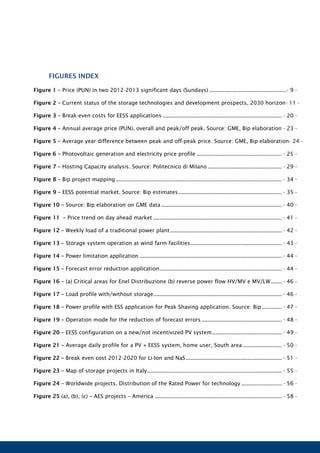
The overall sizing of the market for NPRES plants is summarized in Table:
RES Optimization &
Integration
RES Dispatching
Potential market 3.100 MWh 2.800 MWh
Table 13 – Market Potential - Renewable Generation. SOURCE: Bip Estimate
4.2.4 DISTRIBUTION GRID
Bip has identified two market segments deriving from DSO needs:
1. DSO dispatching: DSO plays an active role, releasing stored energy to solve grid
criticalities (mainly power applications), optimizing the uncertainties in load prediction /
dispatching (DSO similar to TSO). It is assumed to install EESSs on 30% of Enel
Distribuzione’s substation and 12% on other distributors’ substations.
2. DSO Peak shaving: DSO releases the stored energy to avoid congestion on the
distribution grid [energy demand]. In the market sizing, standard penetration rates have
been hypothesized based on the transformer size.
DSO Dispatching
Management
DSO Peak Shaving
Potential market 1.000 MWh 2.040 MWh
Table 14 – Market Potential – Distribution grid. SOURCE: Bip Estimate
4.3 CONSIDERATIONS AND CONCLUSIONS
In this chapter estimates of the market size for EESS have been presented, broken down by
application and service. The total potential market is expected to be 9 GWh in 2020 and 18 GWh
in 2030, and this potential will be divided unevenly between different actors. Especially since
many players, even on different stages of the value chain electric, will contend market shares for
the same services.
The global market for storage systems has increased substantially in recent years and will
continue to growth more and more in the future, both for its potential to support the grid in its
transformation into a Smart Grid and for the evolution of the electricity market. The major
beneficiaries of the growth of the EESS market will be the electric mobility market and NPRES
generation, while the traditional generation will lose further market shares in the electricity
market.
The electric mobility will drive the development of the storage market as it will enable scale
effects in the production of these technologies that will lead to a reduction in costs and an
increase in the competitiveness of EESS.](https://image.slidesharecdn.com/3a739d7b-eac4-4d4e-9a34-c4bbe0e7cd94-160102133228/85/EESS-Bip-Paper_Short_1-0-38-320.jpg)

![- 44 -
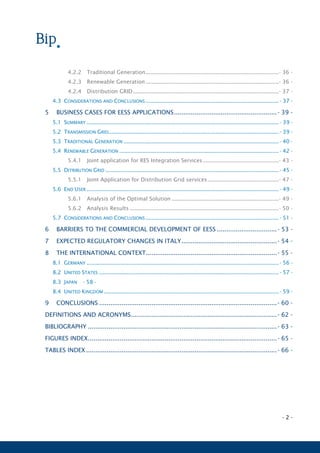
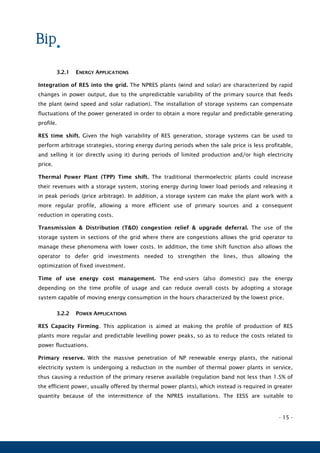
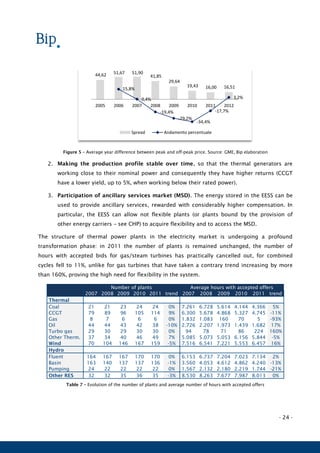
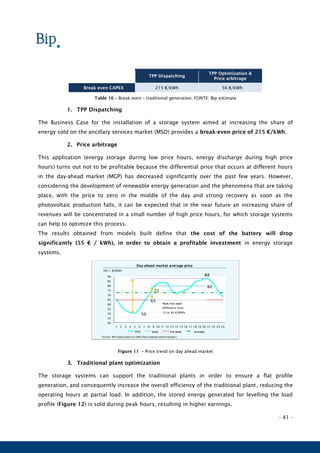
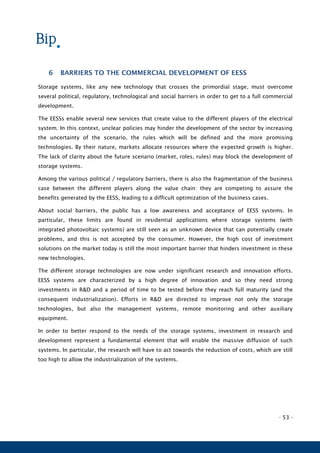
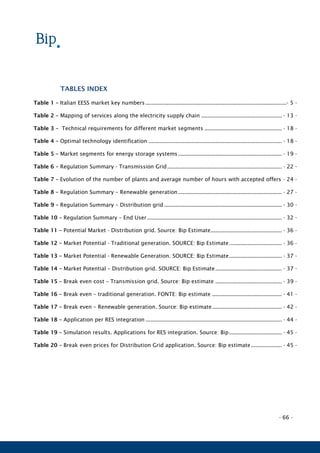
The solution analyzed is characterized by the following technical parameters:
Tecnical parameters Value
Rated power: 0,4 MW
C-rate 2
Energy 0,2 MWh
ηPCS charge/discharge 95%
ηbatteria carica/scarica 97,5%
N° of cycles 4.000
Table 18 – Application per RES integration
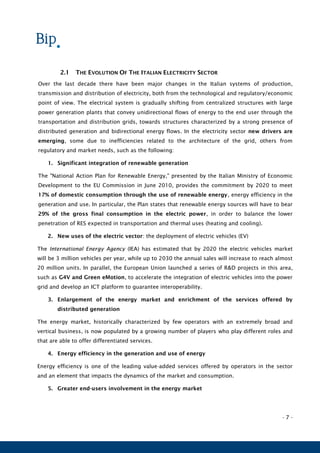
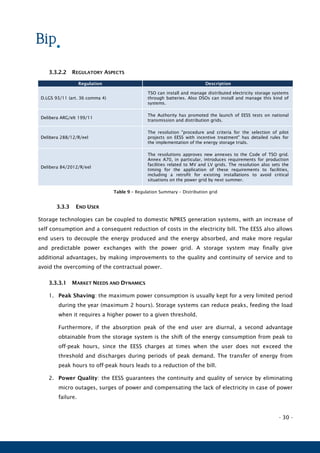
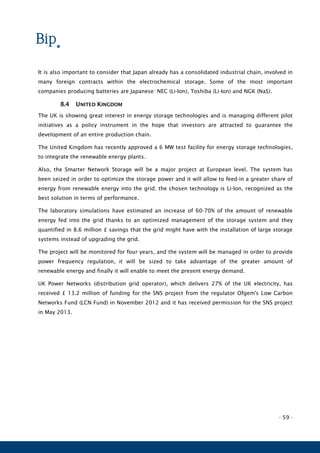
The EESS management for power limitation application is shown in Figure 14.
Figure 14 – Power limitation application
For the application if error forecasting reduction, the control of the phase of charging and
discharging takes place as in Figure 15.
Figure 15 – Forecast error reduction application
0,30
0,35
0,40
0,45
0,50
0,55
0,60
1 2 3 4 5 6 7 8 9 10 11 12
Produzione producibile Produzione immessa
[MWh]
Scarica
Carica](https://image.slidesharecdn.com/3a739d7b-eac4-4d4e-9a34-c4bbe0e7cd94-160102133228/85/EESS-Bip-Paper_Short_1-0-45-320.jpg)

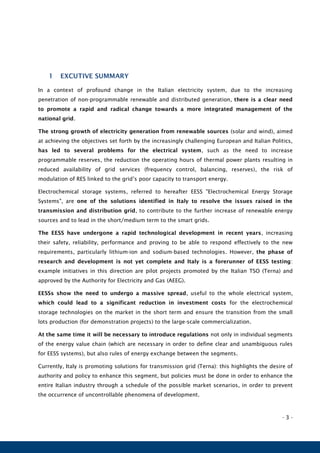
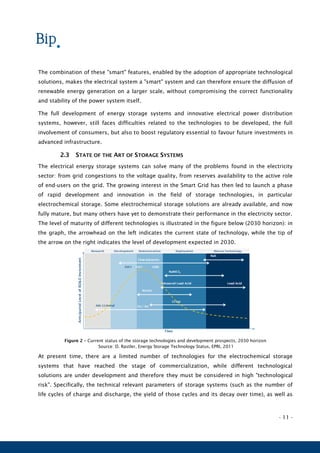
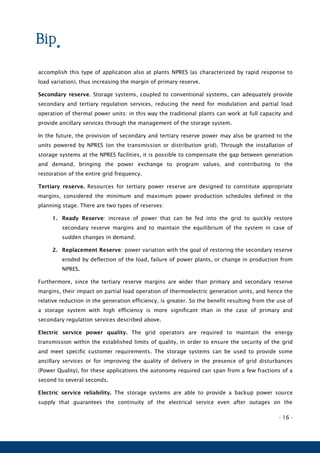
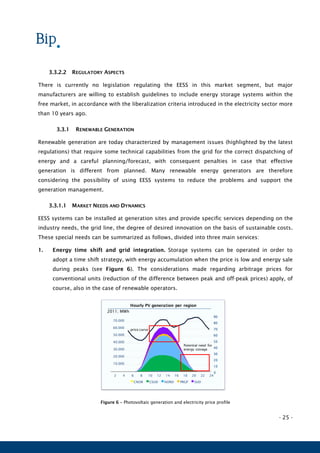
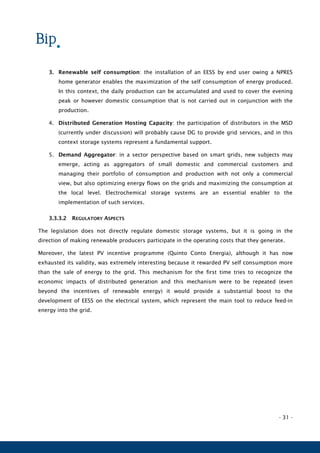
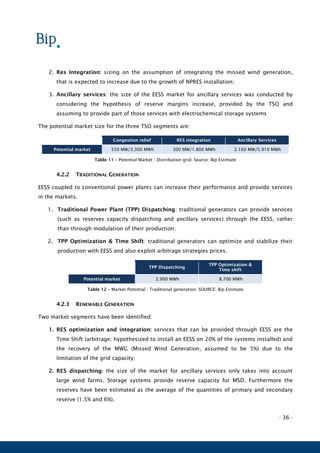
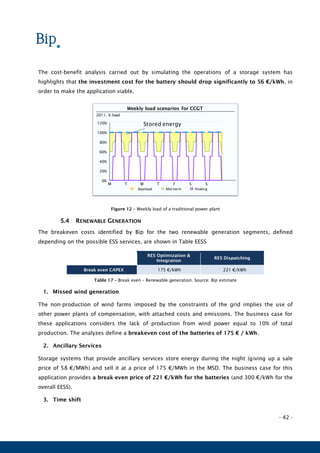
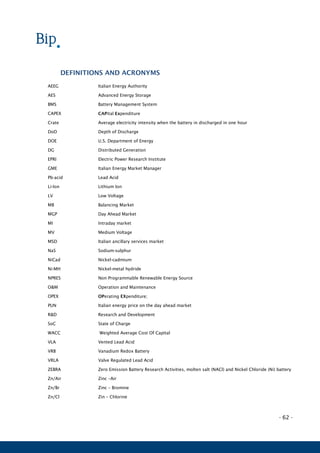
![- 46 -
Figure 16 – (a) Critical areas for Enel Distribuzione (b) reverse power flow HV/MV e MV/LW
The benefits guaranteed by the storage system consist in the deferral of grid
investment/expansion and improvement of the electrical system programming, thanks to the
better forecasting of energy flows through the primary substations. The battery break-even is
384 €/kWh.
This application is the one with higher Breakeven price, closer to the market price and it will
probably be one of the initiatives that will faster spread in the coming years.
2. Peak shaving
The load profile of the solution applied to the distribution grid (substation) is represented in
figure, by adopting the ESS system optimized management.
Figure 17 – Load profile with/without storage
61 orange areas
18 white areas
Reverse power flow
> 1% of a year’s
time
14 critical areas
Reverse power flow
> 5% of a year’s
time
Not violated grid constrain
15 yellow areas
Enel Distribuzione critical areas (update 30/06/2011)
Note: 1
Bip Estimation based on DSOs data
2010 20162008
HV/MV substation in
critical areas [#]
MV/LV substation in
orange areas [#]
# of HV/MV Substation observing a Reverse Power Flow
About 17% of
HV/MV substations
observe a reverse
power flow
About 25% of
HV/MV substations
observe a reverse
power flow1
258
374
76
110
0
400.000
800.000
1.200.000
1.600.000
1 2 3 4 5 6 7 8 9 10 11 12 13 14 15 16 17 18 19 20 21 22 23 24
Charge
ESS
Discharge
ESS
Load Profile [storage/no storage]
Hours
kW](https://image.slidesharecdn.com/3a739d7b-eac4-4d4e-9a34-c4bbe0e7cd94-160102133228/85/EESS-Bip-Paper_Short_1-0-47-320.jpg)
![- 47 -
The simulation algorithm has been implemented considering the benefits deriving from the
reduction of grid losses, and to the deferral of investment in upgrading infrastructure. The
break-even price for the batteries has been estimated in 259 €/kWh.
5.5.1 JOINT APPLICATION FOR DISTRIBUTION GRID SERVICES
Bip developed a simulation model of the storage system, operation on the basis of real data of
active and reactive power of some Primary substations, evaluating the benefits related with the
application of such systems in the electricity distribution grids.
The services considered are:
1. Peak Shaving: use of the EESS to reduce the peak on the Primary Substation lines, in
order to reduce the capital exposure;
2. Dispatching: minimization of forecasting errors of energy in transit on the primary
substations, in order to ensure a proper planning of the exchange with the HV grid and
properly manage the dispatching activities of the TSO;
3. Power factor correction: provide reactive power in order to restore appropriate levels of
power factor and limit the overall losses of the area served by the Primary Substation.
For the Peak Shaving application, the operation algorithm has been developed in order to
reduce the power closer to the upper safety limit of the Primary cabin transformer (Figure 18). In
the analyzed cabins energy flows approached the safety limit both in normal flow (from HV to
MV) and in reverse flow (from MV to HV).
Figure 18 – Power profile with ESS application for Peak Shaving application. Source: Bip
The use of the energy storage systems delays the investment for the replacing the HV/MV
transformer in primary substation (upgrade deferral).
In order to facilitate the dispatching activities and contain the forecasting errors in Primary
Substation, battery realigns the effective energy transits in PS to the previous forecast, giving a
-80.000
-60.000
-40.000
-20.000
0
20.000
40.000
60.000
0:00 6:00 12:00 18:00
[kW]
Consuntivo Previsione
Erogazione
Accumulo
Accumulo
Erogazione
Erogazione
Accumulo
Erogazione
Potenza Apparente Trasformatore
Potenza Apparente Trasformatore](https://image.slidesharecdn.com/3a739d7b-eac4-4d4e-9a34-c4bbe0e7cd94-160102133228/85/EESS-Bip-Paper_Short_1-0-48-320.jpg)
![- 48 -
reduction of forecast errors and thus providing a higher reliability of the HV transit
programming. Hereafter the profile to the operation modes of the batteries:
Figure 19 – Operation mode for the reduction of forecast errors
Finally, the simulation algorithm takes into account that the bidirectional inverter is capable of
handling reactive power each time the battery is being charged or discharged, and in this way it
can improve the power factor of the grid.
The simulation model also takes into account the realized costs and benefits of different storage
systems technologies, as well as technical performance, applied to the distribution grid within
the primary substations analyzed.
The possible benefits are:
1. Deferral investment for transformer replacement;
2. Reducing forecast error of the energy transits (quantified by the spread between the price
of energy on the day ahead market MGP and balancing market MB);
3. Reduction of reactive energy in transit on the grid (quantified as the penalties provided
by TSO for the use of reactive power from the HV grid);
The results obtained show that for the 4 analyzed technologies (PbA, Li-Ion, NaS, Zebra) the
investment is not profitable at present prices. This is mainly due to the high investment costs of
the batteries. However, the technologies that show the greatest potential for possible
experimental applications are the NaS and lithium ion batteries. NaS batteries present the
cost/benefit ratio closer to unity, although they do not guarantee very high benefits. The lithium
ion, because of their flexibility, can ensure the highest benefits (in absolute value double
compared to the other technologies), although their current cost is almost 3 times the possible
benefits. In addition, a prospective analysis of the prices of these technologies shows that both
NaS and lithium ion will reach the break-even price in 2018.
-800
-600
-400
-200
0
200
400
600
800
1000
01:00 04:00 07:00 10:00 13:00 16:00 19:00 22:00
Errore[kW]
Errore Previsione
Accumulo
Accumulo
Erogazione
Erogazione
Soglia accettabilità dell’errore
Soglia accettabilità dell’errore](https://image.slidesharecdn.com/3a739d7b-eac4-4d4e-9a34-c4bbe0e7cd94-160102133228/85/EESS-Bip-Paper_Short_1-0-49-320.jpg)
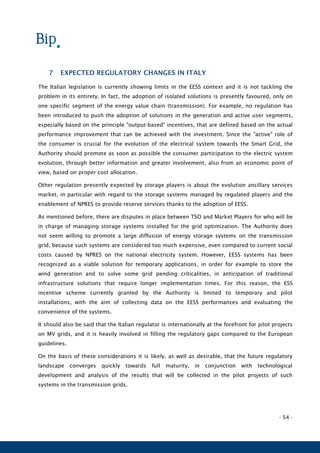
![- 50 -
The plant is dimensioned in order to generate the energy consumed by the user during the year.
The battery management is performed in order to charge during the day, up to 100%, and
discharge as soon as energy demand rises, down to 0% (consistent with the availability of
generation and energy demand from the user). The simulation algorithm includes the rule that
the storage system does not interact directly with the grid (does not charge and discharge
energy within the grid), the performance of the battery is 90% in discharging and the storage
system is characterised by dimensions that optimize the self consumption of energy. The daily
average profile of the storage system is the following:
Figure 21 – Average daily profile for a PV + EESS system, home user, South area
5.6.2 ANALYSIS RESULTS
The results of the analysis are the following:
1. An estimate of annual benefits obtainable by the Italian user, in terms of revenue
from the sale of energy and reduction of the bill, and an estimate of the
consumer/domestic producer new interaction profile with the grid.
2. An estimate of annual benefits obtainable for the Italian electrical system (reduction
of thermal power installed capacity, improvement of the predictability of the DG,
reduction of grid losses, reduction of the modulation of the NPRES plants, investment
deferral of the distribution grid, fewer interruptions, reduction of CO2 emissions,
enabling an increasing penetration of RES).
The storage system allows a complete independence from the grid for about 64% of the time and
it increases the share of self consumption from 32% (without storage system) to 73% (with
accumulation).
Considering the investment and maintenance costs of photovoltaic system and EESS, the result is
that prices of battery technologies on the market are today too high to allow massive
-50%
-25%
0%
25%
50%
75%
100%
-1
-0,5
0
0,5
1
1,5
2
1 3 5 7 9 11 13 15 17 19 21 23
Charge (Discharge) [Kwh] Generazione [Kwh]
Consumo [Kwh] Stato di Accumulo [ %]](https://image.slidesharecdn.com/3a739d7b-eac4-4d4e-9a34-c4bbe0e7cd94-160102133228/85/EESS-Bip-Paper_Short_1-0-51-320.jpg)
![- 51 -
deployment of this sector: the lithium-ion battery solutions have a break-even value around
1,562 €/year in 2012, while in the future the breakeven will be 828 €/year in 2020, as a result
of the cost decrease of the batteries. NaS technology, instead, has a breakeven value of 999.3
€/year 2012 and 844.7 €/year in 2020. Both technologies in 2020 will be a profitable
investment, in fact, the cost of residential customers who will not have photovoltaic nor storage
system will be significantly higher.
Figure 22 – Break even cost 2012-2020 for Li-Ion and NaS
The benefits for the system have been quantified by assuming different scenarios of PV
penetration in Italian households, but only the more protective scenario is here summarized. In
this scenario 1% of the families will install a PV system with an integrated EESS, for a total of
250,000 households systems (PV and storage). In such Scenario, the electrical system will
benefit 89.4 €/year for each unit installed.
5.7 CONSIDERATIONS AND CONCLUSIONS
Bip has done many studies on the possible applications of the storage systems in the electrical
value chain in Italy and identified the breakeven prices required for such systems (and batteries)
to enable the full return of the investment.
The results obtained show that to date storage systems are not cost-effective solutions, mainly
due to the high cost of batteries. However, a decrease of the batteries prices is expected for the
next years and it will allow realizing profitable applications by the end of this decade. In the next
few years there will probably be a reduction of batteries production cost, a reduction in raw
material costs and auxiliary components and, moreover, there will be heavy investment in R&D
that will enable an increased storage capacity, better energy efficiency and better performing
management algorithms.
It is also important to underline that the low breakeven prices for many applications are not an
obstacle to the development of such systems, because in many contexts the needs are urgent
1.561,2
999,3
828,4 844,7
FV+RESS (Li-Ion) FV+RESS (NaS)
Costo senza nessun sistema 873,74 [€/anno]](https://image.slidesharecdn.com/3a739d7b-eac4-4d4e-9a34-c4bbe0e7cd94-160102133228/85/EESS-Bip-Paper_Short_1-0-52-320.jpg)


This document summarizes an analysis of electrochemical energy storage systems (EESS) in the Italian power industry. It finds that EESS can help address issues caused by increasing renewable energy penetration, such as providing reserves when renewable output fluctuates. The document evaluates the potential market size and applications of EESS across the Italian power system, including the transmission grid, traditional generation, renewable generation, and distribution grid. It concludes that widespread adoption of EESS is needed to support Italy's transition to more renewable energy and smart grids, and that supporting policies and regulations must consider the entire industry to ensure orderly development.


