Download to read offline

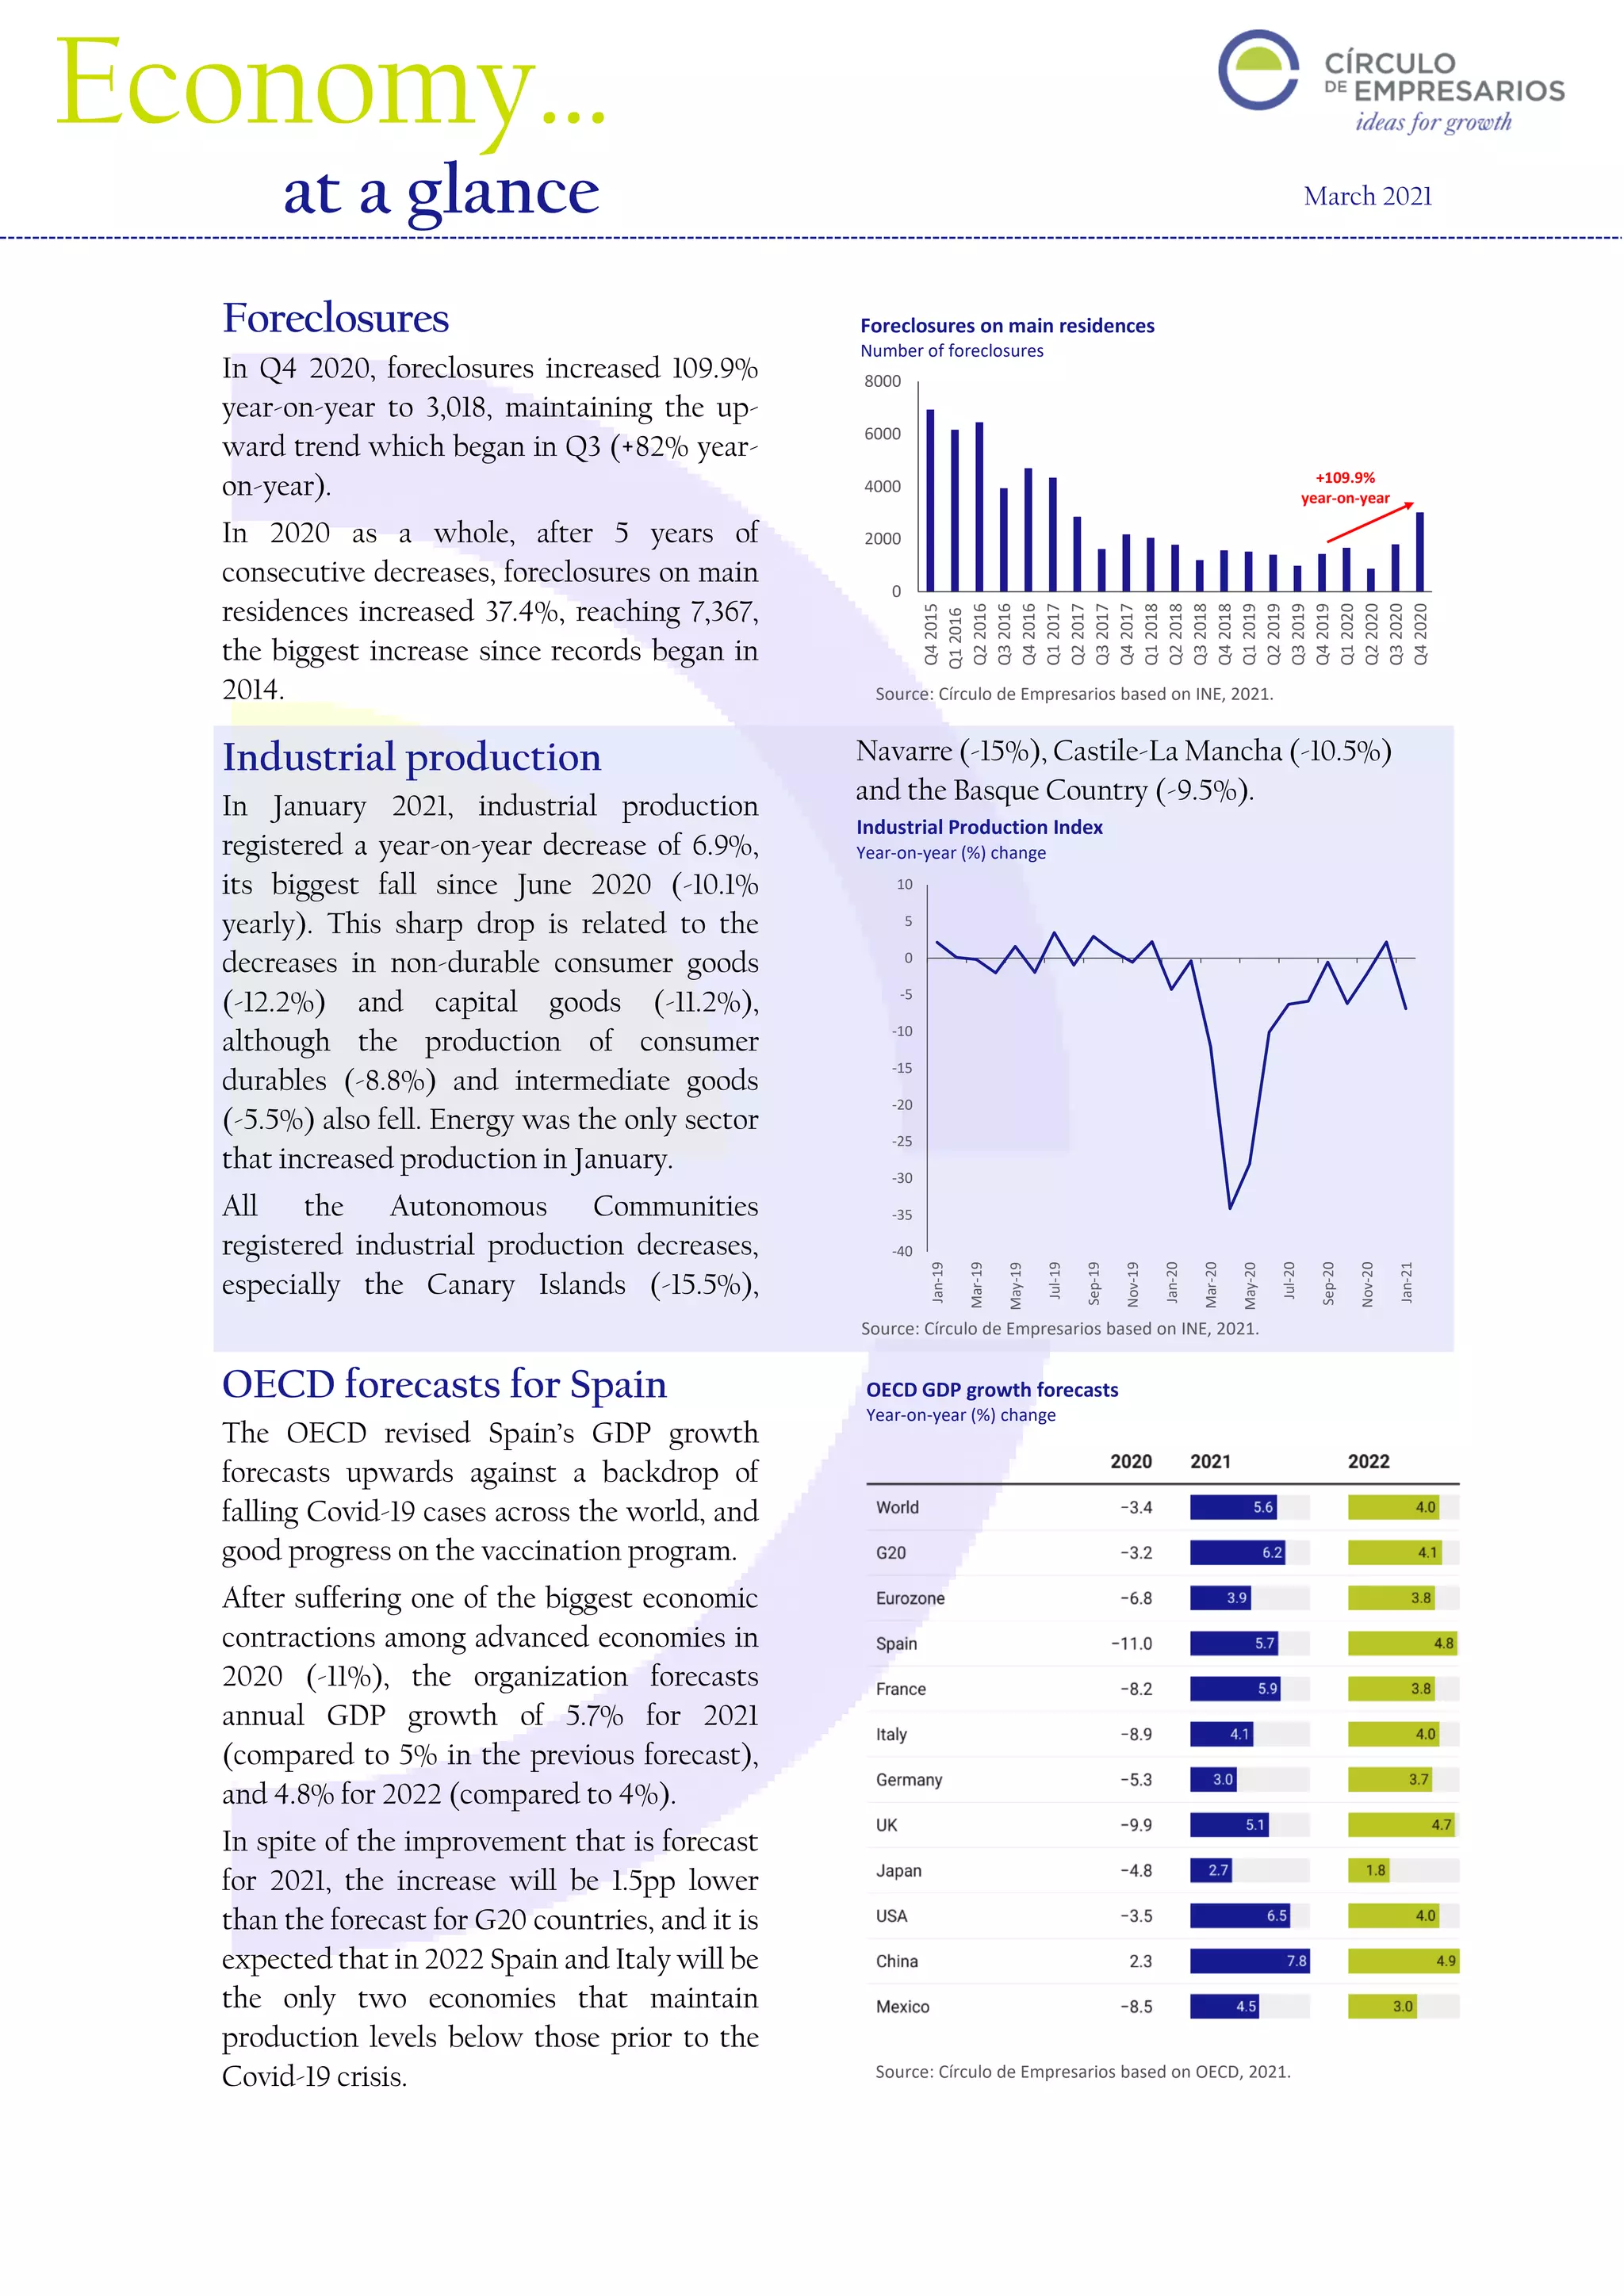
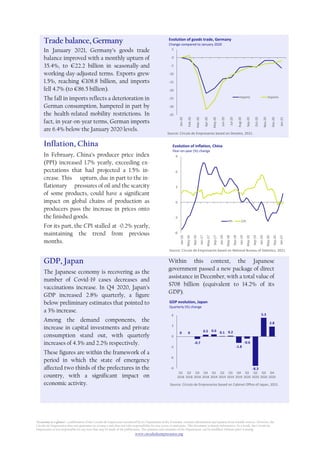

- Foreclosures on main residences in Spain increased 37.4% in 2020 from the previous year, reaching the highest level since records began in 2014. Industrial production in January 2021 decreased 6.9% year-on-year, the largest decline since June 2020. - The OECD revised Spain's GDP growth forecasts upwards for 2021 to 5.7% from 5% previously, but growth will still be 1.5 percentage points lower than forecasted for other G20 countries. For 2022, Spain and Italy are expected to be the only economies with production levels still below pre-Covid crisis levels. - Germany's trade balance improved in January 2021 with exports growing 1.5% and imports falling


