Downloaded 84 times
![CURRENCY EXCHANGE RATES: Determination & Forecasting Economics
R-14 (SS-4)
Page 1 of 11
For the quote USD/EUR 1.4124 – 1.4128, the following applies:
o The bid price of one unit of EUR (base currency) in terms of USD (price currency) is 1.4124, while the
ask (offer) price is 1.4128, with a difference of 4 pips (one pip = 1/10,000).
o Down the ask & Divide rule (convert or sell the price currency and buy the base currency).
o Up the bid & Multiply rule (convert or sell the base currency and buy the price currency).
FX Spread:
In the preceding quote the 4 pips identified as (Ask - Bid) is the FX spread, reflecting the dealer’s profit.
Spreads are narrower in the interbank market.
The spread quoted by the dealer depends on:
o The spread in the interbank market for the same currency pair.
o The size of the transaction: larger, liquidity demanding transactions have wider spreads.
o The relationship between the dealer and the client.
The interbank spread on a currency pair depends on:
o Currencies involved: the higher the volume, the lower spreads.
o Time of day: liquidity increases during the time overlap between New York and London markets
which decreases the spread.
o Market volatility: the higher the volatility, the higher the spread needed to compensate for risk.
Spreads in forward market increase with maturity to compensate for increased liquidity, credit, and interest
rate risk.
Triangular arbitrage:
o The opportunity for triangular arbitrage profit arises when the quoted cross rate differs from the
implied one.
o Rules for Cross Rates:
[ ] [ ] [ ] [ ] [ ] [ ]
[ ]
[ ]
[ ]
[ ]
Spot and forward rates:
Forward rate (all-in rate) F = Spot rate S0 (+) or (–) forward premium or discount respectively
Mark to market value of a forward contract: unwind the position in a new offsetting forward contract.
o At maturity: –
FPT = the forward price at maturity to sell base currency (up the bid)
FP = the all-in forward price at inception to buy the base currency (down the ask)
o Prior to maturity:
–
R is for the price currency
Currency of
concern
Overvalued
currency
Undervalued
currency
N
ot
For
R
elease](https://image.slidesharecdn.com/economics-levelii-150721140300-lva1-app6892/85/Economics-Level-II-CFA-Program-1-320.jpg)
![CURRENCY EXCHANGE RATES: Determination & Forecasting Economics
R-14 (SS-4)
Page 2 of 11
Covered interest rate parity:
o For an investor to earn the same return in either currency, the forward premium or discount should
exactly offset the nominal interest rate differential. This relation is bound by arbitrage.
o For currency pair (A/B), [ ] (Follow the numerator-denominator rule)
o If parity doesn’t hold, there is an arbitrage opportunity. Supposing that currency B is overvalued:
At spot: Borrow currency A at RA, and convert it to currency B.
Invest the proceeds from currency B at RB.
At maturity: Convert the currency B proceeds (principal + interest) back into currency A.
Repay the loan and the remaining proceeds from currency A is the arbitrage profit.
Uncovered interest rate parity:
o If forward currency contracts are not available or capital flows restricted the interest rate parity
might not hold.
o Expected spot rate (A/B) at time t = [ ] (Follow the numerator-denominator rule)
o Assumes the investor is risk-neutral, as no additional return is required to compensate for foreign
currency risk.
o The forward rate is unbiased predictor of the future spot rate. .
o Holds in the long-run to a significant extent, but not in the short-run.
International fisher relation:
o Taking the Fisher relation and real interest rate parity (assuming free capital flows) together, gives
us the international Fisher effect: ,
meaning that nominal interest rate differentials should mirror inflation differentials.
Purchasing Power Parity:
o The law of one price doesn’t hold in practice due to frictions such as tariffs and transportation costs.
o Absolute PPP: compares the average price of a representative basket of consumption goods
between countries.
o Relative PPP: [ ] (Follow the numerator-denominator rule)
Holds in the long-run to a significant extent, but not in the short-run.
o Ex-ante version of PPP: same as Relative PPP except using expected instead of actual inflation.
Real exchange rate:
o Adjusting the exchange rate for inflation differentials between the two countries since a base year.
Real exchange rate (A/B) at time t [ ] (exception to the numerator-denominator rule)
o If relative PPP holds, the real exchange rate would be constant (the equilibrium real exchange rate).
However, since relative PPP rarely holds in short term, the real exchange rate fluctuates around this
long-term mean-reverting equilibrium value.
o Real exchange rate (A/B) = equilibrium rate + (real interest rateB – real interest rateA)
– (FX risk premiumB – FX risk premiumA)
N
ot
For
R
elease](https://image.slidesharecdn.com/economics-levelii-150721140300-lva1-app6892/85/Economics-Level-II-CFA-Program-2-320.jpg)


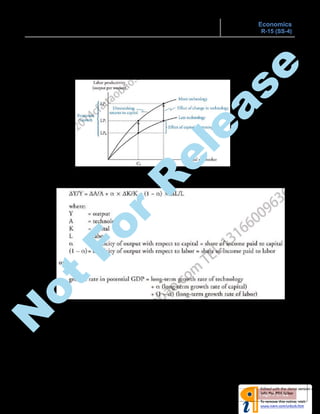


This document discusses currency exchange rates and economic growth. It provides details on how exchange rates are determined between currencies, including factors that affect exchange rate spreads. It also outlines several economic theories related to what drives long-term economic growth, such as investment in physical and human capital, as well as productivity gains from technological development. Key growth accounting relationships are presented, linking output growth to contributions from capital deepening, increases in the labor force, and improvements in total factor productivity.