Downloaded 34 times


![Thank You You can always reach me at [email_address] Also, if you need us in a hurry, we are at 410.522.7243 Please contact us when you require economic and capital markets research & policy analysis. Further information available at www.spgtrend.com](https://image.slidesharecdn.com/vistagememphis11192008-1232636076411439-3/85/Economic-Presentation-33-320.jpg)

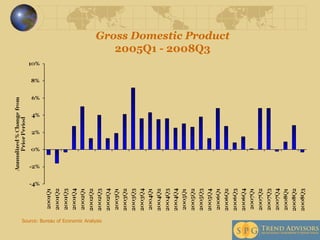
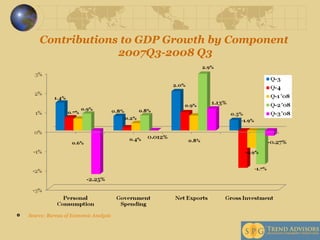
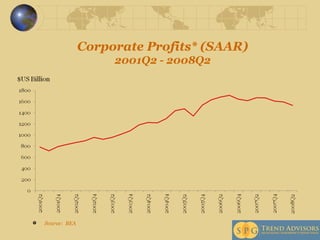
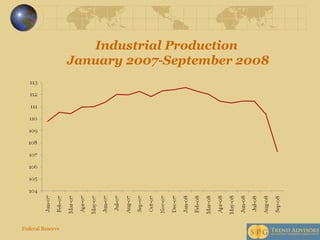
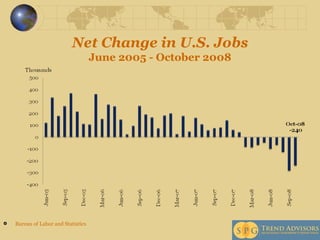
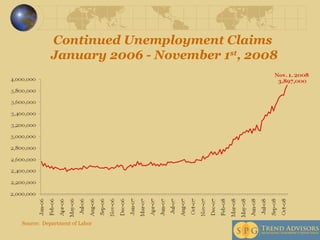
The economic presentation by Morris Segall outlines the state of the U.S. economy as it faces a recession, highlighting key metrics such as GDP growth, unemployment rates, and consumer price index changes. It discusses strategies for businesses to navigate through difficult economic conditions and identifies potential economic recovery indicators for 2009 and beyond. The document concludes with predictions for longer-term economic growth challenges due to socio-economic issues and credit availability.