Downloaded 50 times


![Thank You You can always reach me at [email_address] Also, if you need us in a hurry, we are at 410.522.7243 Please contact us when you require economic and capital markets research & policy analysis. Further information available at www.spgtrend.com](https://image.slidesharecdn.com/psdaforjan-5-2009-1232637805420165-2/85/An-Economic-Intelligence-Report-for-2009-25-320.jpg)

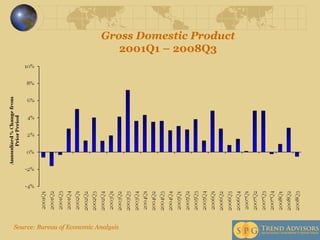
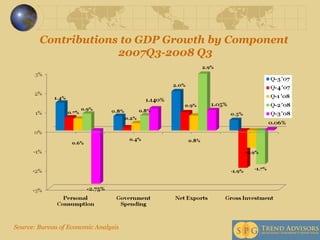
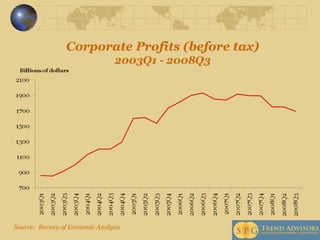
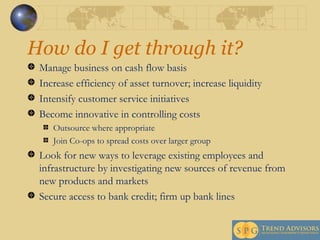
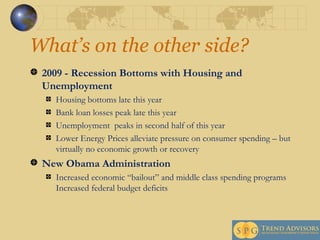
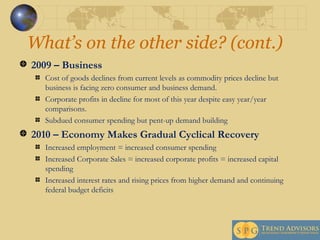
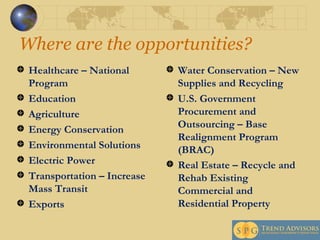
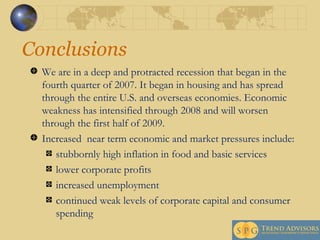
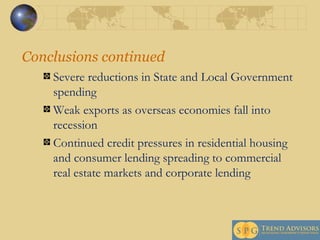
The document is an economic intelligence report for 2009 detailing the recession that began in late 2007, highlighting factors such as declining GDP, corporate profits, and rising unemployment. Recommendations for businesses include improving cash flow management, enhancing customer service, and leveraging existing resources for new opportunities. The report predicts a gradual economic recovery starting in 2010, with increased consumer spending and corporate profits, while cautioning about long-term socio-economic challenges.


