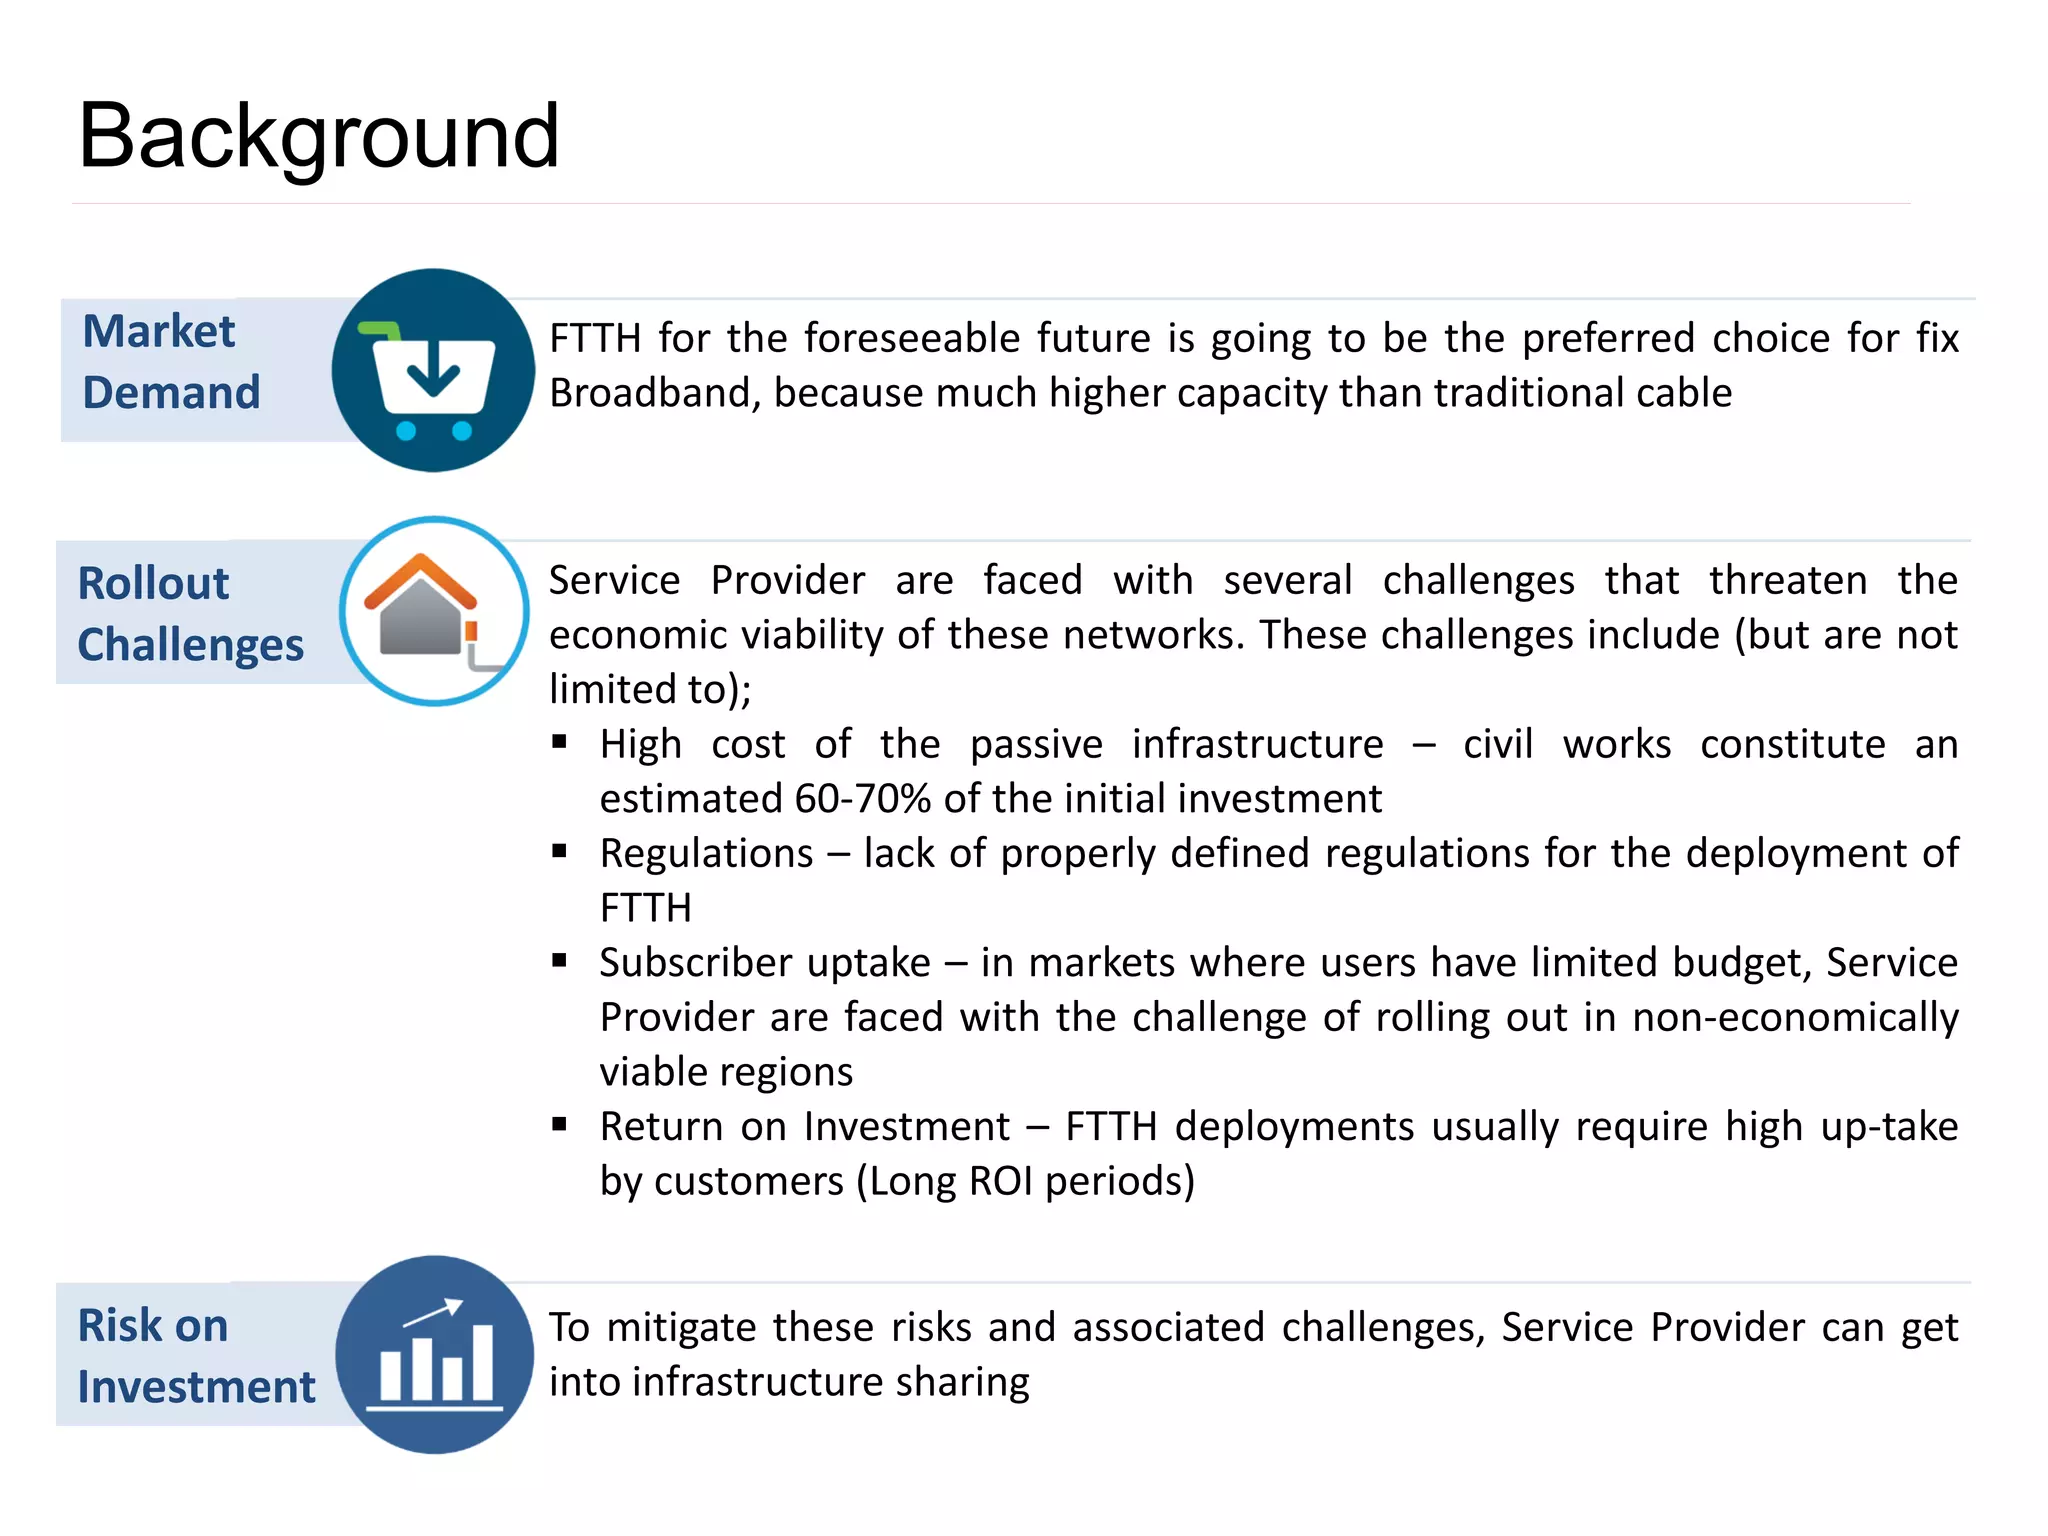
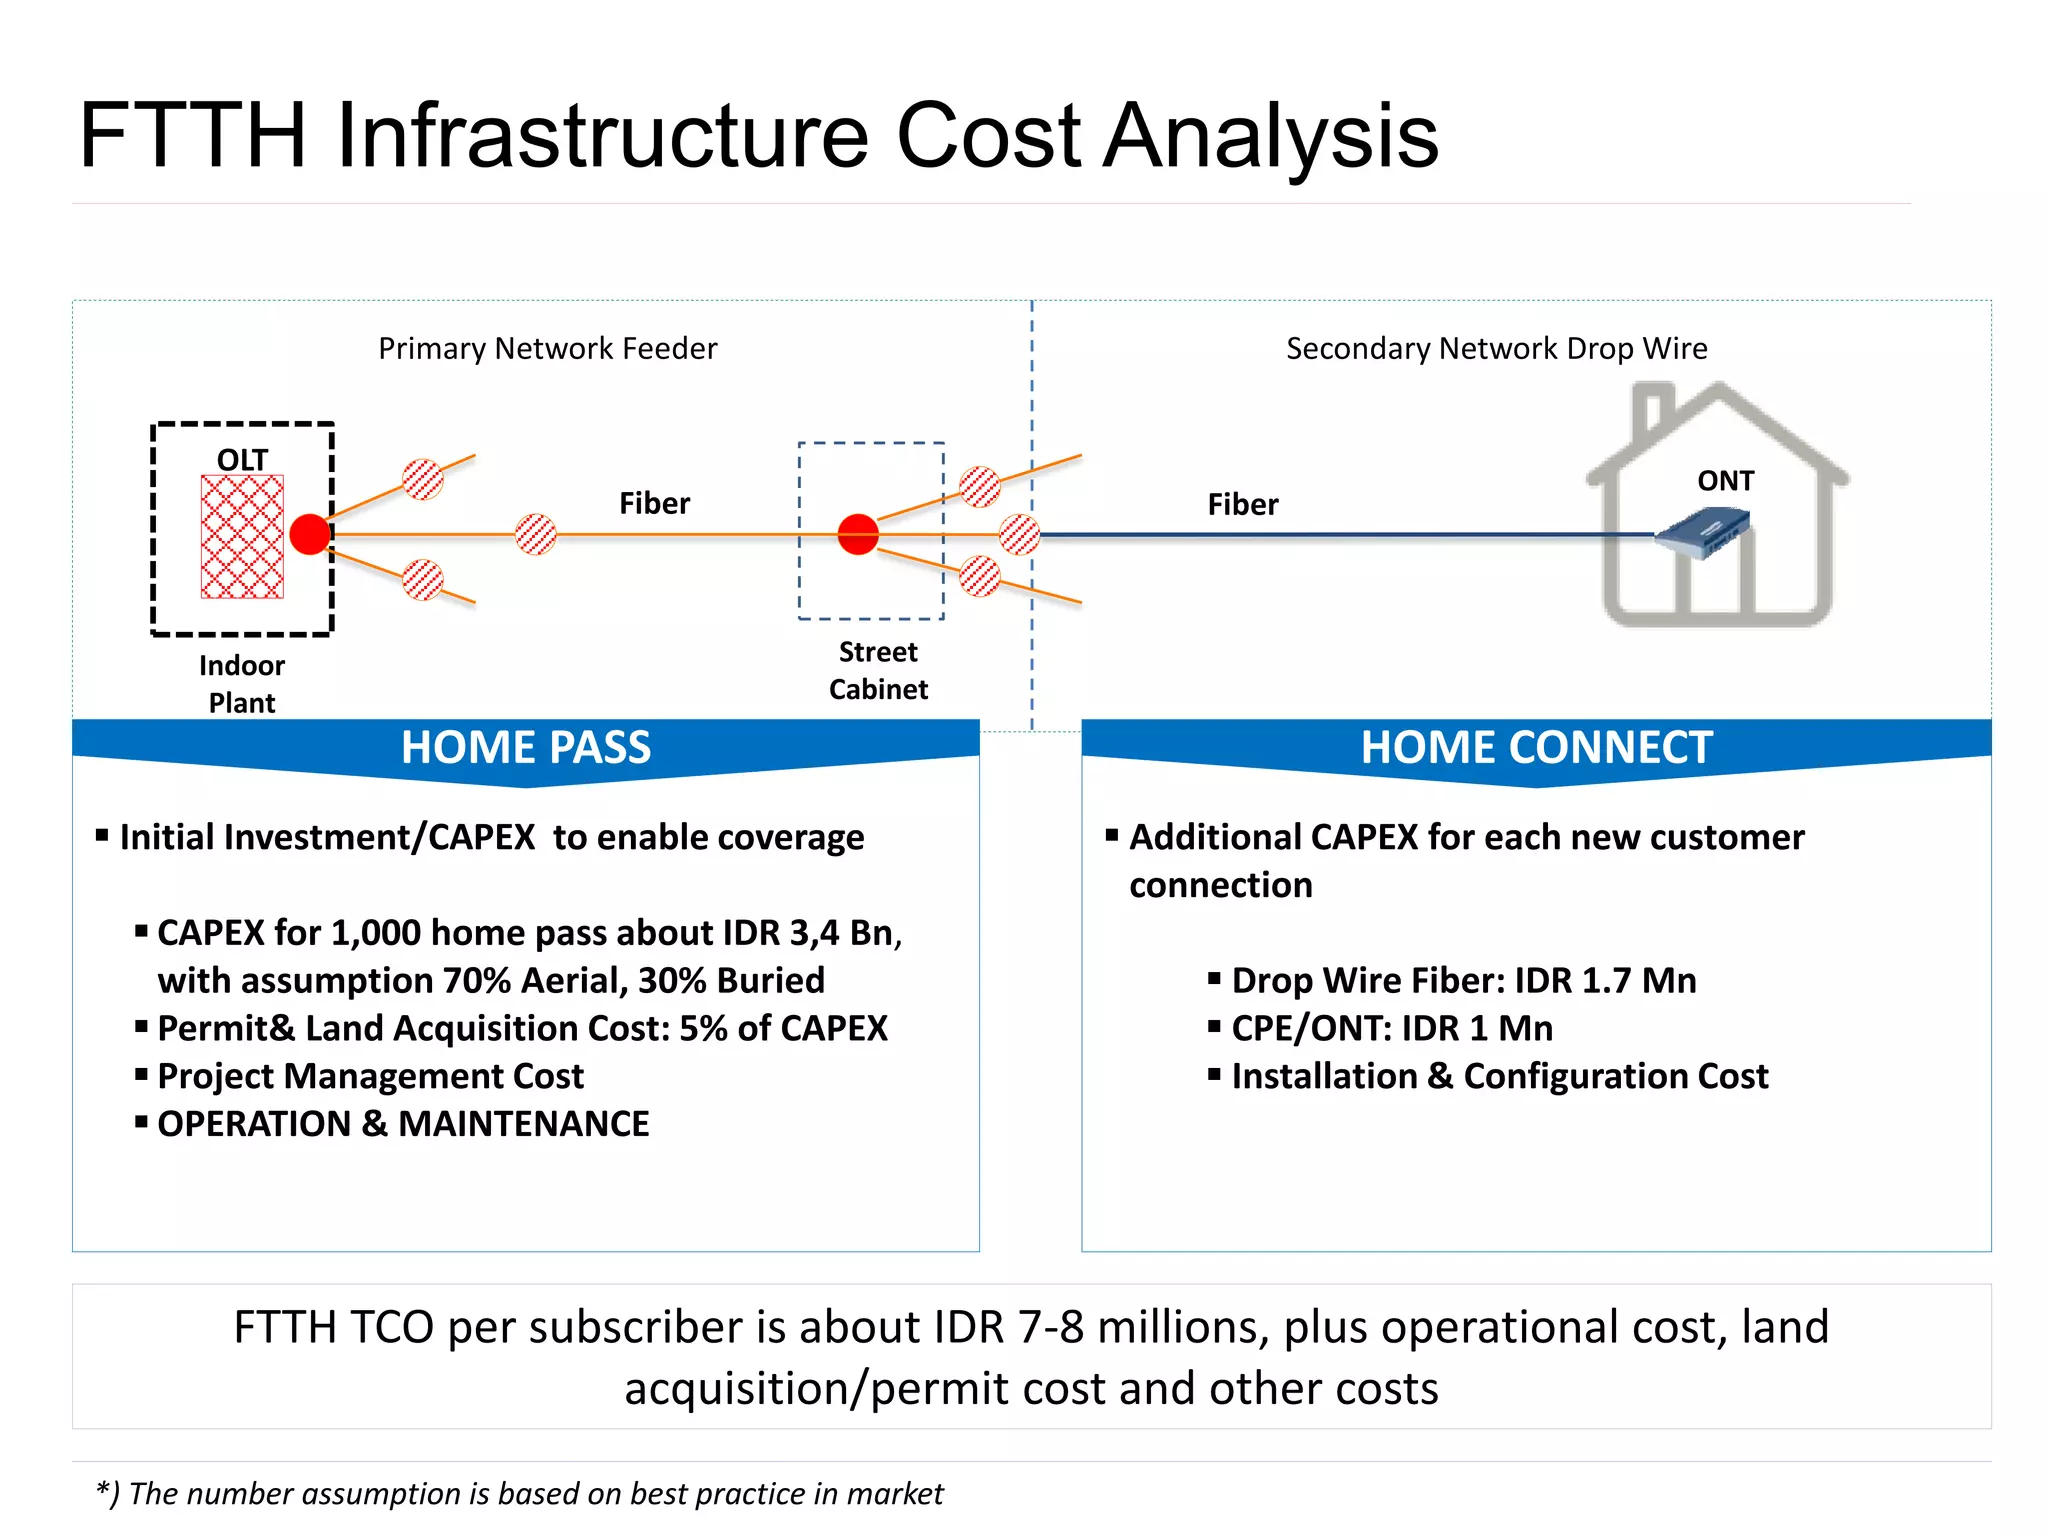
1. FTTH networks face several economic challenges including high upfront infrastructure costs, lack of regulations, and uncertain subscriber uptake.
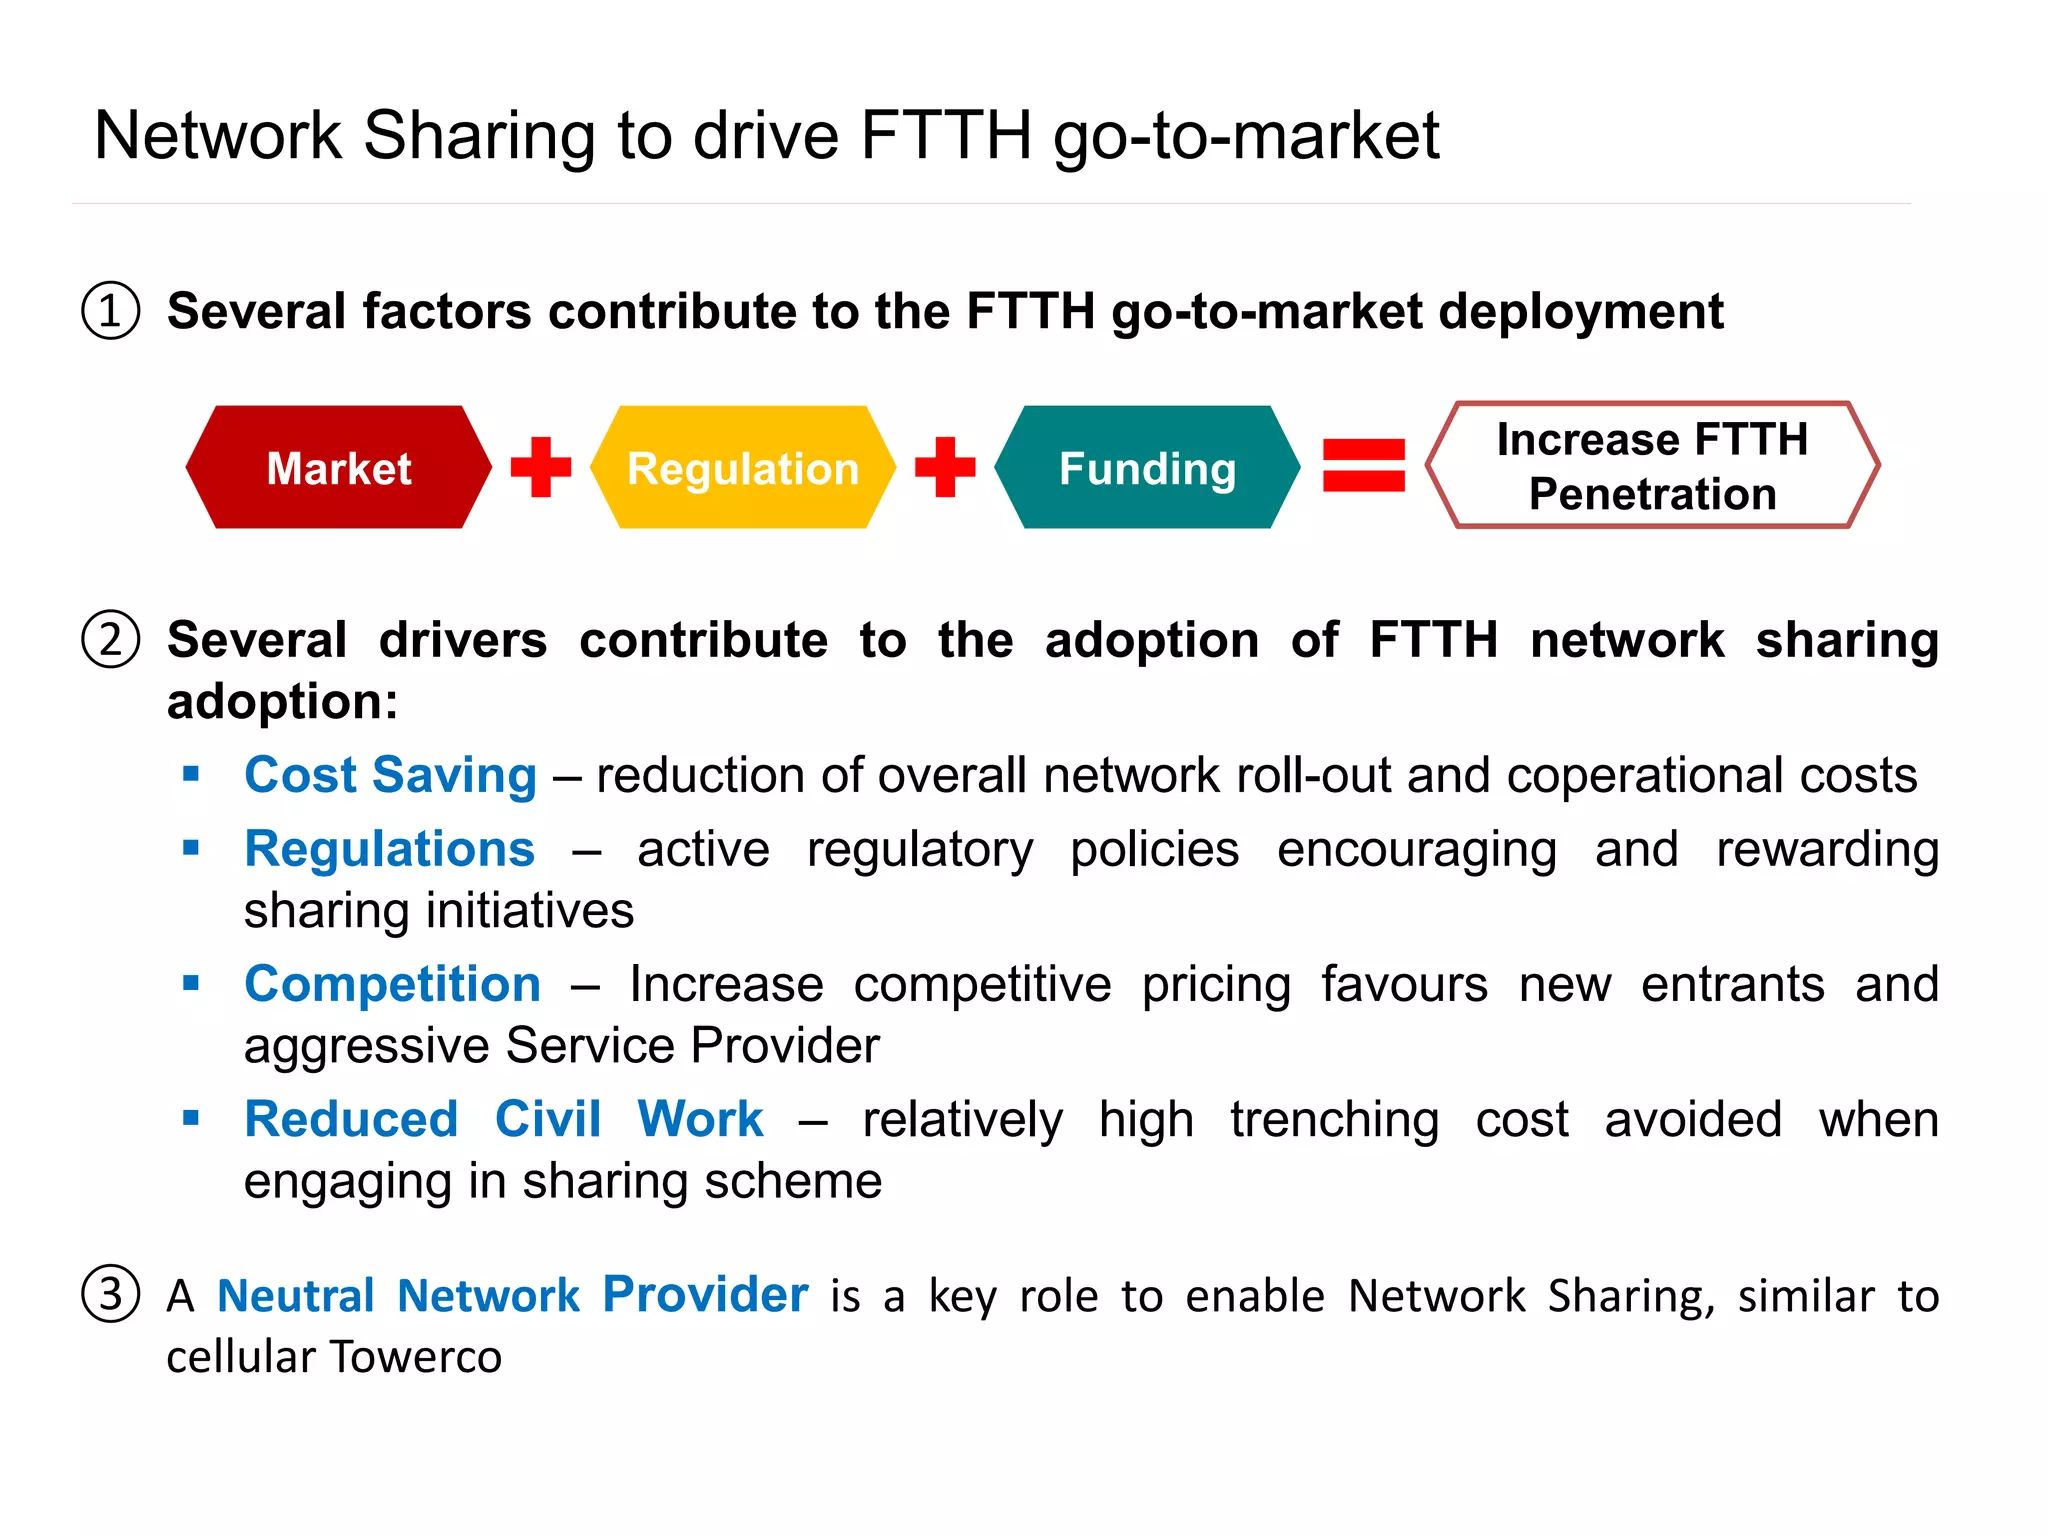
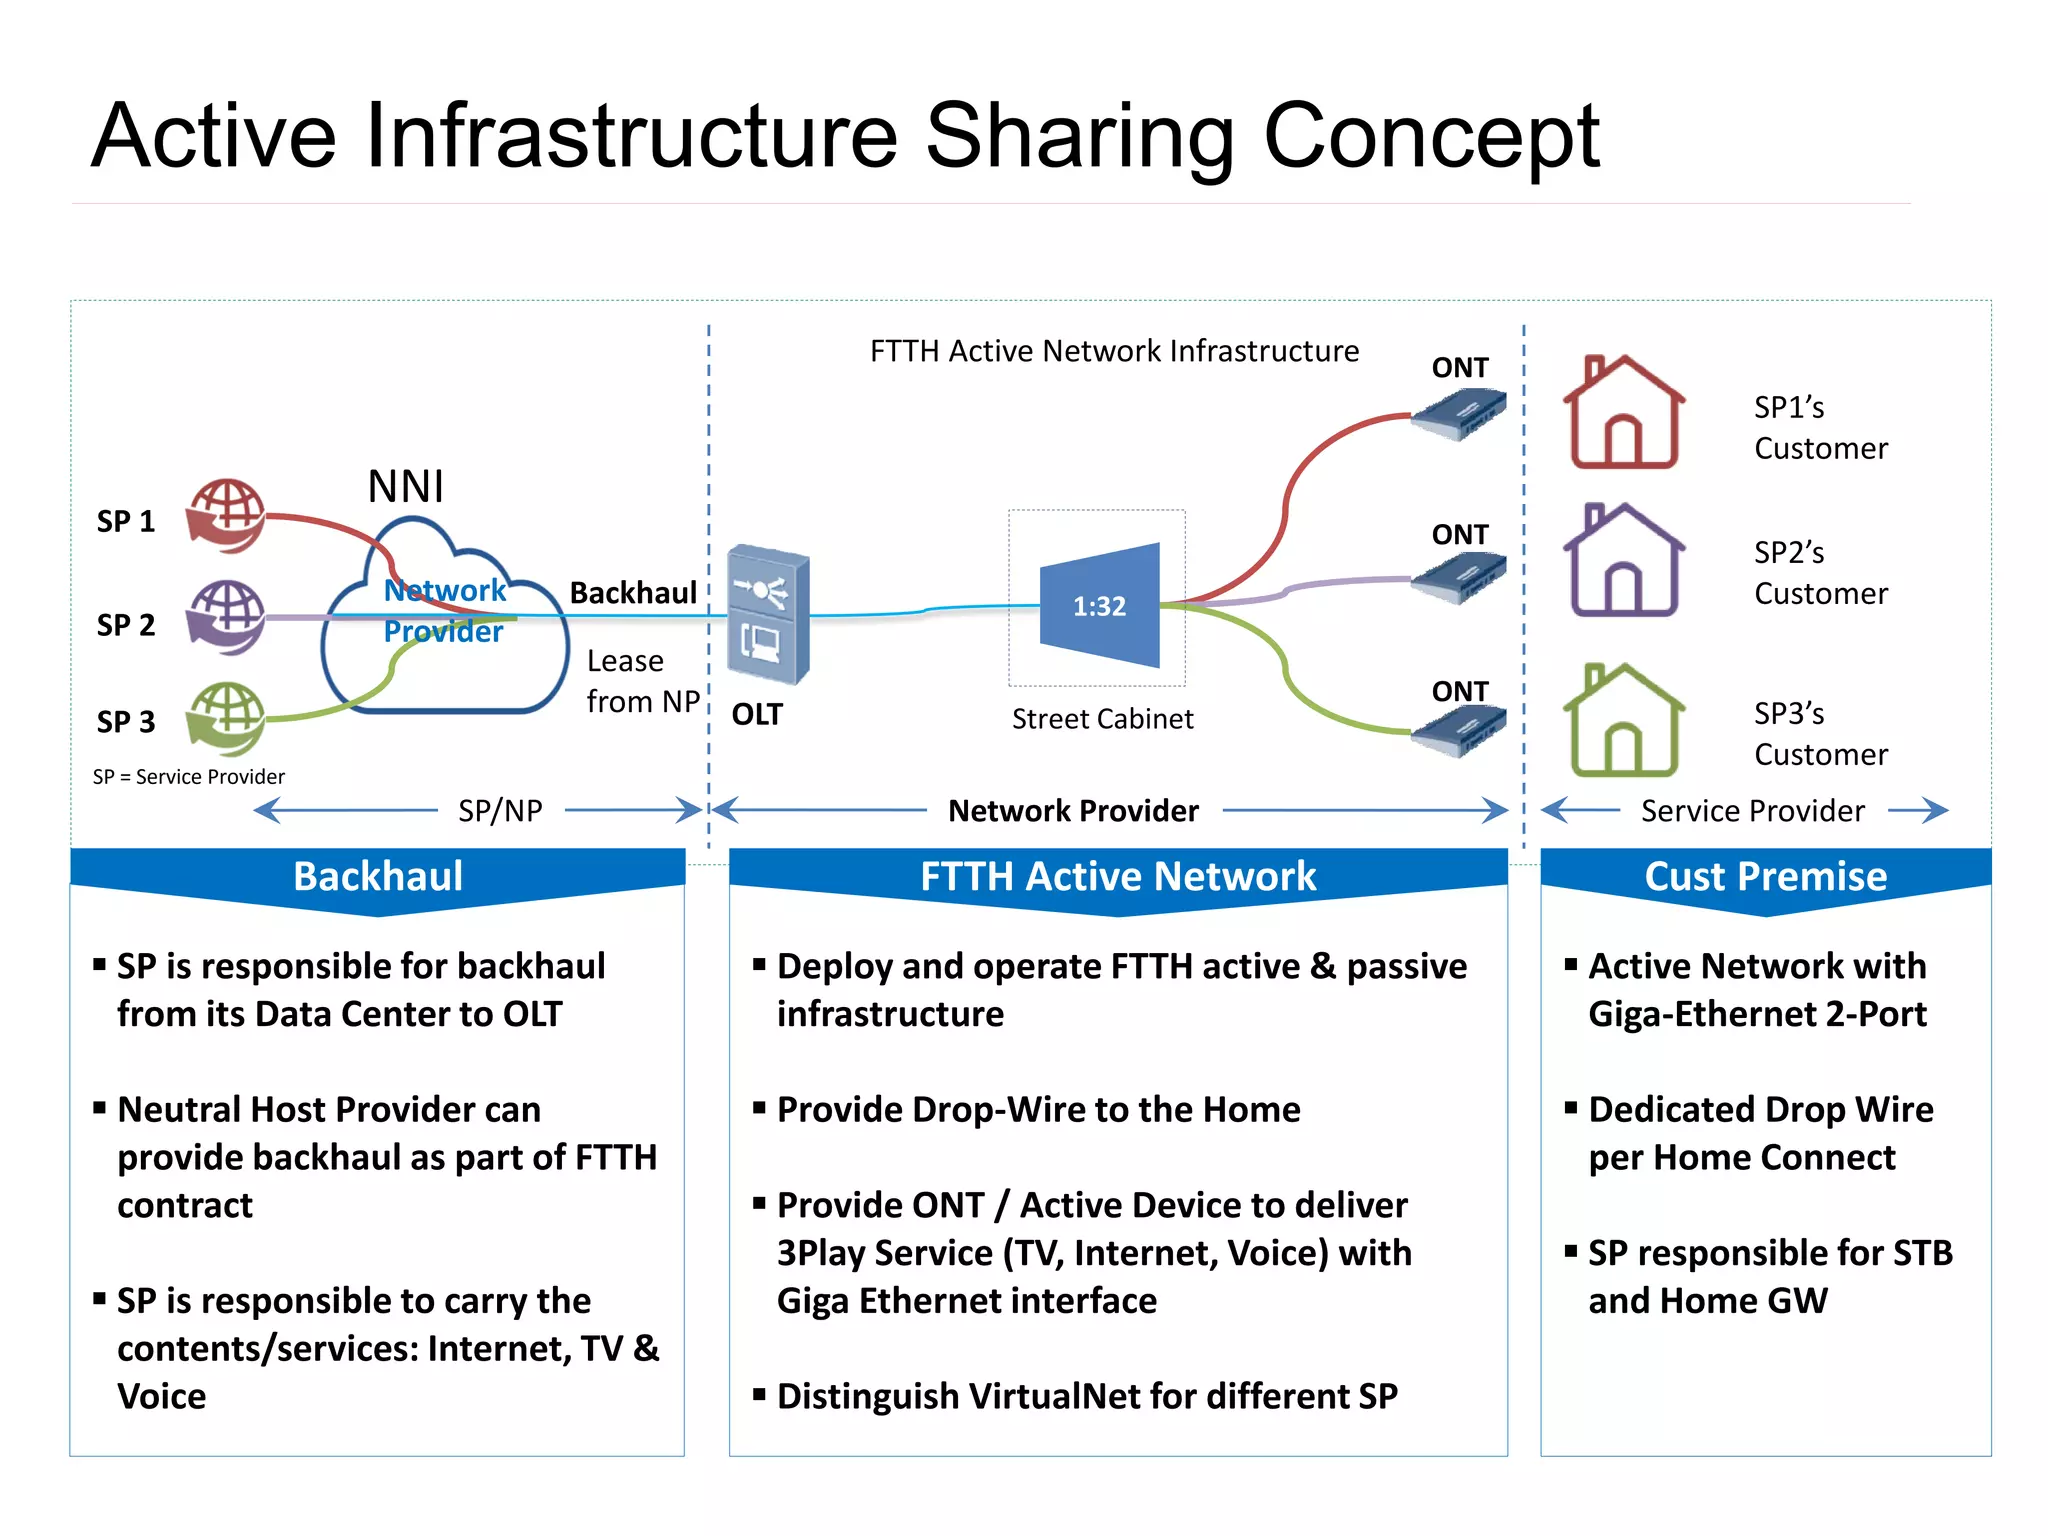
2. Network sharing is proposed as a solution to mitigate these risks by reducing costs through shared infrastructure and operations.
3. Key drivers of network sharing adoption are cost savings, supportive regulations, and the role of a neutral network provider to enable sharing between service providers.