Download as PDF, PPTX
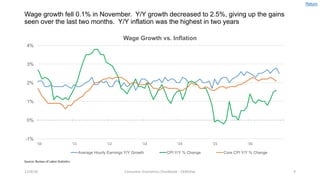
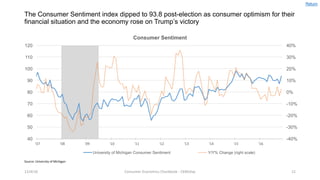
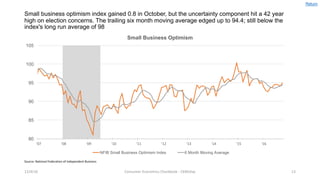

The document summarizes consumer economic trends in November 2016. It notes that US GDP grew 3.2% in Q2 2016, the strongest growth in two years. Consumer spending increased in October while average weekly earnings declined in November. Post-election consumer sentiment jumped by 6.5 points as consumers anticipated improved personal finances and economic conditions. Small business optimism edged up in October but concerns over the election drove uncertainty to a 42-year high.


