The document outlines an assignment for performing financial statement analysis in Excel, focusing on horizontal and vertical analyses as well as ratio analysis using financial statements from a selected company. It details the specific tasks to be completed, the data sources required, and submission methods, along with the purposes of the various analyses. Key aspects include examining income statements and balance sheets over three years to evaluate company performance and compare it with industry peers.
![performing ratio anaysis is toRatio Analysisallow an analyst to
compare a company in an indsutry, to othercompanies in the
same industry, regardless of size. (When wecompare the same
ratios of companies of different sizes, in thesame industry, the
size of one company compared to its peersis not important.)
&C&"Arial,Bold"&12&A
&L&8Prepared by Joe Silverman
SDSU E-Mail: [email protected]
&C&8Page &P of &N
&D &T
&R&8File Saved as &F
in &Z
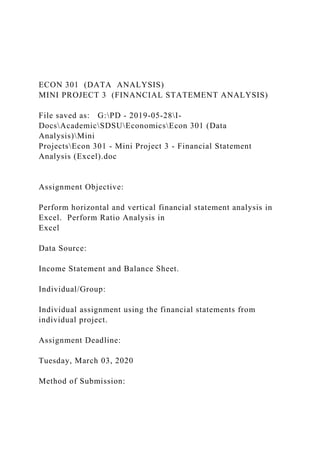
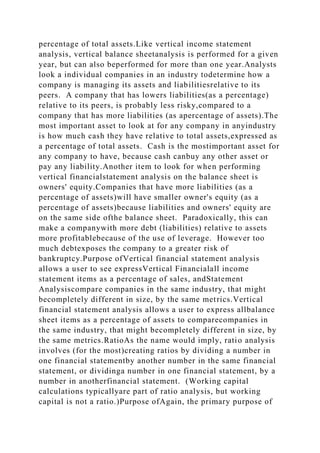
INCOME STATEMENT - 1Vertical Financial Statement
AnalysisAll Figures in ThousandsAll Figures in ThousandsAll
Figures in ThousandsYear Ending December 31Year Ending
December 31Year Ending December
31201020112012DollarsPercentageDollarsPercentageDollarsPer
centageSales$1,250,000$1,500,000$1,650,000-Cost of
Sales750,000950,000975,000Gross
Profit$500,000$550,000$675,000ExpensesBusiness
Insurance15,00015,00015,000Depreciation
Expense5,0005,0005,000Employee Health
Insurance25,00027,50030,000Manager
Salaries100,000125,000135,000Incentive
Pay5,00015,0001,875Interest
Expense35,00030,00025,000Office
Rent50,00050,00050,000Outside
Consultants25,00050,00075,000Travel and
Entertainment12,50015,00017,500Voice and
Data15,00017,50020,000Total
Expenses$287,500$350,000$374,375Pre-Tax Net
Income$212,500$200,000$300,625Taxes
(@35.0%)$74,375$70,000$105,219After-Tax Net
Income$138,125$130,000$195,406
&C&"Arial,Bold"&12&A
&L&8Prepared by Joe Silverman](https://image.slidesharecdn.com/econ301dataanalysisminiproject3financialst-221012031007-50f14a38/85/ECON-301-DATA-ANALYSIS-MINI-PROJECT-3-FINANCIAL-ST-docx-6-320.jpg)
![SDSU E-Mail: [email protected]&C&8Page &P of &N
&D &T
&R&8File Saved as &F
in &Z
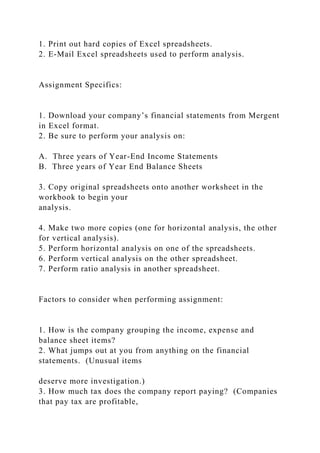
INCOME STATEMENT - 2Horizontal Financial Statement
AnalysisAll Figures in ThousandsAll Figures in ThousandsAll
Figures in ThousandsYear Ending December 31Year Ending
December 31Year Ending December
31201020112012DollarsDollarsPercentageDollarsPercentageSal
es$1,250,000$1,500,000$1,650,000-Cost of
Sales750,000950,000975,000Gross
Profit$500,000$550,000$675,000ExpensesBusiness
Insurance15,00015,00015,000Depreciation
Expense5,0005,0005,000Employee Health
Insurance25,00027,50030,000Manager
Salaries100,000125,000135,000Incentive
Pay5,00015,0001,875Interest
Expense35,00030,00025,000Office
Rent50,00050,00050,000Outside
Consultants25,00050,00075,000Travel and
Entertainment12,50015,00017,500Voice and
Data15,00017,50020,000Total
Expenses$287,500$350,000$374,375Pre-Tax Net
Income$212,500$200,000$300,625Taxes
(@35.0%)$74,375$70,000$105,219After-Tax Net
Income$138,125$130,000$195,406
&C&"Arial,Bold"&12&A
&L&8Prepared by Joe Silverman
SDSU E-Mail: [email protected]&C&8Page &P of &N
&D &T
&R&8File Saved as &F
in &Z
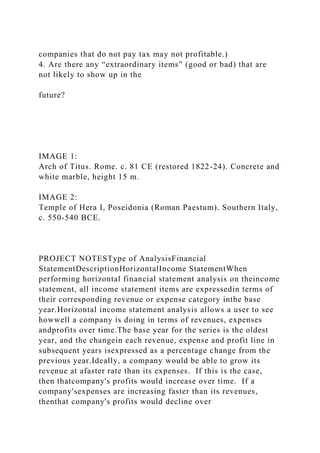
BALANCE SHEET - 1Vertical Financial Statement AnalysisAll
Figures in ThousandsAll Figures in ThousandsAll Figures in
ThousandsDecember 31, 2010December 31, 2011December 31,
2012DollarsPercentageDollarsPercentageDollarsPercentageAsse](https://image.slidesharecdn.com/econ301dataanalysisminiproject3financialst-221012031007-50f14a38/85/ECON-301-DATA-ANALYSIS-MINI-PROJECT-3-FINANCIAL-ST-docx-7-320.jpg)
![tsCurrent AssetsCash100,000147,500150,000Accounts
Receivable125,000175,000295,000Inventory225,000235,000240
,000Total Current Assets$450,000$557,500$685,000Long Term
AssetsFixtures50,00050,00055,000Tools and
Equipment125,000135,000130,000Vehicles155,000150,000145,
000Accumulated Depreciation-35,000-40,000-45,000Total Long
Term Assets$295,000$295,000$285,000Total
Assets$745,000$852,500$970,000LiabilitiesCurrent
LiabilitiesAccounts Payable75,00085,00095,000Notes
Payable50,00047,50045,000Total Current
Liabilities$125,000$132,500$140,000Long Term
LiabilitiesLong Term Debt (Due December 31,
2015)125,000120,000115,000Long Term Debt (Due December
31, 2020)050,00044,594Total Long Term
Debt$125,000$170,000$159,594Total
Liabilities$250,000$302,500$299,594Owner's EquityPaid in
Capital200,000200,000200,000Beginning Retained
Earnings231,875295,000350,000Net
Income138,125130,000195,406-Dividends to
Shareholders75,00075,00075,000=Retained
Earnings295,000350,000470,406Total Owner's
Equity495,000550,000670,406Total Liabilities and
Equity745,000852,500970,000Out of Balance00-0
&C&"Arial,Bold"&12&A
&L&8Prepared by Joe Silverman
SDSU E-Mail: [email protected]&C&8Page &P of &N
&D &T&R&8File Saved as &F
in &Z
BALANCE SHEET - 2Horizontal Financial Statement
AnalysisAll Figures in ThousandsAll Figures in ThousandsAll
Figures in ThousandsDecember 31, 2010December 31,
2011December 31,
2012DollarsDollarsPercentageDollarsPercentageAssetsCurrent
AssetsCash100,000147,500150,000Accounts
Receivable125,000175,000295,000Inventory225,000235,000240
,000Total Current Assets$450,000$557,500$685,000Long Term](https://image.slidesharecdn.com/econ301dataanalysisminiproject3financialst-221012031007-50f14a38/85/ECON-301-DATA-ANALYSIS-MINI-PROJECT-3-FINANCIAL-ST-docx-8-320.jpg)
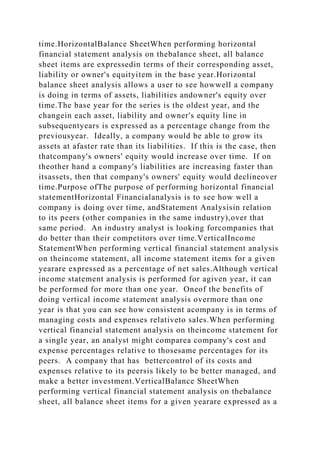
![AssetsFixtures50,00050,00055,000Tools and
Equipment125,000135,000130,000Vehicles155,000150,000145,
000Accumulated Depreciation-35,000-40,000-45,000Total Long
Term Assets$295,000$295,000$285,000Total
Assets$745,000$852,500$970,000LiabilitiesCurrent
LiabilitiesAccounts Payable75,00085,00095,000Notes
Payable50,00047,50045,000Total Current
Liabilities$125,000$132,500$140,000Long Term
LiabilitiesLong Term Debt (Due December 31,
2015)125,000120,000115,000Long Term Debt (Due December
31, 2020)050,00044,594Total Long Term
Debt$125,000$170,000$159,594Total
Liabilities$250,000$302,500$299,594Owner's EquityPaid in
Capital200,000200,000200,000Beginning Retained
Earnings231,875295,000350,000Net
Income138,125130,000195,406-Dividends to
Shareholders75,00075,00075,000=Retained
Earnings295,000350,000470,406Total Owner's
Equity495,000550,000670,406Total Liabilities and
Equity745,000852,500970,000Out of Balance00-0
&C&"Arial,Bold"&12&A
&L&8Prepared by Joe Silverman
SDSU E-Mail: [email protected]&C&8Page &P of &N
&D &T&R&8File Saved as &F
in &Z
Ratio FormulasLIQUIDITY RATIOSThe ability of the firm to
meet its short-term obligationsNET WORKING
CAPITALCURRENT ASSETS - CURRENT
LIABILITIESCURRENT RATIOCURRENT
ASSETS/CURRENT LIABILITIESQUICK RATIO(CURRENT
ASSETS - INVENTORY)/CURRENT LIABILITIESACTIVITY
RATIOSThe firm's ability to generate revenues in excess of
expenses and earn an adequate rate of returnINVENTORY
TURNOVERCOST OF GOODS SOLD/INVENTORYAVERAGE
COLLECTION PERIODACCOUNTS RECEIVABLE/AVERAGE
SALES PER DAYAVERAGE PAYMENT PERIODACCOUNTS](https://image.slidesharecdn.com/econ301dataanalysisminiproject3financialst-221012031007-50f14a38/85/ECON-301-DATA-ANALYSIS-MINI-PROJECT-3-FINANCIAL-ST-docx-9-320.jpg)
![PAYABLE/AVERAGE PURCHASES PER DAYDAYS IN
RECEIVABLESACCOUNTS RECEIVABLES/360FIXED
ASSET TURNOVERSALES/NET FIXED ASSETSTOTAL
ASSET TURNOVERSALES/TOTAL ASSETSDEBT
RATIOSThe extent to which a firm relies on debt
financing(DEGREE OF INDEBTEDNESS)DEBT RATIOTOTAL
LIABILITIES/TOTAL ASSETSDEBT-EQUITY RATIOLONG
TERM DEBT/STOCKHOLDER'S EQUITY(ABILITY TO
SERVICE DEBT)TIMES INTEREST EARNEDEARNINGS
BEFORE INTEREST AND TAXES/INTERESTFIXED-
PAYMENT COVERAGE RATIO(EARNINGS BEFORE
INTEREST AND TAXES + LEASE PAYMENTS)/
INTEREST + LEASE PAYMENTS {(PRINCIPAL +
PREFERRED DIVIDENDS) X [1/(1-T)]}PROFITABILITY
RATIOThe effectiveness of the firm's use of resourcesGROSS
PROFIT MARGINGROSS PROFITS/SALESOPERATING
PROFIT MARGINOPERATING PROFITS/SALESNET PROFIT
MARGINNET AFTER TAX PROFIT/SALESPRETAX NET
INCOME TO SALESPRE TAX PROFIT/SALESRETURN ON
TOTAL ASSETSNET AFTER TAX PROFIT/TOTAL
ASSETSRETURN ON EQUITYNET AFTER TAX
PROFIT/STOCKHOLDER'S EQUITYASSET
UTILIZATIONSALES TO CASHSALES TO ACCOUNT
RECEIVABLESSALES TO INVENTORYSALES TO
WORKING CAPITALSALES TO FIXED ASSETSSALES TO
TOTAL ASSETSMARKET UTILIZATIONPRICE TO
EARNINGS RATIOPRICE TO BOOK VALUE
RATIOEARNINGS YIELD RATIODIVIDEND YIELD
RATIODIVIDEND PAYOUT RATIO
&C&"Arial,Bold"&14General Motors&12
&A
&L&8Prepared by Joe Silverman
E-Mail: [email protected]&C&8Page &P of &N
&D &T&R&8File saved as &F
in &Z
RatiosLIQUIDITY RATIOS201020112012NET WORKING](https://image.slidesharecdn.com/econ301dataanalysisminiproject3financialst-221012031007-50f14a38/85/ECON-301-DATA-ANALYSIS-MINI-PROJECT-3-FINANCIAL-ST-docx-10-320.jpg)
![CAPITALCURRENT RATIOQUICK RATIOACTIVITY
RATIOSINVENTORY TURNOVERAVERAGE COLLECTION
PERIODAVERAGE PAYMENT PERIODDAYS IN
RECEIVABLESFIXED ASSET TURNOVERTOTAL ASSET
TURNOVERDEBT RATIOS(DEGREE OF
INDEBTEDNESS)DEBT RATIODEBT-EQUITY
RATIO(ABILITY TO SERVICE DEBT)TIMES INTEREST
EARNEDFIXED-PAYMENT COVERAGE
RATIOPROFITABILITY RATIOGROSS PROFIT
MARGINOPERATING PROFIT MARGINNET PROFIT
MARGINPRETAX NET INCOME TO SALESRETURN ON
TOTAL ASSETSRETURN ON EQUITYASSET
UTILIZATIONSALES TO CASHSALES TO ACCOUNT
RECEIVABLESSALES TO INVENTORYSALES TO
WORKING CAPITALSALES TO FIXED ASSETSSALES TO
TOTAL ASSETSMARKET UTILIZATIONPRICE TO
EARNINGS RATIOPRICE TO BOOK VALUE
RATIOEARNINGS YIELD RATIODIVIDEND YIELD
RATIODIVIDEND PAYOUT RATIO
&C&"Arial,Bold"&14General Motors&12
&A
&L&8Prepared by Joe Silverman
E-Mail: [email protected]DCCD.edu&C&8Page &P of &N
&D &T&R&8File saved as &F
in &Z
SHEET 3
&C&"Arial,Bold"&12&A
&L&8Prepared by Joe Silverman
Personal E-Mail: [email protected]&C&8Page &P of &N
&D &T&R&8File Saved as &F
in &Z
SHEET 4
&C&"Arial,Bold"&12&A
&L&8Prepared by Joe Silverman
Personal E-Mail: [email protected]&C&8Page &P of &N
&D &T&R&8File Saved as &F](https://image.slidesharecdn.com/econ301dataanalysisminiproject3financialst-221012031007-50f14a38/85/ECON-301-DATA-ANALYSIS-MINI-PROJECT-3-FINANCIAL-ST-docx-11-320.jpg)
![in &Z
SHEET 5
&C&"Arial,Bold"&12&A
&L&8Prepared by Joe Silverman
Personal E-Mail: [email protected]&C&8Page &P of &N
&D &T&R&8File Saved as &F
in &Z
SHEET 6
&C&"Arial,Bold"&12&A
&L&8Prepared by Joe Silverman
Personal E-Mail: [email protected]&C&8Page &P of &N
&D &T&R&8File Saved as &F
in &Z
NEW SHEET
&C&"Arial,Bold"&12&A
&L&8Prepared by Joe Silverman
Personal E-Mail: [email protected]&C&8Page &P of &N
&D &T&R&8File Saved as &F
in &Z
COMPUTER PAPER
&C&"Arial,Bold"&12&A
&L&8Prepared by Joe Silverman
University of San Diego
[email protected]&C&8Page &P of &N
&D &T&R&8File Saved as &F
in &Z
CALENDARSUNDAYMONDAYTUESDAYWEDNESDAYTHU
RSDAYFRIDAYSATURDAY1234567891011121314151617181
92021222324252627282930NOTES
&C&"Arial,Bold"&12&A
&L&8Prepared by Joe Silverman
619-954-5842
[email protected]&C&8Page &P of &N
&D &T&R&8File saved as &F
in &Z](https://image.slidesharecdn.com/econ301dataanalysisminiproject3financialst-221012031007-50f14a38/85/ECON-301-DATA-ANALYSIS-MINI-PROJECT-3-FINANCIAL-ST-docx-12-320.jpg)