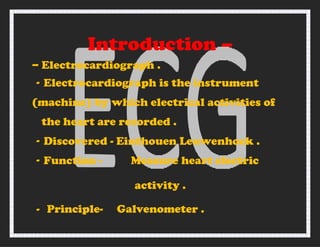
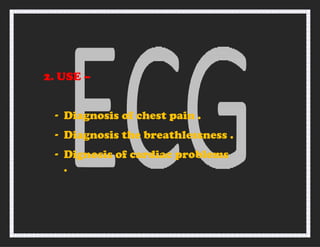
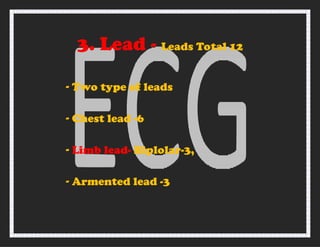
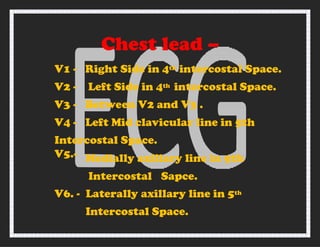
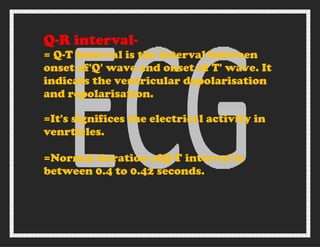
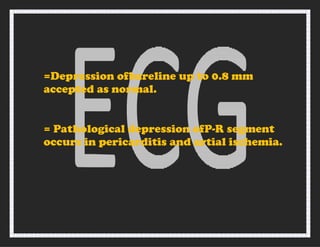
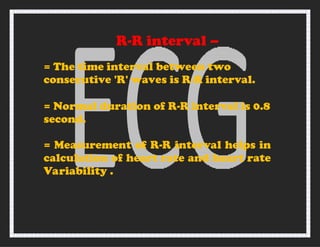
The document provides an overview of the electrocardiograph (ECG), its function, and key concepts related to heart electrical activity. It describes the different leads used in ECG, the significance of various waves and intervals, and their normal durations, along with conditions that may cause prolongation or shortening of these intervals. Additionally, it covers how to calculate heart rate based on R-R intervals.
![Doon Ayurvedic medical college and hospital
[ Saharanpur ]
Guide by – Dr. Anu Bhardwaj
{ B. A. M. S. , M.D. Ayu. }
Perform by – Rajdeep Singh
{ Batch – 2023-24 }](https://image.slidesharecdn.com/rajbannappt-240910122118-f3a907e0/85/ECG-ELECTRO-CARDIO-GRAPH-USE-INTRODUCTION-lead-ECG-waves-1-320.jpg)
![Doon Ayurvedic medical college and hospital
[ Saharanpur ]
Guide by – Dr. Anu Bhardwaj
{ B. A. M. S. , M.D. Ayu. }
Perform by – Rajdeep Singh
{ Batch – 2023-24 }](https://image.slidesharecdn.com/rajbannappt-240910122118-f3a907e0/75/ECG-ELECTRO-CARDIO-GRAPH-USE-INTRODUCTION-lead-ECG-waves-1-2048.jpg)


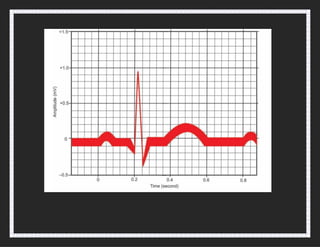
![Heart rate -
Regular rhythm = 300/ Laege box between
R-R interval .
Rate = 300 / 4
= 75 bpm
Irregular rhythm =
[ No. of R waves in 6 sec ][ 10 ]](https://image.slidesharecdn.com/rajbannappt-240910122118-f3a907e0/85/ECG-ELECTRO-CARDIO-GRAPH-USE-INTRODUCTION-lead-ECG-waves-23-320.jpg)