Download to read offline
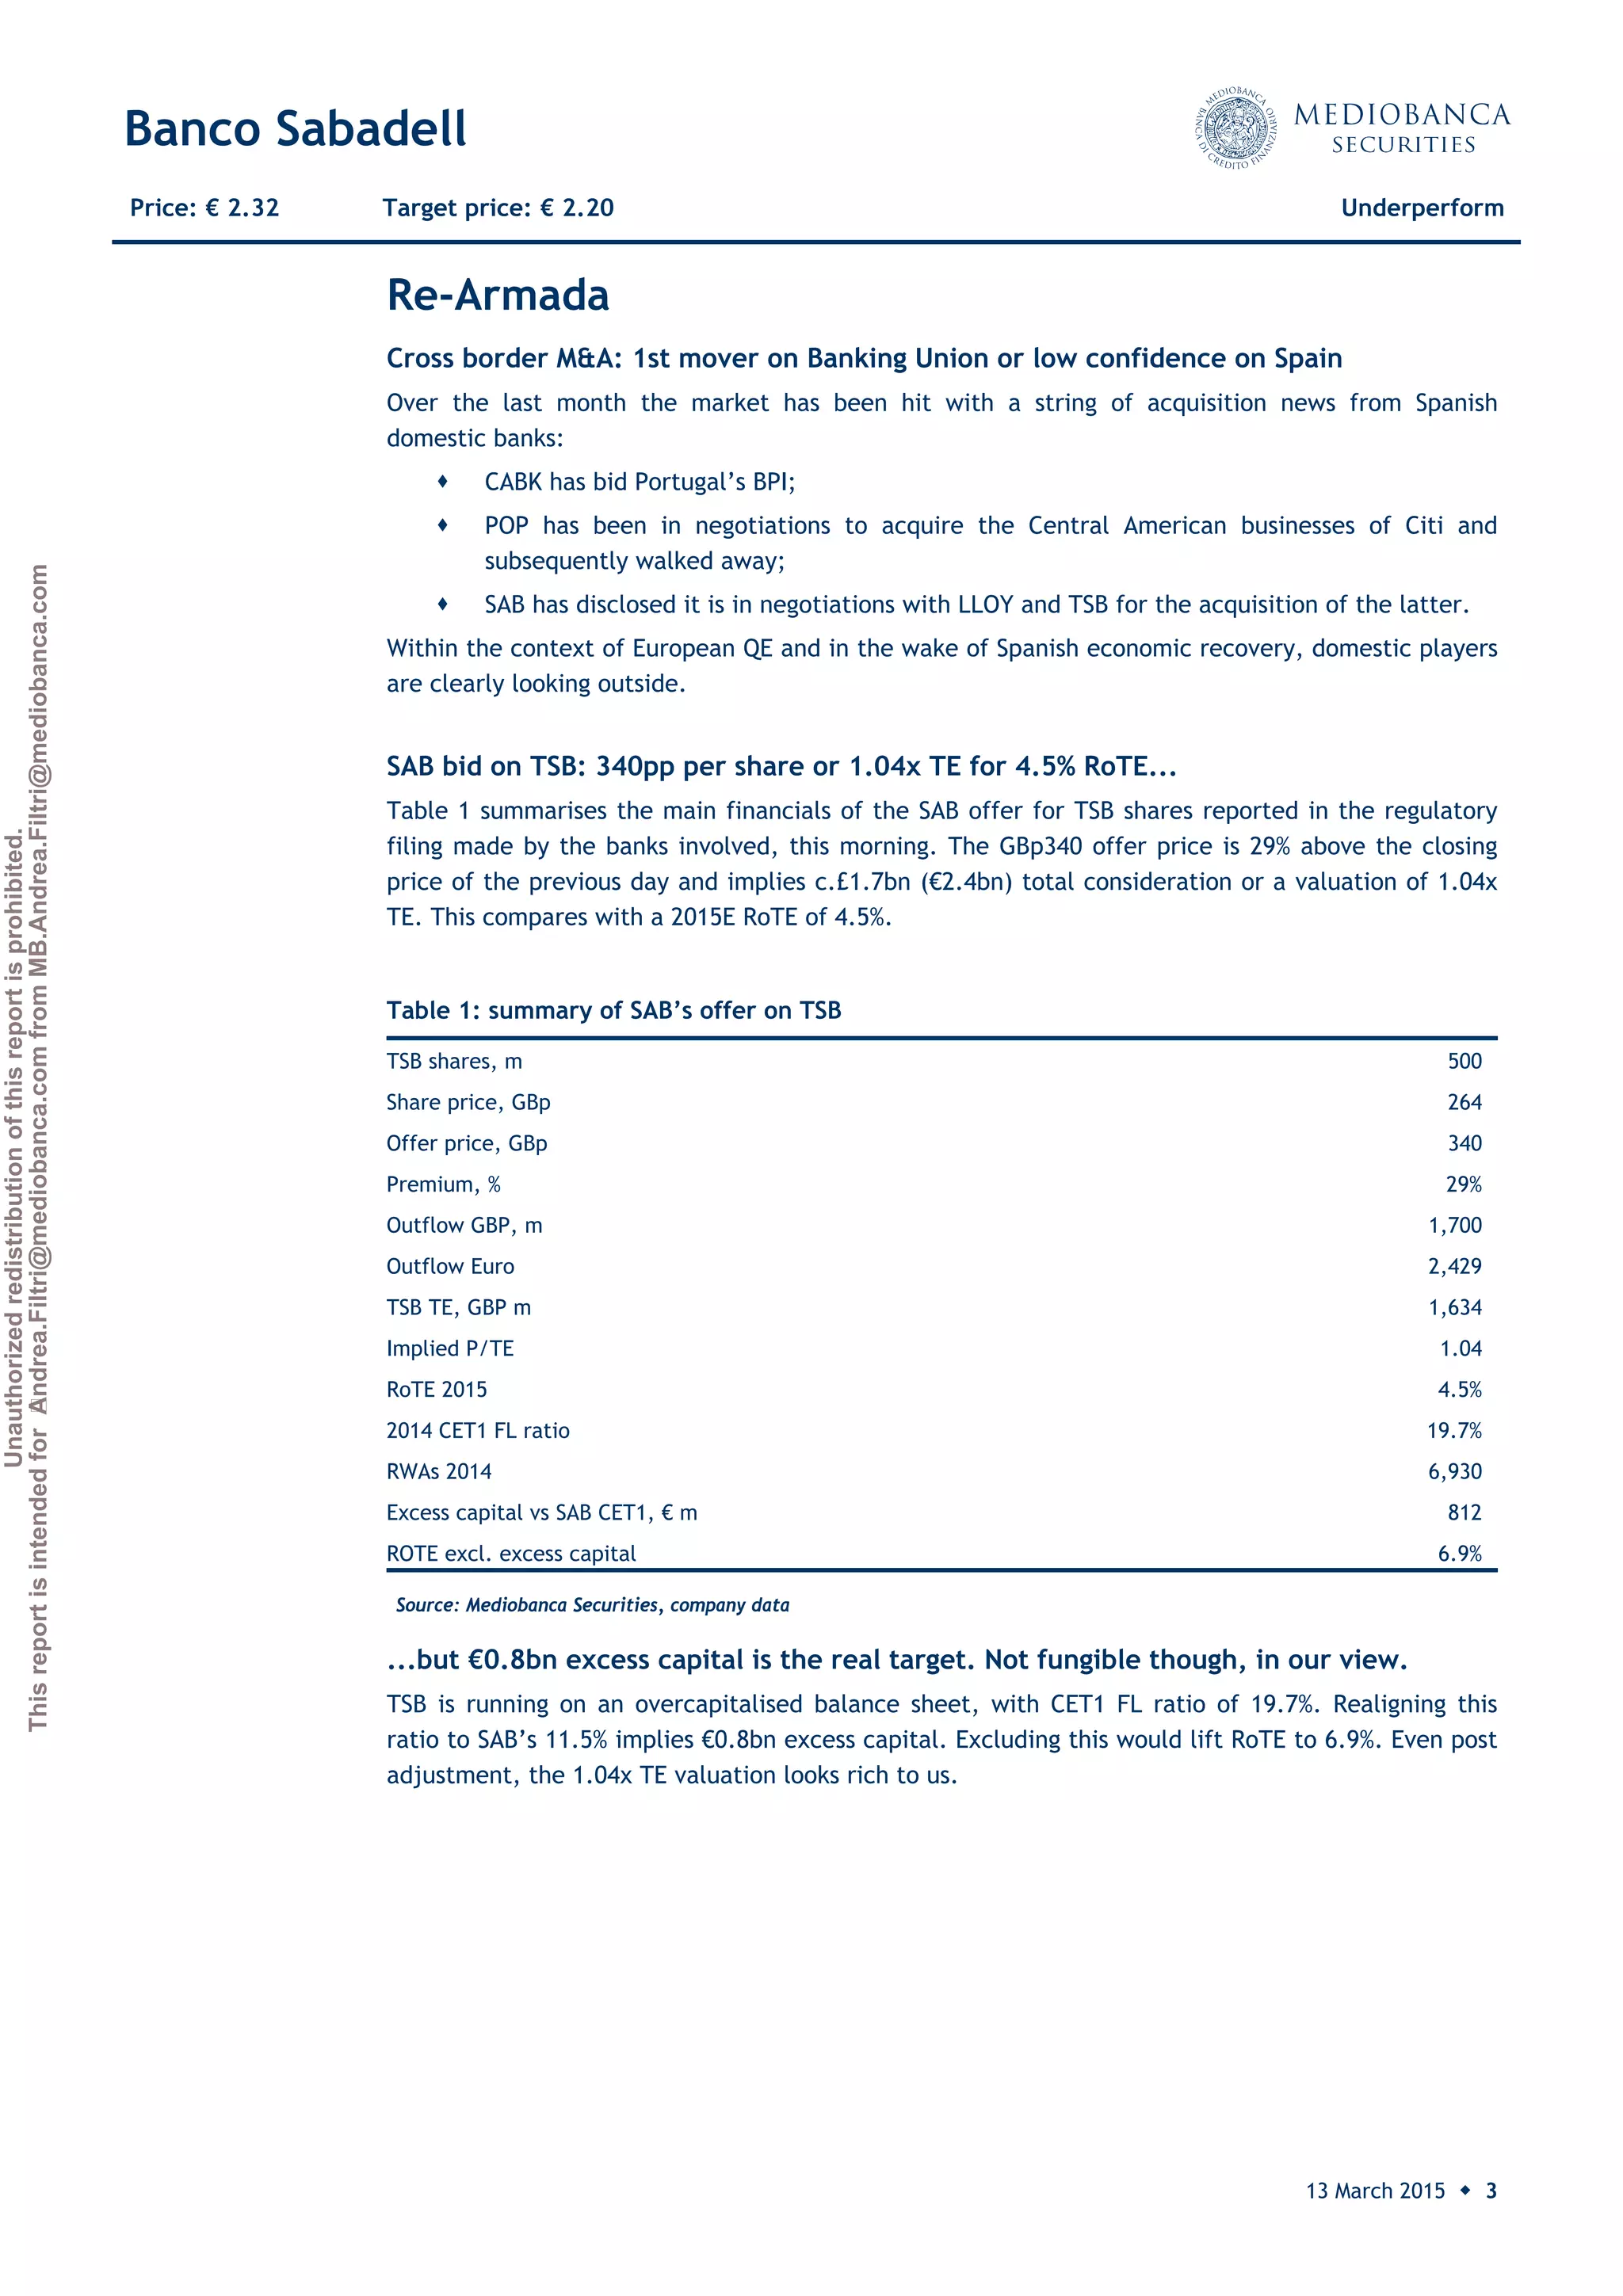

Banco Sabadell has disclosed plans to acquire TSB for £1.7 billion (€2.4 billion), representing a 29% premium over TSB's previous closing share price. The acquisition values TSB at 1.04 times tangible equity for a projected 2015 return on tangible equity of 4.5%. However, TSB is overcapitalized with €0.8 billion in excess capital compared to Sabadell's capital ratio; excluding this excess capital raises TSB's projected 2015 return on tangible equity to 6.9%. The acquisition is seen as an attempt to diversify away from Spain into the UK market. However, political risks from elections in the UK, Spain and Portugal this year and regulatory complexity raise


