Ebola´s evolution on Twitter by Miguel del Fresno (24,8 millions tweets) #Ebola #EbolaOutbreak
•
1 like•1,638 views

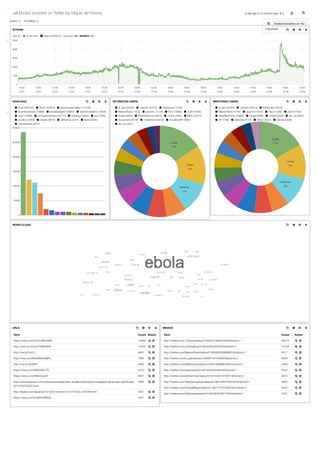
This document analyzes data and trends related to discussions of Ebola on Twitter over a 24 day period from October 7th to October 26th. It includes graphs and statistics on numbers of tweets per minute about Ebola, top retweeted and mentioned users, popular hashtags, languages used, top countries of tweet origins, and URLs shared. Maps show geographic locations and trends over time are shown in heatmaps.

Recommended
More Related Content
More from Miguel del Fresno
More from Miguel del Fresno (20)
Recently uploaded
Recently uploaded (20)
Ebola´s evolution on Twitter by Miguel del Fresno (24,8 millions tweets) #Ebola #EbolaOutbreak
- 1. Ebola´s evolution on Twitter (by Miguel del Fresno) QUERY ! FILTERING " time must ○ $ # field : created_at from : 2014-10-07T07:34:34.716Z to : now + 24 days ago to 4 minutes ago ) () ( * ' STREAM , + ' # View ) | - Zoom Out | ○ status (24803005) count per 1m | (24803005 hits) Bars Lines Stack Percent Legend Interval 1m . 6000 5000 4000 3000 2000 1000 RETWEETED USERS , + ' . # , + ' # ○ cnnbrk (63486) ○ Dory (61472) ○ el_pais (49258) ○ A3Noticias (49147) ○ nytimes (47691) ○ YaBoyEboIa (44145) ○ CloydRivers (43710) ○ WorldStarFunny (41887) ○ _Kyheim (41272) ○ AP (39105) ○ ItsYaVirusEBOLA (38608) ○ CHlLDHOODRUINER (36158) ○ TweetLikeAGirI (36155) ○ chrisbrown (30655) ○ ActualidadRT (30230) MENTIONED USERS . ○ cnnbrk (78897) ○ nytimes (75799) ○ YouTube (68989) ○ CNN (67232) ○ Dory (66949) ○ el_pais (64939) ○ WHO (64308) ○ AP (63125) ○ CDCgov (60577) ○ FoxNews (58846) ○ A3Noticias (51693) ○ YaBoyEboIa (47207) ○ ItsYaVirusEBOLA (42254) ○ _Kyheim (41726) ○ TweetLikeAGirI (41411) HASHTAGS , + ' . # , + ' # ○ ebola (3165988) ○ ébola (490965) ○ tcot (181129) ○ news (148201) ○ salvemosaexcalibur (100745) ○ anamatodimision (73783) ○ breaking (65072) ○ cdc (62725) ○ isis (57467) ○ ebolaoutbreak (57242) ○ health (54513) ○ obama (53577) ○ liberia (42655) ○ cuba (42444) ○ africa (40925) LANGUAGE . ○ en (16215904) ○ es (4973754) ○ pt (1378125) ○ fr (798825) ○ it (243459) ○ in (216111) ○ tr (196047) ○ und (115727) ○ de (88764) ○ nl (78625) ○ sv (66450) ○ ja (62077) ○ tl (60593) ○ ht (58426) ○ ar (37009) ○ Missing field (0) ○ Other values (212024) 3500000 3000000 2500000 2000000 1500000 1000000 500000 COUNTRIES , + ' # Term Count Action United States 160179 / ○ Brasil 39617 / ○ España 30313 / ○ United Kingdom 19526 / ○ Argentina 11402 / ○ France 8274 / ○ Chile 4916 / ○ Canada 4877 / ○ México 4822 / ○ Venezuela, Bolivarian Republic Of 3405 / ○ Other values 61096 17500000 15000000 12500000 10000000 7500000 5000000 2500000 . HEATMAP BY COUNTRY , + ' . # " ' + " ' + 00:00 10-08 00:00 10-09 00:00 10-10 00:00 10-11 00:00 10-12 00:00 10-13 00:00 10-14 00:00 10-15 00:00 10-16 00:00 10-17 00:00 10-18 00:00 10-19 00:00 10-20 00:00 10-21 00:00 10-22 00:00 10-23 00:00 10-24 00:00 10-25 00:00 10-26 23:00 10-26 23:00 10-27 23:00 10-28 23:00 10-29 23:00 10-30 0 0 0
- 2. PLACES , + ' . # 11 352 319 2632 980 32 9 445 11 38 19516 3480 63 17 3198 82 31988 2105 5 36315 7419 111 160 5 31 86 14242 14720995 16 297 12 496 311 5 41 180 357 86 253 3875 1748 398 91 1018 1445 2858 3 60 199 76 1923 353 4247 41 7 666 34 1514 1657 14 472 551 7 2 421 1244 93 394 3 76 67 3 474 54 5 7 19 11004 18 11204 299 62 778 750 121 WORD CLOUD , + ' . # URLS , + ' # Term Count Action https://vine.co/v/OqXgIBteqVI 81092 / ○ http://zpr.io/GDgy 58110 / ○ https://vine.co/v/OAtZx0uJ7BH 52565 / ○ https://vine.co/v/OM6Y9xpwKTe 50824 / ○ http://vine.co/v/OKHjtBZAaj3 42788 / ○ https://vine.co/v/OM6zh6aJ0uH 36904 / ○ https://vine.co/v/OmV7QWtJXHK 32499 / ○ https://vine.co/v/ObA1UHxpTWv 32065 / ○ http://vine.co/v/OM6Y9xpwKTe 28520 / ○ http://vine.co/v/OmV7QWtJXHK 23255 / ○ 1965 190 17 . MEDIAS , + ' . # Term Count Action http://twitter.com/thereaIbanksy/status/527272805864587264/photo/1 45690 / ○ http://twitter.com/_Kyheim/status/519225219983376385/photo/1 41864 / ○ http://twitter.com/tchampp/status/525091479627513856/photo/1 31222 / ○ http://twitter.com/TweetLikeAGirI/status/524903538091388928/photo/1 27081 / ○ http://twitter.com/RelatableQuote/status/527174765329788928/photo/1 22001 / ○ http://twitter.com/nickbilton/status/525459712335044608/photo/1 21703 / ○ http://twitter.com/CHlLDHOODRUINER/status/521208471715586048/photo/1 21347 / ○ http://twitter.com/ayylmao/status/522982881652903936/photo/1 20035 / ○ http://twitter.com/RelatableQuote/status/524951318604304385/photo/1 17969 / ○ http://twitter.com/TweetLikeAGirI/status/520319878595887104/photo/1 13296 / ○ 288 ++ -- Leaflet (http://leafletjs.com) | Data, imagery and map information provided by MapQuest, OpenStreetMap and contributors, ODbL
- 3. " . ' + ADD A ROW Add panel to empty row , + ' # 1 0 to 25 of 125 available for paging 2 0 to 25 of 125 available for paging 2 TWEETS acq_retweets 3 " ! created_at " ! retweeted_status.created_at " ! retweeted_status.retweet_count " ! user.screen_name " ! retweeted_status.user.screen_name " ! text " ! user.location 38279 Mon Oct 13 07:02:04 +0000 2014 chrisbrown I don't know ... But I think this Ebo... 27684 Wed Oct 29 01:36:47 +0000 2014 thereaIbanksy Hunger kills more than Ebola but it's... we own nothing shared 27415 Sun Oct 26 00:51:00 +0000 2014 ArianaGrande "ariana grande! afraid to go to NYC b... Honeymoon ave. 22032 Wed Oct 08 05:42:51 +0000 2014 Dory *Ebola joke* everyone laughs P. Sherman 42 Wallaby Way 19638 Wed Oct 22 12:42:10 +0000 2014 TweetLikeAGirI I would rather get Ebola then receive... 18966 Fri Oct 24 01:32:12 +0000 2014 nickbilton There are more experts on CNN right n... LA 17915 Fri Oct 17 05:30:10 +0000 2014 ayylmao WE NEED THIS NIGGA TO FIGHT THE EBOLA... 17325 Wed Oct 29 16:30:03 +0000 2014 BanksyOfficiaI Hunger kills more than Ebola but it's... we own nothing shared 16514 Tue Oct 28 18:01:28 +0000 2014 Dory When you thought you had a cold but y... P. Sherman 42 Wallaby Way 16089 Wed Oct 22 15:52:02 +0000 2014 RelatableQuote I would rather get Ebola than receive... 14916 Sun Oct 12 15:17:08 +0000 2014 WhiteVsBlackTwt the air ebola 11s http://t.co/qbbjY9o... 14783 Sun Oct 26 17:39:48 +0000 2014 philippeal1 La faim tue plus qu'Ebola, mais l'occ... 13126 Wed Oct 08 20:07:47 +0000 2014 _Leahyates If Ebola was a haircut http://t.co/YC... 12489 Mon Oct 13 03:01:04 +0000 2014 TweetLikeAGirI Ebola was mentioned in The Lizzie McG... 12098 Thu Oct 09 04:42:26 +0000 2014 DrogadoSoy Ojalá el Ébola pase por Las Vegas; po... Colombia 11975 Thu Oct 09 21:08:20 +0000 2014 TweetLikeAGirI I KNOW WHO CAN CURE EBOLA http://t.co... 11905 Mon Oct 13 00:31:47 +0000 2014 ImLizzieM Ebola was mentioned in The Lizzie McG... The Digital Bean 11026 Sat Oct 11 15:54:35 +0000 2014 AverageGoal Not catching ebola. 10999 Fri Oct 10 04:35:59 +0000 2014 shevil_ I pray Ebola doesn't effect anyone I ... plottin 10806 Thu Oct 09 20:03:21 +0000 2014 luke_brooks "Can you be my first kiss, I don't ha... Melbourne, Australia 10088 Wed Oct 15 22:20:02 +0000 2014 WhiteHouse #Ebola is NOT spread through: 1. ... Washington, DC 9966 Tue Oct 28 19:07:13 +0000 2014 RelatableQuote When you thought you had a cold but y... 9455 Tue Oct 28 02:09:38 +0000 2014 tarareba722 エボラ報道については、(陰性だったという話も大事かもしれんが)一番大 事なこ... 東京 9382 Thu Oct 16 03:07:09 +0000 2014 sammyROLLSTRONG I pray Ebola doesn't effect anyone I ... Tampa FL USA 9371 Tue Oct 07 18:11:39 +0000 2014 MejoresTwits Ordenan matar al perro de la enferma ... + " ' +