
Recommended
Recommended
More Related Content
What's hot
Similar to Easy skill oil & gas/Note Australia, may 2014
Similar to Easy skill oil & gas/Note Australia, may 2014 (20)
Recently uploaded
Recently uploaded (20)
Easy skill oil & gas/Note Australia, may 2014
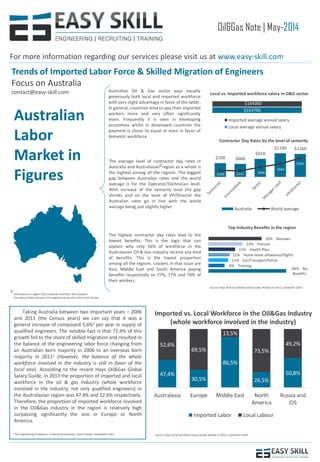
- 1. Oil&Gas Note | May-2014 For more information regarding our services please visit us at www.easy-skill.com Trends of Imported Labor Force & Skilled Migration of Engineers Focus on Australia contact@easy-skill.com 47,4% 30,5% 86,5% 26,5% 50,8% 52,6% 69,5% 13,5% 73,5% 49,2% Australasia Europe Middle East North America Russia and CIS Imported Labor Local Labour Imported vs. Local Workforce in the Oil&Gas Industry (whole workforce involved in the industry) Taking Australia between two important years – 2006 and 2011 (the Census years) we can say that it was a general increase of compound 5,6%1 per year in supply of qualified engineers. The notable fact is that 71.4% of this growth fell to the share of skilled migration and resulted in the balance of the engineering labor force changing from an Australian born majority in 2006 to an overseas born majority in 20111 (However, the balance of the whole workforce involved in the industry is still in favor of the local one). According to the recent Hays Oil&Gas Global Salary Guide, in 2013 the proportion of imported and local workforce in the oil & gas industry (whole workforce involved in the industry, not only qualified engineers) in the Australasian region was 47.4% and 52.6% respectively. Therefore, the proportion of imported workforce involved in the Oil&Gas industry in the region is relatively high surpassing significantly the one in Europe or North America. 1The Engineering Profession: A statistical Overview; Tenth Edition, September 2013 Source: Hays Oil & Gas Global Salary Guide, Review of 2013,outlook for 2014. $163700 $164000 Imported average annual salary Local average annual salary Local vs. Imported workforce salary in O&G sector $700 $660 $910 $1190 $1160 $330 $315 $496 $664 $950 Australia World average Contractor Day Rates by the level of seniority Source: Hays Oil & Gas Global Salary Guide, Review of 2013,outlook for 2014. Australian Oil & Gas sector pays equally generously both local and imported workforce with very slight advantage in favor of the latter. In general, countries tend to pay their imported workers more and very often significantly more. Frequently it is seen in developing economies whilst in developed countries the payment is closer to equal or even in favor of domestic workforce. The average level of contractor day rates in Australia and Australasian region as a whole is the highest among all the regions. The biggest gap between Australian rates and the world average is for the Operator/Technician level. With increase of the seniority level the gap shrinks and on the level of VP/Director the Australian rates go in line with the world average being just slightly higher. The highest contractor day rates lead to the lowest benefits. This is the logic that can explain why only 56% of workforce in the Australasian Oil & Gas industry receive any kind of benefits. This is the lowest proportion among all the regions. Leaders in that issue are Asia, Middle East and South America paying benefits respectively to 77%, 77% and 78% of their workers. Australian Labor Market in Figures 44% No Benefits 9% Training 11% Car/Transport/Petrol 12% Home leave allowance/flights 15% Health Plan 19% Pension 30% Bonuses Top Industry Benefits in the region Australasia is a region that comprises Australia, New Zealand, the island of New Guinea, and neighboring islands in the Pacific Ocean.
- 2. 33,8% 23,1% 14,5% 9,4% 9,2% 7,9% 2,1% 40,0% 27,7% 13,9% 6,4% 3,3% 4,6% 4,2% Skills shortages Economic instability Environmental concerns Safety regulations Security/safety caused by social unrest Immigration/overseas visa program Other Oil&Gas Note | May-2014 © 2014 Easy Skill SAS. All rights reserved. Easy Skill refers to the French firm and the Australian firm. This content is for general information purposes only. Employers’ Concerns in the Current Oil&Gas Employment Market World Australasia Source: Hays Oil& Gas Global Salary Guide, Review of 2013,outlook for 2014. According to the diagrams above it is clear that the absolute leader among the employers’ concerns on the labor market is Skills Shortage. This trend is seen in all the regions but mostly – in Europe, Australasia and North America being significantly above the average. Taking Australasia in particular the Economic Instability is another aspect that raises concerns among the Oil&Gas experts more than the world average. Speaking about the problem of Skills Shortage in Australia we should mention first of all the domestic skills shortage. The increase in number of domestic university graduates who did engineering is very recent and there is not enough of skilled professionals. Again looking back at the period between the two Census years we see that the demand for qualified engineers was growing by compound 5.5% per year with the demand for qualified engineers in engineering occupations growing even more – by 6.0% per year. When we look at the figures of the supply we can see that the flow of new domestic engineering team graduates grew only by an average 1.9% per year. Therefore, the overall compound 5.6% per year growth in supply of qualified engineers was mostly provided by skilled migration (71.4% of the total). The trend seems to be at least saved or changed for even bigger proportion of skilled migration in total supply. The reason – a lot of big and “skilled consuming” projects that are already in process or are about to start, primarily in the LNG sector. Employers will have to overcome the problem of skills shortage by using the processes of permanent and temporary skilled migration. However, this also will be tough as on the international labor market competition for qualified engineers is and will be not much less than on the national one. Source: The Engineering Profession: A StatisticalOverview; Tenth Edition, September 2013. 17,0% 18,9% 27,6% 21,7% 14,8% 12,3% 16,6% 26,4% 24,7% 19,9% Level 1 (2-3) Level 2 (6-8) Level 3 (14-17) Level 4 (21-24) Level 5 (25-27) Average to 2006 2013 Recruiting Difficulties Experienced by Grade Sought in 2013 Compared to the Medium Term Average (Average number of years experience) 6% 32% 48% 15% 2% 21% 52% 25% Risk to the project Major problems Moderate problems Minor issues Average since 2006 2013 The Consequences of Recruiting Difficulties Experienced in 2013 Compared to the Medium Term Average Source: Engineers Australia's Recruitment Difficulties Survey, 2014 Looking at the graph concerning recruiting difficulties by the level of an engineer we can notice a trend that in 2013 the more experienced an engineer was the more difficulties employers faced to find and recruit him comparing to 2006. It can be explained by the fact that over the last 7-8 years the number of young people in Australia enrolled into engineering profession increased a lot (between 2006 and 2011 there was a 38% increase in terms of number of students commencing Engineering & Related Technologies course with the highest leap in 2009). Therefore, the proportion of young professionals grows but the competition for experienced and valuable employees also increase due to the big number of huge and complicated projects which require the best and the most experienced people. In terms of consequences of various recruiting difficulties we can also notice that the tendency in changes in 2013 comparing to the average since 2006 is the opposite. We see a significant decrease in terms of major problems, however minor issues occur much more often. Here it is important to indicate what these major, moderate and minor issues involve. Minor issues – minor irritations but no monetary problems. Moderate problems are problems with some monetary issues. Major problems are the problems that include project delays & costs. Risk to the project – risk to not proceed with available project at all.