Download as PDF, PPTX

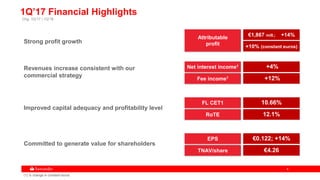
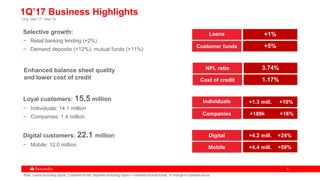
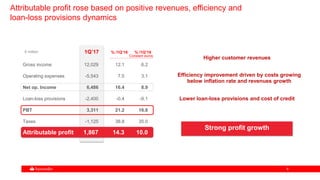
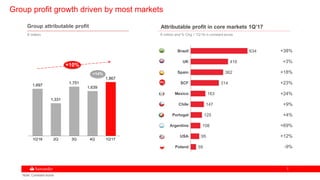
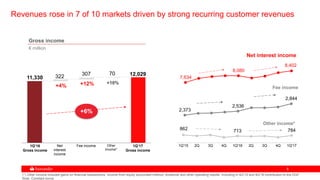
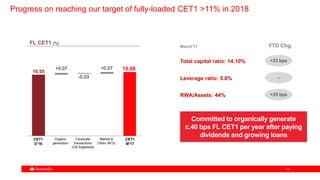
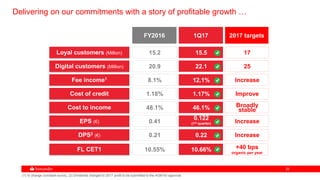
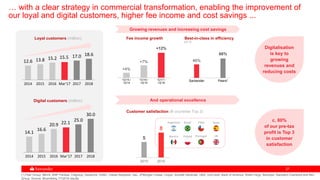
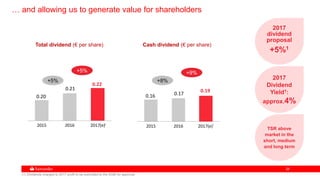


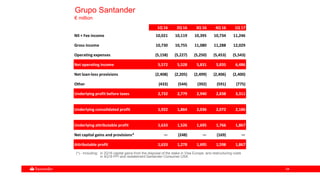
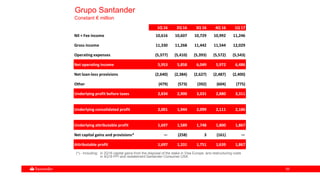


The 1Q17 earnings presentation from Banco Santander outlines significant growth and improved financial performance, with a 14% increase in attributable profit to €1,867 million. The presentation also highlights an increase in revenues, improved capital adequacy with a CET1 ratio of 10.66%, and enhanced customer relationships, particularly in digital banking. Forward-looking statements caution investors about the risks and uncertainties that could affect future results, emphasizing the need for independent judgment when considering security investments.


