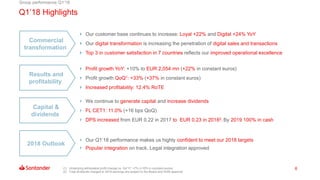
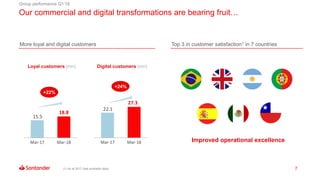
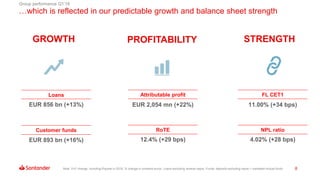
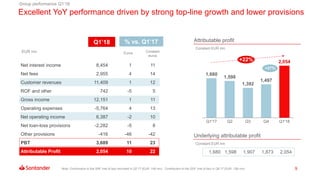
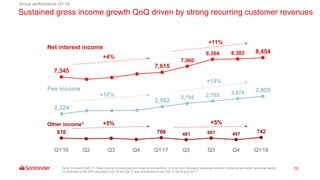
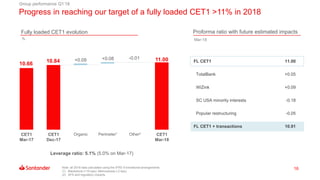
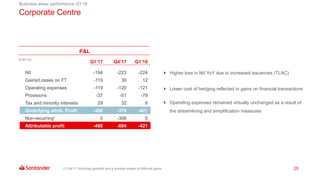
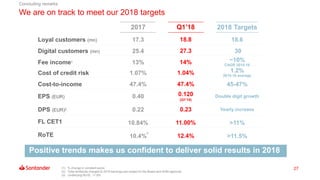
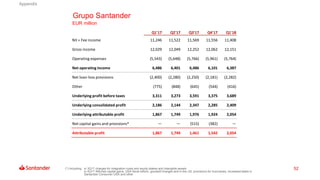
- Santander reported results for Q1 2018 with profits growing 10% year-over-year to EUR 2,054 million, driven by strong performance across most business areas.
- Key highlights included growth in loyal and digital customers, higher net interest income and fees, and lower provisions as asset quality continued to improve.
- Capital levels remained strong with a fully loaded CET1 ratio of 11.0%, positioning Santander well to meet 2018 targets.
Bragg Gaming Group is a next generation gaming group with cutting-edge technology, leading brands and world-class management expertise, developing into a global gaming force. Formed by a team of gaming industry experts, Bragg's main portfolio asset is ORYX Gaming, an innovative business-to-business gaming technology platform and casino content aggregator. Through this brand and targeted acquisitions, Bragg is focused on becoming a leader within the evolving global gaming industry.
Hut 8 is one of North America's largest innovation-focused digital asset miners, supporting open and decentralized systems since 2018. Located in energy rich Alberta, Canada, Hut 8 has one of the highest installed capacity rates in the industry and holds more self-mined Bitcoin than any crypto miner or publicly traded company globally. The recent deal with Validus Power will add up to 100 megawatts (MW) on top of the 109MW currently in production and aligns with the Company’s sustainable mining goals and ESG investor trends. The Company recently purchased $30 million (one-third of total production) of NVIDIA’s cutting-edge cryptocurrency GPU miners to mine Ethereum and participate in profitable decentralized finance opportunities and will start by getting paid out in Bitcoin, and $44 million of MicroBT miners. Given current bitcoin network dynamics, the hashrates from these installations are expected to increase average production from 6.2 – 7.3 Bitcoin per day to 8 – 10 Bitcoin per day.
9M'17 Earnings Presentation
Santander attributable profit for first nine months of 2017 reaches €5,077 million – up 10% after €515 million of one-off items
Earnings Presentation 2016
Banco Santander generated attributable profit of €6,204 million during the year, an increase of 4% compared to 2015, with strong growth in fee income and improvements in credit quality, partially offset by the weakening of certain currencies against the Euro and an increase in tax in both Poland and U.K. Excluding one off items and currency movements, underlying profit before tax increased by 12%.
This is Uber's first investor presentation (for Q4 2019) after going public in 2019.
We're compiling some of the investor presentations for technology start-ups. The purpose is to better understand the business as a point of reference or comparison.
I do not own this deck or any of its contents. The original deck can be found on Uber's Investor Relations webpage as part of its required reporting.
Banco Santander delivered an attributable profit of €1,867 million during the first quarter of 2017, +14% compared to Q1 2016. Excluding currency movements, profit before tax increased by 17% to €3,311 million.
Santander InnoVentures makes its first investment in Brazil via digital lendi...BANCO SANTANDER
Santander InnoVentures, the fintech venture capital fund of Santander Group, announced today an investment in the startup Creditas, the leading Brazilian secured lending platform. This is Santander InnoVentures’ first investment in Brazil and second in Latin America.
Fundación Repsol beca con el apoyo de Fundación Universia a trece universitar...BANCO SANTANDER
Trece estudiantes universitarios, ocho de grado y cinco de máster, han sido seleccionados en la IV Convocatoria de Becas Fundación Repsol destinadas a personas con discapacidad para la realización de estudios superiores en áreas técnicas. Fundación Universia ha colaborado un año más en el proceso de convocatoria y selección de los becados.
Santander recupera la gestión de los cajeros automáticos y de las tarjetas de...BANCO SANTANDER
Santander rehace las alianzas que Banco Popular mantenía con terceras entidades para recuperar la gestión de negocios estratégicos y facilitar la integración, con el foco puesto en la mejora de la experiencia del cliente. La entidad ha alcanzado un acuerdo con Euro Automatic Cash, sociedad propietaria de los cajeros de Popular, que permite a todos los clientes del Grupo Santander (Santander, Popular, Pastor y Openbank) utilizar gratuitamente una red total de 7.500 cajeros en España. Desde octubre, los clientes de Popular ya podían utilizar gratuitamente los cajeros propiedad de Santander, pero aún faltaba por cerrar el acuerdo con esta sociedad, necesario para que los clientes de Santander tuviesen también acceso, sin coste, a la red de cajeros de Popular.
Santander renueva la imagen de marca para reforzar su estrategia digitalBANCO SANTANDER
La presidenta de Banco Santander, Ana Botín, ha presentado hoy en la junta de accionistas la nueva imagen de marca de la entidad, más moderna y adecuada a los canales digitales y el móvil, para adaptarse al nuevo entorno, transmitir mejor la nueva cultura corporativa y reforzar la estrategia de convertirse en una plataforma digital y abierta de servicios financieros, con el objetivo de alcanzar la cifra de 30 millones de clientes digitales en 2018.
Santander InnoVentures invierte en Roostify, una startup que permite formaliz...BANCO SANTANDER
Santander InnoVentures, el fondo de capital emprendedor en tecnología financiera de Grupo Santander, ha anunciado hoy una inversión en Roostify, una empresa emergente con sede en San Francisco (California) que permite digitalizar todo el proceso para formalizar el contrato de una hipoteca, e incluso hacer las gestiones con el móvil. Roostify se fundó en 2014 para acelerar y simplificar la firma de las hipotecas y eliminar el uso de papel, además de reducir costes en el proceso.
Álvaro Antonio Cardoso de Souza to join Banco Santander's board of directorsBANCO SANTANDER
The board of directors of Banco Santander, in a meeting held yesterday in San Francisco (USA), called this year’s Ordinary Shareholders’ Meeting, which is expected to take place on second call on March 23rd. The agenda for the shareholders’ meeting includes the appointment of Álvaro Antonio Cardoso de Souza as an independent member of the board. He is currently non-executive chairman of the board of Santander Brasil.
Álvaro Antonio Cardoso de Souza se incorporará al consejo de administración d...BANCO SANTANDER
El consejo de administración de Banco Santander, reunido ayer en San Francisco (Estados Unidos), ha convocado la próxima Junta General Ordinaria de Accionistas, que previsiblemente se celebrará el 23 de marzo en segunda convocatoria. El orden del día de la Junta prevé el nombramiento como consejero independiente de Álvaro Antonio Cardoso de Souza, actual presidente no ejecutivo del consejo de administración de Santander Brasil.
Más de 20.000 personas en situación de vulnerabilidad reciben el apoyo de Ban...BANCO SANTANDER
En línea con su misión de contribuir al progreso de las personas, las empresas y la sociedad, Banco Santander ha contribuido durante 2017 a la mejora de la calidad de vida de más de 20.000 personas en situación de vulnerabilidad mediante su Programa Santander Ayuda, que promueve a través de la Fundación Banco Santander.
O santander obtém um lucro atribuído de 6.619 milhões de euros em 2017, uma s...BANCO SANTANDER
O Banco Santander S.A. (‘Santander’) obteve um lucro atribuído de 6.619 milhões de euros em 2017, representando um aumento de 7% face ao ano anterior, após registrar um encargo líquido de mais-valias e saneamentos de 897 milhões. O crescimento dos resultados reflete a qualidade e recorrência das receitas, o bom controle de custos e as melhorias na qualidade de crédito.
O Santander registrou tendências positivas nos negócios, com aumentos das receitas em oito dos seus dez mercados principais. As receitas totais subiram 10%, para 48.392 milhões de euros, com crescimentos da margem de juros e das receitas por comissões de 10% e 14%, respectivamente. Os custos de exploração aumentaram a um ritmo menor do que as receitas, permitindo um incremento da margem líquida de 12%.
Santander attributable profit for 2017 reaches 6,619 million euros - up 7%BANCO SANTANDER
Banco Santander S.A. (‘Santander’) increased attributable profit by 7% to €6,619 million during 2017 after €897 million of net capital gains and provisions, with growth driven by further improvements in the quality and recurrence of revenues combined with good cost control and an overall strengthening in credit quality. The Group continued to see positive trends across its businesses, with revenues increasing in eight of its ten core markets. Total income increased by 10% to €48.4 billion with net interest income and fee income increasing by 10% and 14% respectively. Operating expenses increased at a lower rate than revenues, leading to a 12% increase in net operating income.
Resultados 2017 Santander obtiene un beneficio atribuido de 6.619 millones de...BANCO SANTANDER
Banco Santander S.A. (‘Santander’) obtuvo un beneficio atribuido de 6.619 millones de euros en 2017, lo que supone un aumento del 7% respecto al año pasado, tras registrar un cargo neto de plusvalías y saneamientos de 897 millones. El crecimiento de los resultados refleja la calidad y recurrencia de los ingresos, el buen control de costes y las mejoras en la calidad crediticia. Santander registró tendencias positivas en los negocios, con incrementos de los ingresos en ocho de sus diez mercados principales. Los ingresos totales subieron un 10%, 48.392 millones de euros, con crecimientos del margen de intereses y de los ingresos por comisiones del 10% y del 14%, respectivamente. Los costes de explotación aumentaron a un ritmo menor que los ingresos, lo que permitió un incremento del margen neto del 12%.
Santander lanza la primera gama de fondos de inversión sostenibles en EspañaBANCO SANTANDER
Banco Santander incorpora a su oferta de productos de inversión colectiva una gama nueva de fondos para responder a la demanda creciente de inversión responsable y sostenible. El banco lanza esta semana dos nuevos fondos mixtos, bajo la gama Santander Sostenible, e inicia así un camino para convertirse en una referencia en España en este ámbito.
Banco Santander, líder mundial en el Bloomberg Gender Equality IndexBANCO SANTANDER
Banco Santander se mantiene un año más su presencia en el Bloomberg Gender-Equality Index (GEI), índice de referencia en el ámbito internacional que valora las políticas e iniciativas de las empresas en el fomento de la diversidad, entre sus empleados, clientes y sociedad.Con una valoración total de 93,4 puntos sobre 100, Banco Santander ocupa el primer puesto en este índice de un total de 104 entidades participantes de diferentes sectores (finanzas, comunicación, energía, bienes de primera necesidad, materiales, tecnología, etc…)
El programa Explorer impulsará las ideas de más de 1.200 jóvenes emprendedore...BANCO SANTANDER
Esta semana ha comenzado la actividad en los 52 Explorer Spaces distribuidos por toda España y Portugal en el marco del programa Explorer ‘Jóvenes con ideas’, impulsado por Banco Santander a través de Santander Universidades y coordinado por el Centro Internacional Santander Emprendimiento (CISE). El Explorer Space que el programa posee en la Universidad de Buenos Aires, Argentina, iniciará las sesiones en marzo.
Santander y su filial Bank Zachodni WBK adquieren el negocio de banca minoris...BANCO SANTANDER
Banco Santander S.A. (“Santander”) y su filial en Polonia, Bank Zachodni WBK (“BZ WBK”), han anunciado hoy que han acordado la compra del negocio minorista y de banca privada de Deutsche Bank Polska, S.A. (excluyendo su cartera de hipotecas en divisa extranjera e incluyendo las acciones de DB Securities, S.A. (Poland)) por un importe total estimado de 305 millones de euros.
Santander, Crue y CEPYME convocan 5.000 becas de prácticas profesionales remu...BANCO SANTANDER
La presidenta de Banco Santander, Ana Botín, el presidente de Crue Universidades Españolas, Roberto Fernández, y el presidente de la Confederación Española de la Pequeña y Mediana Empresa (CEPYME), Antonio Garamendi, han firmado un acuerdo para desarrollar la séptima convocatoria de las ‘Becas Santander-Crue-CEPYME Prácticas en Empresa’.
What price will pi network be listed on exchangesDOT TECH
The rate at which pi will be listed is practically unknown. But due to speculations surrounding it the predicted rate is tends to be from 30$ — 50$.
So if you are interested in selling your pi network coins at a high rate tho. Or you can't wait till the mainnet launch in 2026. You can easily trade your pi coins with a merchant.
A merchant is someone who buys pi coins from miners and resell them to Investors looking forward to hold massive quantities till mainnet launch.
I will leave the telegram contact of my personal pi vendor to trade with.
@Pi_vendor_247
Even tho Pi network is not listed on any exchange yet.
Buying/Selling or investing in pi network coins is highly possible through the help of vendors. You can buy from vendors[ buy directly from the pi network miners and resell it]. I will leave the telegram contact of my personal vendor.
@Pi_vendor_247
how to swap pi coins to foreign currency withdrawable.DOT TECH
As of my last update, Pi is still in the testing phase and is not tradable on any exchanges.
However, Pi Network has announced plans to launch its Testnet and Mainnet in the future, which may include listing Pi on exchanges.
The current method for selling pi coins involves exchanging them with a pi vendor who purchases pi coins for investment reasons.
If you want to sell your pi coins, reach out to a pi vendor and sell them to anyone looking to sell pi coins from any country around the globe.
Below is the contact information for my personal pi vendor.
Telegram: @Pi_vendor_247
Falcon stands out as a top-tier P2P Invoice Discounting platform in India, bridging esteemed blue-chip companies and eager investors. Our goal is to transform the investment landscape in India by establishing a comprehensive destination for borrowers and investors with diverse profiles and needs, all while minimizing risk. What sets Falcon apart is the elimination of intermediaries such as commercial banks and depository institutions, allowing investors to enjoy higher yields.
what is the future of Pi Network currency.DOT TECH
The future of the Pi cryptocurrency is uncertain, and its success will depend on several factors. Pi is a relatively new cryptocurrency that aims to be user-friendly and accessible to a wide audience. Here are a few key considerations for its future:
Message: @Pi_vendor_247 on telegram if u want to sell PI COINS.
1. Mainnet Launch: As of my last knowledge update in January 2022, Pi was still in the testnet phase. Its success will depend on a successful transition to a mainnet, where actual transactions can take place.
2. User Adoption: Pi's success will be closely tied to user adoption. The more users who join the network and actively participate, the stronger the ecosystem can become.
3. Utility and Use Cases: For a cryptocurrency to thrive, it must offer utility and practical use cases. The Pi team has talked about various applications, including peer-to-peer transactions, smart contracts, and more. The development and implementation of these features will be essential.
4. Regulatory Environment: The regulatory environment for cryptocurrencies is evolving globally. How Pi navigates and complies with regulations in various jurisdictions will significantly impact its future.
5. Technology Development: The Pi network must continue to develop and improve its technology, security, and scalability to compete with established cryptocurrencies.
6. Community Engagement: The Pi community plays a critical role in its future. Engaged users can help build trust and grow the network.
7. Monetization and Sustainability: The Pi team's monetization strategy, such as fees, partnerships, or other revenue sources, will affect its long-term sustainability.
It's essential to approach Pi or any new cryptocurrency with caution and conduct due diligence. Cryptocurrency investments involve risks, and potential rewards can be uncertain. The success and future of Pi will depend on the collective efforts of its team, community, and the broader cryptocurrency market dynamics. It's advisable to stay updated on Pi's development and follow any updates from the official Pi Network website or announcements from the team.
Introduction to Indian Financial System ()Avanish Goel
The financial system of a country is an important tool for economic development of the country, as it helps in creation of wealth by linking savings with investments.
It facilitates the flow of funds form the households (savers) to business firms (investors) to aid in wealth creation and development of both the parties
NO1 Uk Rohani Baba In Karachi Bangali Baba Karachi Online Amil Baba WorldWide...Amil baba
Contact with Dawood Bhai Just call on +92322-6382012 and we'll help you. We'll solve all your problems within 12 to 24 hours and with 101% guarantee and with astrology systematic. If you want to take any personal or professional advice then also you can call us on +92322-6382012 , ONLINE LOVE PROBLEM & Other all types of Daily Life Problem's.Then CALL or WHATSAPP us on +92322-6382012 and Get all these problems solutions here by Amil Baba DAWOOD BANGALI
#vashikaranspecialist #astrologer #palmistry #amliyaat #taweez #manpasandshadi #horoscope #spiritual #lovelife #lovespell #marriagespell#aamilbabainpakistan #amilbabainkarachi #powerfullblackmagicspell #kalajadumantarspecialist #realamilbaba #AmilbabainPakistan #astrologerincanada #astrologerindubai #lovespellsmaster #kalajaduspecialist #lovespellsthatwork #aamilbabainlahore#blackmagicformarriage #aamilbaba #kalajadu #kalailam #taweez #wazifaexpert #jadumantar #vashikaranspecialist #astrologer #palmistry #amliyaat #taweez #manpasandshadi #horoscope #spiritual #lovelife #lovespell #marriagespell#aamilbabainpakistan #amilbabainkarachi #powerfullblackmagicspell #kalajadumantarspecialist #realamilbaba #AmilbabainPakistan #astrologerincanada #astrologerindubai #lovespellsmaster #kalajaduspecialist #lovespellsthatwork #aamilbabainlahore #blackmagicforlove #blackmagicformarriage #aamilbaba #kalajadu #kalailam #taweez #wazifaexpert #jadumantar #vashikaranspecialist #astrologer #palmistry #amliyaat #taweez #manpasandshadi #horoscope #spiritual #lovelife #lovespell #marriagespell#aamilbabainpakistan #amilbabainkarachi #powerfullblackmagicspell #kalajadumantarspecialist #realamilbaba #AmilbabainPakistan #astrologerincanada #astrologerindubai #lovespellsmaster #kalajaduspecialist #lovespellsthatwork #aamilbabainlahore #Amilbabainuk #amilbabainspain #amilbabaindubai #Amilbabainnorway #amilbabainkrachi #amilbabainlahore #amilbabaingujranwalan #amilbabainislamabad
how to sell pi coins in South Korea profitably.DOT TECH
Yes. You can sell your pi network coins in South Korea or any other country, by finding a verified pi merchant
What is a verified pi merchant?
Since pi network is not launched yet on any exchange, the only way you can sell pi coins is by selling to a verified pi merchant, and this is because pi network is not launched yet on any exchange and no pre-sale or ico offerings Is done on pi.
Since there is no pre-sale, the only way exchanges can get pi is by buying from miners. So a pi merchant facilitates these transactions by acting as a bridge for both transactions.
How can i find a pi vendor/merchant?
Well for those who haven't traded with a pi merchant or who don't already have one. I will leave the telegram id of my personal pi merchant who i trade pi with.
Tele gram: @Pi_vendor_247
#pi #sell #nigeria #pinetwork #picoins #sellpi #Nigerian #tradepi #pinetworkcoins #sellmypi
how can I sell pi coins after successfully completing KYCDOT TECH
Pi coins is not launched yet in any exchange 💱 this means it's not swappable, the current pi displaying on coin market cap is the iou version of pi. And you can learn all about that on my previous post.
RIGHT NOW THE ONLY WAY you can sell pi coins is through verified pi merchants. A pi merchant is someone who buys pi coins and resell them to exchanges and crypto whales. Looking forward to hold massive quantities of pi coins before the mainnet launch.
This is because pi network is not doing any pre-sale or ico offerings, the only way to get my coins is from buying from miners. So a merchant facilitates the transactions between the miners and these exchanges holding pi.
I and my friends has sold more than 6000 pi coins successfully with this method. I will be happy to share the contact of my personal pi merchant. The one i trade with, if you have your own merchant you can trade with them. For those who are new.
Message: @Pi_vendor_247 on telegram.
I wouldn't advise you selling all percentage of the pi coins. Leave at least a before so its a win win during open mainnet. Have a nice day pioneers ♥️
#kyc #mainnet #picoins #pi #sellpi #piwallet
#pinetwork
Resume
• Real GDP growth slowed down due to problems with access to electricity caused by the destruction of manoeuvrable electricity generation by Russian drones and missiles.
• Exports and imports continued growing due to better logistics through the Ukrainian sea corridor and road. Polish farmers and drivers stopped blocking borders at the end of April.
• In April, both the Tax and Customs Services over-executed the revenue plan. Moreover, the NBU transferred twice the planned profit to the budget.
• The European side approved the Ukraine Plan, which the government adopted to determine indicators for the Ukraine Facility. That approval will allow Ukraine to receive a EUR 1.9 bn loan from the EU in May. At the same time, the EU provided Ukraine with a EUR 1.5 bn loan in April, as the government fulfilled five indicators under the Ukraine Plan.
• The USA has finally approved an aid package for Ukraine, which includes USD 7.8 bn of budget support; however, the conditions and timing of the assistance are still unknown.
• As in March, annual consumer inflation amounted to 3.2% yoy in April.
• At the April monetary policy meeting, the NBU again reduced the key policy rate from 14.5% to 13.5% per annum.
• Over the past four weeks, the hryvnia exchange rate has stabilized in the UAH 39-40 per USD range.
USDA Loans in California: A Comprehensive Overview.pptxmarketing367770
USDA Loans in California: A Comprehensive Overview
If you're dreaming of owning a home in California's rural or suburban areas, a USDA loan might be the perfect solution. The U.S. Department of Agriculture (USDA) offers these loans to help low-to-moderate-income individuals and families achieve homeownership.
Key Features of USDA Loans:
Zero Down Payment: USDA loans require no down payment, making homeownership more accessible.
Competitive Interest Rates: These loans often come with lower interest rates compared to conventional loans.
Flexible Credit Requirements: USDA loans have more lenient credit score requirements, helping those with less-than-perfect credit.
Guaranteed Loan Program: The USDA guarantees a portion of the loan, reducing risk for lenders and expanding borrowing options.
Eligibility Criteria:
Location: The property must be located in a USDA-designated rural or suburban area. Many areas in California qualify.
Income Limits: Applicants must meet income guidelines, which vary by region and household size.
Primary Residence: The home must be used as the borrower's primary residence.
Application Process:
Find a USDA-Approved Lender: Not all lenders offer USDA loans, so it's essential to choose one approved by the USDA.
Pre-Qualification: Determine your eligibility and the amount you can borrow.
Property Search: Look for properties in eligible rural or suburban areas.
Loan Application: Submit your application, including financial and personal information.
Processing and Approval: The lender and USDA will review your application. If approved, you can proceed to closing.
USDA loans are an excellent option for those looking to buy a home in California's rural and suburban areas. With no down payment and flexible requirements, these loans make homeownership more attainable for many families. Explore your eligibility today and take the first step toward owning your dream home.
how to sell pi coins effectively (from 50 - 100k pi)DOT TECH
Anywhere in the world, including Africa, America, and Europe, you can sell Pi Network Coins online and receive cash through online payment options.
Pi has not yet been launched on any exchange because we are currently using the confined Mainnet. The planned launch date for Pi is June 28, 2026.
Reselling to investors who want to hold until the mainnet launch in 2026 is currently the sole way to sell.
Consequently, right now. All you need to do is select the right pi network provider.
Who is a pi merchant?
An individual who buys coins from miners on the pi network and resells them to investors hoping to hang onto them until the mainnet is launched is known as a pi merchant.
debuts.
I'll provide you the Telegram username
@Pi_vendor_247
when will pi network coin be available on crypto exchange.DOT TECH
There is no set date for when Pi coins will enter the market.
However, the developers are working hard to get them released as soon as possible.
Once they are available, users will be able to exchange other cryptocurrencies for Pi coins on designated exchanges.
But for now the only way to sell your pi coins is through verified pi vendor.
Here is the telegram contact of my personal pi vendor
@Pi_vendor_247
Empowering the Unbanked: The Vital Role of NBFCs in Promoting Financial Inclu...Vighnesh Shashtri
In India, financial inclusion remains a critical challenge, with a significant portion of the population still unbanked. Non-Banking Financial Companies (NBFCs) have emerged as key players in bridging this gap by providing financial services to those often overlooked by traditional banking institutions. This article delves into how NBFCs are fostering financial inclusion and empowering the unbanked.
2. 2
Banco Santander, S.A. ("Santander") cautions that this presentation contains statements that constitute “forward-looking statements” within the meaning of the U.S. Private
Securities Litigation Reform Act of 1995. Forward-looking statements may be identified by words such as “expect”, “project”, “anticipate”, “should”, “intend”, “probability”, “risk”,
“VaR”, “RORAC”, “RoRWA”, “TNAV”, “target”, “goal”, “objective”, “estimate”, “future” and similar expressions. These forward-looking statements are found in various places
throughout this presentation and include, without limitation, statements concerning our future business development and economic performance and our shareholder remuneration
policy. While these forward-looking statements represent our judgment and future expectations concerning the development of our business, a number of risks, uncertainties and
other important factors could cause actual developments and results to differ materially from our expectations. These factors include, but are not limited to: (1) general market,
macro-economic, industry, governmental and regulatory trends; (2) movements in local and international securities markets, currency exchange rates and interest rates; (3)
competitive pressures; (4) technological developments; and (5) changes in the financial position or credit worthiness of our customers, obligors and counterparties. Numerous
factors, including those reflected in the Annual Report on Form 20-F filed with the Securities and Exchange Commission of the United States of America (the “SEC”) –under “Key
Information-Risk Factors”- and in the Documento de Registro de Acciones filed with the Spanish Securities Market Commission (the “CNMV”) –under “Factores de Riesgo”- could
affect the future results of Santander and could result in other results deviating materially from those anticipated in the forward-looking statements. Other unknown or unpredictable
factors could cause actual results to differ materially from those in the forward-looking statements.
Forward-looking statements speak only as of the date of this presentation and are based on the knowledge, information available and views taken on such date; such knowledge,
information and views may change at any time. Santander does not undertake any obligation to update or revise any forward-looking statement, whether as a result of new
information, future events or otherwise.
The information contained in this presentation is subject to, and must be read in conjunction with, all other publicly available information, including, where relevant any fuller
disclosure document published by Santander. Any person at any time acquiring securities must do so only on the basis of such person's own judgment as to the merits or the
suitability of the securities for its purpose and only on such information as is contained in such public information having taken all such professional or other advice as it considers
necessary or appropriate in the circumstances and not in reliance on the information contained in this presentation. No investment activity should be undertaken on the basis of the
information contained in this presentation. In making this presentation available, Santander gives no advice and makes no recommendation to buy, sell or otherwise deal in shares
in Santander or in any other securities or investments whatsoever.
Neither this presentation nor any of the information contained therein constitutes an offer to sell or the solicitation of an offer to buy any securities. No offering of securities shall be
made in the United States except pursuant to registration under the U.S. Securities Act of 1933, as amended, or an exemption therefrom. Nothing contained in this presentation is
intended to constitute an invitation or inducement to engage in investment activity for the purposes of the prohibition on financial promotion in the U.K. Financial Services and
Markets Act 2000.
Note: Statements as to historical performance or financial accretion are not intended to mean that future performance, share price or future earnings (including earnings per share)
for any period will necessarily match or exceed those of any prior year. Nothing in this presentation should be construed as a profit forecast.
The businesses included in each of our geographic segments and the accounting principles under which their results are presented here may differ from the included businesses
and local applicable accounting principles of our public subsidiaries in such geographies. Accordingly, the results of operations and trends shown for our geographic segments may
differ materially from those of such subsidiaries.
Important Information
3. 3
Important Information
In addition to the financial information prepared under International Financial Reporting Standards (“IFRS”), this presentation includes certain alternative performance measures as
defined in the Guidelines on Alternative Performance Measures issued by the European Securities and Markets Authority on 5 October 2015 (ESMA/2015/1415es) as well as Non-
IFRS measures. The APMs and Non-IFRS Measures are performance measures that have been calculated using the financial information from the Santander Group but that are
not defined or detailed in the applicable financial information framework and therefore have neither been audited nor are capable of being completely audited. These APMs and
Non-IFRS Measures are been used to allow for a better understanding of the financial performance of the Santander Group but should be considered only as additional information
and in no case as a replacement of the financial information prepared under IFRS. Moreover, the way the Santander Group defines and calculates these APMs and Non-IFRS
Measures may differ to the way these are calculated by other companies that use similar measures, and therefore they may not be comparable. For further details of the APMs and
Non-IFRS Measures used, including its definition or a reconciliation between any applicable management indicators and the financial data presented in the consolidated financial
statements prepared under IFR, see Section 26 of the Documento de Registro de Acciones for Banco Santander filed with the CNMV on 4 July 2017 (available on the web page of
the CNMV -www.cnmv.es- and at Banco Santander -www.santander.com), Item 3A of the Annual Report on Form 20-F for the year ended 31 December 2017, filed with the U.S.
Securities and Exchange Commission on 28 March 2018 (the “Form 20-F”) and section Alternative Performance Measures of the Financial Report for the first quarter of 2018
(available at Banco Santander –www.santander.com). For a discussion of the accounting principles used in translation of foreign currency-denominated assets and liabilities to
euros, see note 2(a) to our consolidated financial statements included in our Annual Report for 2017 available on the CNMV’s website (www.cnmv.es) and on Banco Santander’s
website (www.santander.com) and also included in our annual report on Form 20-F
4. 4
1. Group performance Q1’18
2. Business areas performance Q1’18
3. Concluding remarks
4. Appendix
5. Glossary
Index
6. 6
Q1’18 Highlights
(1) Underlying attributable profit change vs. Q4’17: +7% (+10% in constant euros)
(2) Total dividends charged to 2018 earnings are subject to the Board and AGM approval
Our customer base continues to increase: Loyal +22% and Digital +24% YoY
Our digital transformation is increasing the penetration of digital sales and transactions
Top 3 in customer satisfaction in 7 countries reflects our improved operational excellence
Profit growth YoY: +10% to EUR 2,054 mn (+22% in constant euros)
Profit growth QoQ1: +33% (+37% in constant euros)
Increased profitability: 12.4% RoTE
We continue to generate capital and increase dividends
FL CET1: 11.0% (+16 bps QoQ)
DPS increased from EUR 0.22 in 2017 to EUR 0.23 in 20182. By 2019 100% in cash
Our Q1’18 performance makes us highly confident to meet our 2018 targets
Popular integration on track. Legal integration approved
Commercial
transformation
Capital &
dividends
Results and
profitability
2018 Outlook
Group performance Q1’18
7. 7
Digital customers (mn)
22.1
27.3
Mar-17 Mar-18
+24%
Our commercial and digital transformations are bearing fruit…
More loyal and digital customers
Group performance Q1’18
Improved operational excellence
15.5
18.8
Mar-17 Mar-18
+22%
Loyal customers (mn)
Top 3 in customer satisfaction1 in 7 countries
(1) As at 2017 (last available data)
8. 8
…which is reflected in our predictable growth and balance sheet strength
GROWTH PROFITABILITY STRENGTH
Note: YoY change, including Popular in 2018. % change in constant euros. Loans excluding reverse repos. Funds: deposits excluding repos + marketed mutual funds
Group performance Q1’18
EUR 856 bn (+13%)
EUR 893 bn (+16%)
Loans
Customer funds
12.4% (+29 bps)
EUR 2,054 mn (+22%)
Attributable profit
RoTE
4.02% (+28 bps)
11.00% (+34 bps)
FL CET1
NPL ratio
9. 9
Excellent YoY performance driven by strong top-line growth and lower provisions
Group performance Q1’18
Net interest income 8,454 1 11
Net fees 2,955 4 14
Customer revenues 11,409 1 12
ROF and other 742 -5 5
Gross income 12,151 1 11
Operating expenses -5,764 4 13
Net operating income 6,387 -2 10
Net loan-loss provisions -2,282 -5 8
Other provisions -416 -46 -42
PBT 3,689 11 23
Attributable Profit 2,054 10 22
EUR mn Constant
euros
Euros
Q1’18 % vs. Q1’17
Note: Contribution to the SRF (net of tax) recorded in Q2’17 (EUR -146 mn). Contribution to the DGF (net of tax) in Q4’17 (EUR -186 mn)
Attributable profit
Constant EUR mn
Q1'17 Q2 Q3 Q4 Q1'18
1,680
1,598
1,392
1,497
2,054
+37%
+22%
1,680 1,598 1,907 1,873 2,054
Underlying attributable profit
Constant EUR mn
10. 10
670 706 481 667 497 742
Q1'16 Q2 Q3 Q4 Q1'17 Q2 Q3 Q4 Q1'18
Sustained gross income growth QoQ driven by strong recurring customer revenues
Group performance Q1’18
2,324
2,582
2,705 2,785 2,870 2,955
7,345
7,615
7,960
8,364 8,382 8,454
Note: Constant EUR. (1) Other income includes gains on financial transactions, income from the equity accounted method, dividends and other operating results.
Contribution to the SRF recorded in Q2’16 and Q2’17 and contribution to the DGF in Q4’16 and Q4’17
Net interest income
Fee income
Other income1
+4%
+11%
+12%
+14%
+5% +5%
11. 11
Higher NII due to increased business volumes and margin management
Note: YoY change in constant euros
Group performance Q1’18
Net interest
income
+11%
Mature
markets
+7%
Developing
markets
+16%
Organic growth + perimeter Lower rates
+14% +16% -12 bps
Loans Customer funds NIM
Organic growth Margin improvement
+10% +18% +50 bps
Loans Customer funds NIM
12. 12
1,362
1,567
Mar-17 Mar-18
Higher fee income driven by rise in loyal customers, increased activity and
commercialisation of value added products and services
Note: YoY change. % change in constant euros.
Group performance Q1’18
mutual funds
balances
+19%
Total fee income by geography
+14%
Mature
markets
Developing
markets
+16%
Total fee income by segment
+11%
Retail
Banking
Wealth
Management
+66%
GCB +9%
Activity growth
cards turnover
+13%
insurance premium
+10%
Loyal customers growth
Companies (k)
+15%
14.1
17.2
Mar-17 Mar-18
+22%
Individuals (mn)
13. 13
Higher costs due to commercial transformation and digitalisation investments,
with optimisation measures not yet fully feeding through to synergies
Cost-to-income impacted by integrations
Group performance Q1’18
Top 3 in customer satisfaction3 in 7 countries
Note: Constant euros. (1) Spain and Portugal including Popular
(2) Excluding inflation and perimeter
(3) As at 2017 (last available data)
5.6 2.2
8.4 4.3
2.1 0.7
43.5 1.8
13.6 6.6
3.7 0.7
14.3 -3.5
1.4 -0.8
43.0 5.4
1.9 0.0
1.3 -0.2
Nominal1 In real terms2
Active cost management
Q1'18 vs. Q1'17, %
46.1% 47.4% 47.4%
Q1'17 2017 Q1'18
14. 14
Lower cost of credit with some impact from the initial application of IFRS 9 in Q1’18
Group NPL and coverage ratio improvingBetter cost of credit at Group level
1.17%
1.04%
Q1'17 Q1'18
3.74
5.37
4.24 4.08 4.02
Mar-17 Jun-17 Sep-17 Dec-17 Mar-18
Group performance Q1’18
(1) Banco Popular integration; (2) IFRS 9 application
NPL ratio (%)
75
68 66 65
70
Coverage ratio (%)
21
15. 15
41.1
5.2
30.7
5.2
Real estate exposure reduction strategy
Group performance Q1’18
(1) Spain Real Estate activity
Following the acquisition of Banco Popular, we announced our
intention to reduce Grupo Santander’s NPE
Agreement with Blackstone was completed in March 2018
according to plan:
No material impact on results
Positive impact of 10 bps on the CET1 capital ratio
As a result of this operation the Spain Real Estate unit has an
exposure of EUR 5.2 billion
Gross
value
Jun-17
Blackstone
transaction
and other
Provisions
EUR bn
Real estate exposure1
Net
value
Mar-18
Mar-18
EUR bn
Net value
Real estate assets 4.0
Foreclosed assets 2.8
Rental assets 1.2
RE non-performing loans (NPLs) 1.2
RE assets + RE non-performing loans 5.2
We will continue reducing this exposure
in the coming quarters
16. 16
Progress in reaching our target of a fully loaded CET1 >11% in 2018
Fully loaded CET1 evolution
Leverage ratio: 5.1% (5.0% on Mar-17)
Proforma ratio with future estimated impacts
10.66 10.84 11.00+0.09 +0.08 -0.01
CET1
Mar-17
Organic Other2Perimeter1
CET1
Mar-18
CET1
Dec-17
Note: all 2018 data calculated using the IFRS 9 transitional arrangements
(1) Blackstone (+10 bps); Metrovacesa (-2 bps)
(2) AFS and regulatory impacts
Group performance Q1’18
%
FL CET1 11.00
TotalBank +0.05
WiZink +0.09
SC USA minority interests -0.18
Popular restructuring -0.05
FL CET1 + transactions 10.91
Mar-18
17. 17
Delivering on our commitments: positive performance of main ratios
Group performance Q1’18
RoTE (%)RoRWA (%)
EPS1 (EUR)
Q1'17 Q4'17 Q1'18
1.48 1.44
1.59
Q1'17 Q4'17 Q1'18
12.1
11.2
12.4
Q1'17 Q4'17 Q1'18
0.120
0.088
0.120
TNAV per share1 (EUR)
Mar-17 Dec-17 Mar-18
4.19 4.15 4.12
(1) Q1’17 metrics have been restated to reflect the July 2017 capital increase
Mar-18 excluding
IFRS 9 impact
EUR 4.20
FY 2018 target
Double digit
growth
19. 19
Group profit growth driven by most markets
(1) Excluding Corporate Centre and Real Estate Activity Spain
Q1’18 Attributable profit in core markets
EUR mn and % change vs. Q1’17 in constant euros
+27%
-21%
+14%
+8%
+1%
+52%
-11%
+3%
+26%
+4%
677
455
323
320
175
151
127
125
66
63
Q1’18 Attributable profit1
51%
UK, 13%
Spain;
18%
SCF, 13%
Portugal, 5%
Poland,
2%
USA,
5%
Mexico,
7%
Brazil,
27%
Chile, 6%
Argentina, 3%
Other Latam, 1%
EuropeAmericas
49%
Business areas performance Q1’18
20. 20
16.56% 16.29% 15.92% 15.41% 15.64%
8.16%
6.81% 6.42%
5.59% 5.02%
Q1'17 Q2 Q3 Q4 Q1'18
Brazil
(1) EUR mn and % change in constant euros
P&L1 Q1'18 %Q4'17 %Q1'17
Cost of deposits
Yield on loans
Loyal customers (millions) 3.7 4.6
Digital customers (millions) 6.9 9.1
NPL ratio (%) 5.36 5.26
Cost of credit (%) 4.84 4.35
Efficiency ratio (%) 35.4 33.8
RoTE (%) 16.5 19.9
Volumes in EUR bn
Note: % change in constant euros. Loans excluding reverse repos. Funds: deposits excluding repos + marketed mutual funds
Customer base and user experience (NPS) continue to be the primary
driving forces behind our results, contributing to profit and RoTE (20%)
Positive top line trends underscoring revenue recurrence: NII (higher
volumes and spreads) and fee income (greater transactionality and loyalty)
Controlled costs and increased productivity
Loans still growing above market average, while cost of credit improves.
Controlled levels of LLPs and NPLs due to our risk model resilience
74
110
Loans Funds
+3%
QoQ
+11%
YoY
+6%
QoQ
+28%
YoY
NII 2,482 2.9 17.3
Fee income 920 4.1 17.5
Gross income 3,445 2.8 10.4
Operating expenses -1,165 -5.1 5.6
LLPs -822 5.5 7.6
PBT 1,304 14.5 37.0
Attributable profit 677 10.7 27.3
Business areas performance Q1’18
KEY DATA Q1’17 Q1’18
ACTIVITY
21. 21
2.02% 1.97% 2.03% 2.03% 1.96%
0.46% 0.44% 0.42% 0.41% 0.35%
Q1'17 Q2 Q3 Q4 Q1'18
Spain
Loyal customers (millions) 1.4 2.4
Digital customers (millions) 2.8 4.1
NPL ratio (%) 5.22 6.27
Cost of credit (%) 0.33 0.29
Efficiency ratio (%) 51.8 55.5
RoTE (%) 12.7 11.1
Cost of deposits
Yield on loans
217
313
Loans Funds
+44%
YoY
+38%
YoY
-1%
QoQ
-1%
QoQ
Note: Loans excluding reverse repos. Funds: deposits excluding repos + marketed mutual funds
Business areas performance Q1’18
Volumes in EUR bn
(1) EUR mn
P&L1 Q1'18 %Q4'17 %Q1'17
NII 1,037 -2.9 38.9
Fee income 673 -1.2 46.5
Gross income 2,063 12.4 34.1
Operating expenses -1,145 -3.6 43.5
LLPs -207 18.1 26.8
PBT 608 36.0 18.4
Attributable profit 455 37.6 25.7
KEY DATA Q1’17 Q1’18
ACTIVITY
Includes Popular in Q1’18 and in Q4’17. Integration on track as scheduled
Offering joint commercial initiatives: Launch of 1|2|3 Profesional (75k
accounts since its launch in March)
Volumes hit by outflows in large companies and institutions
Positive trends in commercial revenues with an improvement in the cost of
credit. Costs reflect the incorporation of less efficient business
QoQ: Drop in NII due to lower volumes and ALCO portfolio sales in Q4.
Seasonal increase in provisions
22. 22
Active customers (millions) 19.5 19.4
NPL ratio (%) 2.62 2.48
Cost of credit (%) 0.39 0.36
Efficiency ratio (%) 44.9 44.6
RoTE (%) 17.1 16.6
Yield on loans
4.75% 4.74% 4.66% 4.61% 4.60%
Q1'17 Q2 Q3 Q4 Q1'18
High diversification and leadership in Europe
Increased new lending in almost all geographies: auto loans (+12%) and
credit cards (+12%)
Best-in-class profitability: profit up, boosted by higher NII, cost control and
historically low NPLs and cost of credit
Main contribution to profit: Germany (EUR 77 mn), Spain (EUR 68 mn) and
Nordic countries (EUR 56 mn)
Germany commercial network integration on track as scheduled
10
New lending
Q1'18
92
Loans
0%
QoQ
+7%
YoY
0%
QoQ
+9%
YoY
Note: % change in constant euros. Loans excluding reverse repos.
Excluding Santander Consumer UK profit, recorded in Santander UK results. Including it, Q1’18 attributable profit: EUR 351 mn (+3% vs. Q1’17 and +3% vs. Q4’17)
Business areas performance Q1’18
Volumes in EUR bn
(1) EUR mn and % change in constant euros
P&L1 Q1'18 %Q4'17 %Q1'17
NII 915 1.0 3.9
Fee income 215 5.3 -7.1
Gross income 1,140 0.7 2.8
Operating expenses -509 0.5 2.1
LLPs -120 > >
PBT 535 4.5 4.2
Attributable profit 323 3.8 4.0
KEY DATA Q1’17 Q1’18
ACTIVITY
Santander Consumer Finance
23. 23
3.01% 2.91% 2.83% 2.78% 2.81%
0.69% 0.66% 0.62% 0.63% 0.64%
Q1'17 Q2 Q3 Q4 Q1'18
Loyal customers (millions) 4.1 4.4
Digital customers (millions) 4.7 5.2
NPL ratio (%) 1.31 1.17
Cost of credit (%) 0.03 0.10
Efficiency ratio (%) 50.5 56.6
RoTE (%) 11.3 9.1
Cost of deposits
Yield on loans
In a competitive market, strong growth in mortgages with focus on retention
and service
Profit impacted by pressure on revenue, investments in technology and
regulatory projects, and provisions for single cases
Credit quality remains solid with a low cost of credit and NPL
QoQ: continued NII pressure from new asset margins and SVR compensated
by lower provisions
239
207
Loans Funds
0%
QoQ
+1%
YoY
-3%
QoQ
0%
YoY
Note: % change in constant euros. Loans excluding reverse repos. Funds: deposits excluding repos + marketed mutual funds
Business areas performance Q1’18
Volumes in EUR bn
(1) EUR mn and % change in constant euros
P&L1 Q1'18 %Q4'17 %Q1'17
NII 1,031 -2.0 -3.3
Fee income 242 -0.9 -1.8
Gross income 1,349 -0.1 -3.2
Operating expenses -764 5.5 8.4
LLPs -66 -18.6 >
PBT 457 2.9 -20.2
Attributable profit 320 6.8 -21.1
KEY DATA Q1’17 Q1’18
ACTIVITY
United Kingdom
24. 24
Significant investment in multichannel, digitalisation and commercial initiatives
Profit up driven by NII and fee income, resulting in a high RoTE (20%). Solid credit quality
Focus on customer satisfaction, loyalty and digital initiatives. Strong volume acceleration
Profit up driven by commercial revenues, cost control and lower cost of credit
EUR 175 mn; +14%
EUR 151 mn; +8%
Leading privately owned bank by loans and deposits. Of note were SMEs, consumer loans and strong
increase in mutual funds
Profit affected by Citibank integration costs and higher provisions (volume growth and 2017 releases)
EUR 66 mn; -11%
After Popular acquisition Santander Totta is the largest1 privately owned bank
The commercial transformation programme continues to boost loyal and digital customers
Profit impacted by ALCO sales in Q1’17 and higher tax rate. PBT: +10%
EUR 127 mn; +1%
Strong YoY credit growth across all segments and products accompanied by an increase in deposits
Focus on commercial revenue and cost control though profit affected by the timing change of BFG
payment to Q1
EUR 63 mn; +3%
Good performance: higher customer base, higher profits and better credit quality
Note: % change vs. Q1’17 in constant euros.
(1) In terms of domestic assets and loans
Business areas performance Q1’18
Attributable profit growth due to lower LLPs and cost control
Santander Bank: increasing profitability by improving NIM and efficiency ratio
SC USA: higher profitability due to better cost of credit and lower costs. Focus on improving cost of funding
EUR 125 mn; +52%
25. 25
EUR mn
Higher loss in NII YoY due to increased issuances (TLAC)
Lower cost of hedging reflected in gains on financial transactions
Operating expenses remained virtually unchanged as a result of
the streamlining and simplification measures
Q1’17 Q4’17 Q1’18
NII -194 -223 -224
Gains/Losses on FT -119 30 12
Operating expenses -119 -120 -121
Provisions -37 -51 -79
Tax and minority interests 29 32 6
Underlying attrib. Profit -468 -378 -421
Non-recurring1 0 -306 0
Attributable profit -468 -684 -421
Corporate Centre
(1) Q4’17 including goodwill and a positive impact of Allfunds gains.
Business areas performance Q1’18
P&L
30. 30
Loans and customer funds by units and businesses
Other countries results
Global business results
Liquidity
NPL and coverage ratios and cost of credit
Quarterly income statements
Appendix
31. 31
Individuals demand deposits, 37%
Individuals time deposits, 14%
Individuals mutual funds, 15%
Consumer, 4%
SMEs, 9%
Corporates, 12%
GCB, 9%
Overall increase in loans and customer funds, boosted by developing markets
and Banco Popular integration
Note: Loans excluding repos. Customer funds: deposits excluding repos + marketed mutual funds. % change in constant euros.
Spain and Portugal impacted by Banco Popular integration.
MATURE MARKETS
Mar-18 EUR bn YoY Chg.
Other individuals, 10%
Home mortgages, 36%
Consumer, 16%
SMEs, 11%
Corporates, 17%
GCB, 10%
Loan portfolio
by businesses
Customer funds
by businesses
Spain 217 44%
UK 239 1%
USA 72 -3%
SCF 92 7%
Portugal 37 30%
DEVELOPING MARKETS
Poland 23 5%
Brazil 74 11%
Mexico 29 8%
Chile 39 4%
Argentina 8 41%
Spain 313 38%
UK 207 0%
USA 59 -6%
SCF 37 4%
Portugal 37 19%
Poland 28 6%
Brazil 110 28%
Mexico 38 9%
Chile 34 3%
Argentina 13 41%
MATURE MARKETS DEVELOPING MARKETS
Mar-18 EUR bn YoY Chg. Mar-18 EUR bn YoY Chg. Mar-18 EUR bn YoY Chg.
Loan portfolio Customer funds
Appendix
32. 32
Loans and customer funds by units and businesses
Other countries results
Global business results
Liquidity
NPL and coverage ratios and cost of credit
Quarterly income statements
Appendix
33. 33
P&L1 Q1'18 %Q4'17 %Q1'17KEY DATA Q1’17 Q1’18
ACTIVITY
Mexico
(1) EUR mn and % change in constant euros
Loyal customers (thousands) 1,663 2,065
Digital customers (thousands) 1,528 2,061
NPL ratio (%) 2.77 2.68
Cost of credit (%) 2.94 2.95
Efficiency ratio (%) 38.8 40.9
RoTE (%) 18.8 19.6
Appendix
Significant investment in multichannel, digitalisation and commercial
initiatives
Efforts made to retain customers, attract payrolls (market share: +88 bps
YoY) and increase in digital customers (+35%)
Profit up due to strong NII and fee income, resulting in a high RoTE
Solid credit quality: flat NPL ratio, coverage ratio at 114% and cost of credit
around 3%
11.28% 11.79% 12.02% 12.02% 12.09%
2.67% 3.04% 3.37% 3.39% 3.48%
Q1'17 Q2 Q3 Q4 Q1'18
Cost of deposits
Yield on loans
29
38
Loans Funds
+1%
QoQ
+8%
YoY
+2%
QoQ
+9%
YoY
Volumes in EUR bn
NII 649 6.4 11.0
Fee income 187 7.1 11.0
Gross income 831 3.4 7.7
Operating expenses -340 1.9 13.6
LLPs -200 9.7 -8.4
PBT 288 8.6 15.0
Attributable profit 175 1.5 14.1
Note: % change in constant euros. Loans excluding reverse repos. Funds: deposits excluding repos + marketed mutual funds
34. 34
P&L1 Q1'18 %Q4'17 %Q1'17KEY DATA Q1’17 Q1’18
ACTIVITY
Santander is the largest privately owned bank in Chile by assets and
customers
Economy gaining momentum with growth forecast at 3.5% in 2018
Focus on customer satisfaction, loyalty and digital initiatives: Santander
Life well accepted and new WorkCafé Branch openings
Loan and fund growth accelerate QoQ
Profit up driven by commercial revenues, cost control and lower cost of credit
Chile
(1) EUR mn and % change in constant euros
Loyal customers (thousands) 609 635
Digital customers (thousands) 979 1,028
NPL ratio (%) 4.93 5.00
Cost of credit (%) 1.42 1.22
Efficiency ratio (%) 40.9 40.3
RoTE (%) 17.1 17.2
Appendix
7.53% 7.95% 7.33% 7.33% 7.52%
2.10% 1.94% 1.81% 1.87% 1.78%
Q1'17 Q2 Q3 Q4 Q1'18
Cost of deposits
Yield on loans39
34
Loans Funds
+3%
QoQ
+4%
YoY
+3%
QoQ
+3%
YoY
Volumes in EUR bn
NII 490 -1.1 7.1
Fee income 111 20.1 9.4
Gross income 640 0.8 5.2
Operating expenses -258 3.2 3.7
LLPs -121 9.7 5.6
PBT 282 1.8 14.5
Attributable profit 151 2.1 8.4
Note: % change in constant euros. Loans excluding reverse repos. Funds: deposits excluding repos + marketed mutual funds
35. 35
P&L1 Q1'18 %Q4'17 %Q1'17KEY DATA Q1’17 Q1’18
ACTIVITY
Portugal
(1) EUR mn
Loyal customers (thousands) 660 712
Digital customers (thousands) 524 653
NPL ratio (%) 8.47 8.29
Cost of credit (%) 0.07 0.08
Efficiency ratio (%) 47.2 46.4
RoTE (%) 15.3 12.7
Appendix
Figures include Popular in Q1’18 and in Q4’17, with Santander Totta being
the largest2 privately owned bank
Very dynamic activity, with market shares in new lending above 20% for
both corporates and mortgages
The digital transformation continues to enhance customer loyalty
Commercial revenue increased, continued cost control and low cost of
credit
Profit impacted by ALCO sales in Q1’17 and higher tax rate
1.97% 1.91% 1.86% 1.84% 1.86%
0.30% 0.25% 0.22% 0.19% 0.18%
Q1'17 Q2 Q3 Q4 Q1'18
Cost of deposits
Yield on loans
37 37
Loans Funds
+30%
YoY
+19%
YoY
0%
QoQ
+3%
QoQ
Volumes in EUR bn
NII 222 0.2 29.3
Fee income 98 6.3 9.4
Gross income 341 3.3 16.2
Operating expenses -158 -5.1 14.3
LLPs -8 - -
PBT 166 -0.8 10.2
Attributable profit 127 6.3 1.1
Note: Loans excluding reverse repos. Funds: deposits excluding repos + marketed mutual funds
(2) In terms of domestic assets and loans
36. 36
Attributable profit strong increase due to lower LLPs and cost control
Santander Bank: increasing profitability by improving NIM and efficiency ratio
SC USA: High profitability (RoTE: 13%) due to better cost of credit and lower
costs. Focus on improving cost of funding
Additionally, focussing on closing out regulatory issues and optimising
capital structure, through organic growth and dividend payments
P&L1 Q1'18 %Q4'172 %Q1'17KEY DATA Q1’17 Q1’18
ACTIVITY
United States
Loyal customers (thousands) 280 301
Digital customers (thousands) 801 805
NPL ratio (%) 2.43 2.86
Cost of credit (%) 3.63 3.29
Efficiency ratio (%) 44.6 46.6
RoTE (%) 2.8 3.9
Appendix
41
43
Loans Funds
Santander Bank
-2%
QoQ
-3%
YoY
+2%
QoQ
-6%
YoY
Santander Consumer USA
32
38
Loans Managed
assets
0%
QoQ
0%
YoY
0%
QoQ
3
Volumes in EUR bn
(1) EUR mn and % change in constant euros
(2) Q4’17 profit included EUR -76 mn related to hurricane provisions, SC USA settlement, tax
reform and other
NII 1,221 -0.1 -5.4
Fee income 214 0.3 -9.4
Gross income 1,578 3.0 -3.1
Operating expenses -735 -0.6 1.4
LLPs -579 -5.5 -17.5
PBT 241 59.4 39.7
Attributable profit 125 - 51.9
Note: % change in constant euros. Loans excluding reverse repos. Funds: deposits excluding repos + marketed mutual funds. Santander Bank’s customers
(3) Includes leasing
-4%
YoY
37. 37
P&L1 Q1'18 %Q4'17 %Q1'17KEY DATA Q1’17 Q1’18
ACTIVITY
Argentina
Loyal customers (thousands) 1,162 1,381
Digital customers (thousands) 1,600 2,029
NPL ratio (%) 1.82 2.54
Cost of credit (%) 1.68 2.06
Efficiency ratio (%) 54.5 57.9
RoTE (%) 36.8 28.4
Appendix
Santander is the leading privately owned bank in Argentina by loans and
deposits
Volume growth: of note were SMEs, consumer loans and strong increase
in mutual funds
Gross income increased spurred by larger volumes, margin management
and higher fee income
Profit affected by Citibank’s integration costs and higher provisions.
Coverage ratio at 121% (100% in Dec-17)
18.44% 17.77%
16.27%
17.76% 18.65%
4.72% 4.39% 4.36% 4.64% 5.25%
Q1'17 Q2 Q3 Q4 Q1'18
Cost of deposits
Yield on loans
8
13
Loans Funds
+11%
QoQ
+41%
YoY
+12%
QoQ
+41%
YoY
Volumes in EUR bn
NII 214 -1.8 39.6
Fee income 129 10.2 23.1
Gross income 377 0.2 34.8
Operating expenses -218 6.3 43.0
LLPs -49 44.5 >
PBT 92 -21.5 -14.4
Attributable profit 66 -17.9 -10.9
Note: % change in constant euros. Loans excluding reverse repos. Funds: deposits excluding repos + marketed mutual funds
Citibank volume included from Mar-17. Citibank results not included in Q1’17 (only from Q2’17)
(1) EUR mn and % change in constant euros
38. 38
23
28
Loans Funds
(1) EUR mn and % change in constant euros
Poland
Loyal customers (thousands) 1,327 1,712
Digital customers (thousands) 2,018 2,111
NPL ratio (%) 5.20 4.77
Cost of credit (%) 0.66 0.69
Efficiency ratio (%) 45.5 46.2
RoTE (%) 9.7 8.9
Appendix
4.06% 4.12% 4.14% 4.15% 4.18%
0.80% 0.81% 0.78% 0.72% 0.68%
Q1'17 Q2 Q3 Q4 Q1'18
Loan growth across all key segments and products
Deposit base increasing with significant growth in demand deposits
Strong credit quality in line with expectations: NPL ratio dropped and cost
of credit steady
Focus on commercial revenue and cost control
Profit and RoTE affected by the timing change of total Resolution Fund
payment to Q1 and lower trading gains
Cost of deposits
Yield on loans
+2%
QoQ
+5%
YoY
+2%
QoQ
+6%
YoY
Volumes in EUR bn
P&L1 Q1'18 %Q4'17 %Q1'17KEY DATA Q1’17 Q1’18
ACTIVITY
NII 247 0.0 9.7
Fee income 112 -4.5 8.0
Gross income 333 -13.1 0.3
Operating expenses -154 -4.9 1.9
LLPs -46 11.6 64.6
PBT 120 -25.5 -6.9
Attributable profit 63 -23.3 2.8
Note: % change in constant euros. Loans excluding reverse repos. Funds: deposits excluding repos + marketed mutual funds
39. 39
7
8
Q1'17 Q1'18
24
32
Q1'17 Q1'18
Focusing on loyalty, transactions and target segments
Uruguay’s profit driven by higher NII and fee income, with improved C/I
Peru’s profit driven by higher revenues
Other Latin American Countries
Appendix
Attributable profit
Constant EUR mn
+33% +9%
URUGUAY PERU
40. 40
Loans and customer funds by units and businesses
Other countries results
Global business results
Liquidity
NPL and coverage ratios and cost of credit
Quarterly income statements
Appendix
41. 41
Retail Banking
(1) EUR mn and % change in constant euros
(2) Q4’17 profit included EUR -57 mn related to hurricane provisions, SCUSA settlement and tax
reform in the USA
P&L1 Q1'18 %Q4'172 %Q1'17
NII 8,034 0.9 12.4
Fee income 2,284 -2.0 11.3
Gross income 10,671 1.7 11.5
Operating expenses -4,886 -2.1 12.8
LLPs -2,161 16.2 10.4
PBT 3,285 2.0 23.6
Attributable profit 1,931 2.7 21.8
ACTIVITY
747
704
Loans Funds
+15%
YoY
+16%
YoY
0%
QoQ
-1%
QoQ
Focused on three main priorities: customer loyalty, digital transformation and operational excellence
New commercial initiatives and launch of several offers across multi-channel model
Progress in achieving our targets. 18.8 million loyal customers (+22% from March-17) and 27.3 million digital customers (+24%
from March-17)
Profit boosted by perimeter effect after Popular acquisition and the strong performance in commercial revenues
Appendix
Volumes in EUR bn and % change in constant euros
42. 42
Global Corporate Banking
(1) EUR mn and % change in constant euros
P&L1 Q1'18 %Q4'17 %Q1'17
NII 551 -1.3 -4.9
Fee income 404 5.2 9.4
Gross income 1,332 11.3 -5.1
Operating expenses -527 1.6 14.3
LLPs -71 -65.5 -42.8
PBT 733 64.3 -9.2
Attributable profit 483 65.2 -9.1
415 412
318 321
497 500
173 100
1,403
1,332
Q1'17 Q1'18
-5%
-1%
0%
-42%
TOTAL
Global Transaction
Banking
Global Markets
Capital & Other
+1%
Customers
0%
Global Debt
Financing
Constant EUR mn
REVENUE
Higher revenue from international activity, benefiting from cross-border flows across our geographic footprint
Continued improvement in services to retail network customers, adapting our product offering to the Bank’s digital transformation
Attributable profit declined 9% YoY, due to strong gains on financial transactions Q1’17. Profit was 16% above 2017 quarterly average.
Improved quality of customer revenues, driven by value-added business and higher fee income that offset lower use of the balance
sheet.
Appendix
43. 43
(1) EUR mn and % change in constant euros
(2) Q4’17 profit included EUR -19 mn related to tax reform in the USA
P&L1 Q1'18 %Q4'172 %Q1'17
NII 100 3.9 9.8
Fee income 276 59.1 68.5
Gross income 379 27.2 38.9
Operating expenses -182 37.6 47.0
LLPs -5 -60.5 -18.6
PBT 191 26.3 35.3
Attributable profit 126 34.2 25.6
ACTIVITY
Wealth Management
New Global Division that includes the Private Banking and Santander Asset Management (SAM) businesses of the Group in more than 10
countries
Both businesses continue to be a reference in private banking and asset management in Spain and Latin America
Key initiatives: development of UHNW proposition, Private Banking digital platform, strengthening of the SAM product catalogue
Growth in volumes and revenues. Fee income growth driven by higher volumes and greater customer loyalty
Total contribution3 to the Group’s profit of 253 million (+16% over estimated Q1’17)
335
184 179
13
vs Q1’17 +4% +8% +2% +6%
Constant EUR bn
Wealth
Management
SAM Private
Banking
Customer
loans
Assets under management
Appendix
Note: Total assets marketed and/or managed in 2018 and 2017
(3) Profit after taxes + total fee income generated by this business.
44. 44
Loans and customer funds by units and businesses
Other countries results
Global business results
Liquidity
NPL and coverage ratios and cost of credit
Quarterly income statements
Appendix
45. 45
Mar-18
We made good headway YTD in our funding plan to enhance the Group’s TLAC
position and optimise its cost of capital
Comfortable liquidity position
(Group and subsidiaries)
Net loan-to-deposit ratio (LTD): 112%
Deposits + M/LT funding / net loans: 113%
Liquidity Coverage Ratio (LCR)1: 138%
Key liquidity ratios
(1) Provisional data
Appendix
Jan-Mar 18
Group issuances2 EUR 8bn (~EUR 6bn TLAC-eligible)
Main issuers Parent bank and UK
Main issuance currencies EUR, USD, GBP
Focus on TLAC-eligible instruments, following
our decentralised liquidity and funding model
Funding plan - issuances
(2) Parent Bank, UK, SCF and USA.
Excluding covered bonds and securitisations
46. 46
Loans and customer funds by units and businesses
Other countries results
Global business results
Liquidity
NPL and coverage ratios and cost of credit
Quarterly income statements
Appendix
47. 47
NPL ratio
%
Mar-17 Jun-17 Sep-17 Dec-17 Mar-18
Continental Europe 5.62 8.70 6.30 5.82 5.81
Spain 5.22 10.52 6.82 6.32 6.27
Santander Consumer Finance 2.62 2.61 2.60 2.50 2.48
Poland 5.20 4.66 4.70 4.57 4.77
Portugal 8.47 9.10 8.39 7.51 8.29
United Kingdom 1.31 1.23 1.32 1.33 1.17
Latin America 4.50 4.40 4.41 4.46 4.43
Brazil 5.36 5.36 5.32 5.29 5.26
Mexico 2.77 2.58 2.56 2.69 2.68
Chile 4.93 5.00 4.95 4.96 5.00
Argentina 1.82 2.21 2.34 2.50 2.54
USA 2.43 2.64 2.56 2.79 2.86
Operating Areas 3.77 5.40 4.27 4.10 4.04
Total Group 3.74 5.37 4.24 4.08 4.02
Appendix
48. 48
Coverage ratio
%
Mar-17 Jun-17 Sep-17 Dec-17 Mar-18
Continental Europe 60.6 59.7 53.7 54.4 56.8
Spain 49.1 56.6 46.2 46.8 51.1
Santander Consumer Finance 108.9 106.5 104.3 101.4 107.2
Poland 61.2 67.5 67.6 68.2 72.0
Portugal 61.7 55.6 56.1 62.1 53.9
United Kingdom 33.8 32.6 31.5 32.0 34.6
Latin America 90.5 89.2 90.1 85.0 98.4
Brazil 98.1 95.5 97.6 92.6 110.4
Mexico 104.8 113.8 110.3 97.5 113.5
Chile 58.9 58.2 58.5 58.2 61.0
Argentina 134.1 109.9 102.8 100.1 121.3
USA 202.4 183.1 187.5 170.2 169.1
Operating Areas 74.6 67.6 65.7 65.1 69.7
Total Group 74.6 67.7 65.8 65.2 70.0
Appendix
49. 49
Non-performing loans and loan-loss allowances. March 2018
Percentage over Group's total
(*) Excluding SCF UK
Spain, 31%
SCF*, 9%
Poland, 3%
Portugal,
7%
UK, 4%
Brazil, 18%
Mexico, 4%
Chile, 5%
Argentina, 1%
USA, 14%
Other, 4%
Spain, 42%
SCF*, 6%
Poland, 3%
Portugal,
9%
UK, 8%
Brazil, 12%
Mexico, 2%
Chile, 5%
Argentina, 1%
USA, 6%
Other, 6%
100%: EUR 37,408 million
Non-performing loans
100%: EUR 26,173 million
Loan-loss allowances
Appendix
50. 50
Cost of credit
%
Mar-17 Jun-17 Sep-17 Dec-17 Mar-18
Continental Europe 0.38 0.36 0.32 0.31 0.32
Spain 0.33 0.32 0.28 0.30 0.29
Santander Consumer Finance 0.39 0.37 0.34 0.30 0.36
Poland 0.66 0.65 0.61 0.62 0.69
Portugal 0.07 0.03 0.10 0.04 0.08
United Kingdom 0.03 0.02 0.03 0.08 0.10
Latin America 3.36 3.36 3.25 3.15 3.12
Brazil 4.84 4.79 4.55 4.36 4.35
Mexico 2.94 3.01 3.14 3.08 2.95
Chile 1.42 1.37 1.27 1.21 1.22
Argentina 1.68 1.75 1.85 1.85 2.06
USA 3.63 3.65 3.57 3.42 3.29
Operating Areas 1.18 1.18 1.12 1.07 1.03
Total Group 1.17 1.17 1.12 1.07 1.04
Appendix
51. 51
Loans and customer funds by units and businesses
Other countries results
Global business results
Liquidity
NPL and coverage ratios and cost of credit
Quarterly income statements
Appendix
52. 52
Grupo Santander
EUR million
Q1'17 Q2'17 Q3'17 Q4'17 Q1'18
NII + Fee income 11,246 11,522 11,569 11,556 11,408
Gross income 12,029 12,049 12,252 12,062 12,151
Operating expenses (5,543) (5,648) (5,766) (5,961) (5,764)
Net operating income 6,486 6,401 6,486 6,101 6,387
Net loan-loss provisions (2,400) (2,280) (2,250) (2,181) (2,282)
Other (775) (848) (645) (544) (416)
Underlying profit before taxes 3,311 3,273 3,591 3,375 3,689
Underlying consolidated profit 2,186 2,144 2,347 2,285 2,409
Underlying attributable profit 1,867 1,749 1,976 1,924 2,054
Net capital gains and provisions* — — (515) (382) —
Attributable profit 1,867 1,749 1,461 1,542 2,054
(*) Including: in 3Q17 charges for integration costs and equity stakes and intangible assets
in 4Q17 Allfunds capital gains, USA fiscal reform, goodwill charges and in the US, provisions for hurricanes, increased stake in
Santander Consumer USA and other
Appendix
53. 53
Grupo Santander
Constant EUR million
Q1'17 Q2'17 Q3'17 Q4'17 Q1'18
NII + Fee income 10,197 10,665 11,149 11,253 11,408
Gross income 10,903 11,146 11,816 11,750 12,151
Operating expenses (5,085) (5,268) (5,588) (5,819) (5,764)
Net operating income 5,818 5,878 6,228 5,931 6,387
Net loan-loss provisions (2,112) (2,068) (2,140) (2,110) (2,282)
Other (711) (789) (626) (534) (416)
Underlying profit before taxes 2,995 3,020 3,462 3,287 3,689
Underlying consolidated profit 1,974 1,968 2,266 2,228 2,409
Underlying attributable profit 1,680 1,598 1,907 1,873 2,054
Net capital gains and provisions* — — (515) (376) —
Attributable profit 1,680 1,598 1,392 1,497 2,054
(*) Including: in 3Q17 charges for integration costs and equity stakes and intangible assets
in 4Q17 Allfunds capital gains, USA fiscal reform, goodwill charges and in the US, provisions for hurricanes, increased stake in
Santander Consumer USA and other
Appendix
54. 54
Spain
EUR million
Q1'17 Q2'17 Q3'17 Q4'17 Q1'18
NII + Fee income 1,206 1,409 1,753 1,749 1,710
Gross income 1,539 1,475 2,011 1,835 2,063
Operating expenses (798) (893) (1,161) (1,188) (1,145)
Net operating income 741 582 850 647 918
Net loan-loss provisions (163) (144) (120) (175) (207)
Other (64) (64) (62) (25) (104)
Underlying profit before taxes 514 374 667 447 608
Underlying consolidated profit 367 267 489 333 455
Underlying attributable profit 362 262 484 330 455
Net capital gains and provisions — — (300) — —
Attributable profit 362 262 184 330 455
Appendix
55. 55(*) Including: in Q3’17 charges for integration costs
Santander Consumer Finance
EUR million
Q1'17 Q2'17 Q3'17 Q4'17 Q1'18
NII + Fee income 1,121 1,096 1,121 1,110 1,130
Gross income 1,118 1,099 1,135 1,132 1,140
Operating expenses (502) (485) (484) (506) (509)
Net operating income 616 614 650 625 631
Net loan-loss provisions (61) (57) (90) (58) (120)
Other (37) (35) (30) (55) 24
Underlying profit before taxes 518 522 531 512 535
Underlying consolidated profit 370 382 370 373 388
Underlying attributable profit 314 319 309 311 323
Net capital gains and provisions* — — (85) (0) —
Attributable profit 314 319 224 311 323
Appendix
56. 56
Santander Consumer Finance
Constant EUR million
Q1'17 Q2'17 Q3'17 Q4'17 Q1'18
NII + Fee income 1,111 1,092 1,118 1,110 1,130
Gross income 1,108 1,094 1,131 1,132 1,140
Operating expenses (498) (483) (483) (506) (509)
Net operating income 610 611 649 626 631
Net loan-loss provisions (60) (58) (89) (58) (120)
Other (37) (35) (30) (56) 24
Underlying profit before taxes 513 519 530 512 535
Underlying consolidated profit 366 379 369 373 388
Underlying attributable profit 310 317 308 311 323
Net capital gains and provisions* — — (85) (0) —
Attributable profit 310 317 223 311 323
(*) Including: in Q3’17 charges for integration costs
Appendix
57. 57
Poland
EUR million
Q1'17 Q2'17 Q3'17 Q4'17 Q1'18
NII + Fee income 318 343 350 360 359
Gross income 321 363 358 378 333
Operating expenses (146) (150) (149) (160) (154)
Net operating income 175 212 209 218 179
Net loan-loss provisions (27) (34) (36) (40) (46)
Other (23) (27) (28) (19) (13)
Underlying profit before taxes 125 152 144 159 120
Underlying consolidated profit 86 120 110 116 89
Underlying attributable profit 59 83 76 81 63
Net capital gains and provisions — — — — —
Attributable profit 59 83 76 81 63
Appendix
58. 58
Poland
PLN million
Q1'17 Q2'17 Q3'17 Q4'17 Q1'18
NII + Fee income 1,374 1,449 1,489 1,522 1,500
Gross income 1,386 1,532 1,525 1,599 1,390
Operating expenses (630) (634) (636) (675) (642)
Net operating income 756 898 889 924 748
Net loan-loss provisions (116) (142) (155) (171) (191)
Other (100) (112) (119) (78) (55)
Underlying profit before taxes 539 644 614 674 502
Underlying consolidated profit 372 506 470 492 373
Underlying attributable profit 257 351 324 344 264
Net capital gains and provisions — — — — —
Attributable profit 257 351 324 344 264
Appendix
59. 59
Portugal
EUR million
Q1'17 Q2'17 Q3'17 Q4'17 Q1'18
NII + Fee income 261 262 311 313 320
Gross income 294 275 345 330 341
Operating expenses (139) (142) (166) (167) (158)
Net operating income 155 133 179 163 183
Net loan-loss provisions 10 5 (37) 10 (8)
Other (14) (9) (16) (5) (9)
Underlying profit before taxes 151 129 126 168 166
Underlying consolidated profit 126 111 81 120 128
Underlying attributable profit 125 110 80 119 127
Net capital gains and provisions — — — — —
Attributable profit 125 110 80 119 127
Appendix
60. 60
United Kingdom
EUR million
Q1'17 Q2'17 Q3'17 Q4'17 Q1'18
NII + Fee income 1,349 1,409 1,317 1,291 1,274
Gross income 1,432 1,544 1,397 1,344 1,349
Operating expenses (723) (723) (694) (721) (764)
Net operating income 709 821 703 623 586
Net loan-loss provisions (15) (42) (66) (81) (66)
Other (105) (171) (89) (101) (62)
Underlying profit before taxes 588 608 547 441 457
Underlying consolidated profit 423 414 382 304 326
Underlying attributable profit 416 408 377 297 320
Net capital gains and provisions — — — — —
Attributable profit 416 408 377 297 320
Appendix
61. 61
United Kingdom
GBP million
Q1'17 Q2'17 Q3'17 Q4'17 Q1'18
NII + Fee income 1,160 1,213 1,183 1,146 1,125
Gross income 1,231 1,329 1,255 1,193 1,192
Operating expenses (622) (622) (623) (639) (675)
Net operating income 609 706 632 554 517
Net loan-loss provisions (13) (36) (59) (72) (58)
Other (90) (147) (81) (90) (55)
Underlying profit before taxes 506 524 492 392 404
Underlying consolidated profit 364 356 344 270 288
Underlying attributable profit 358 351 339 265 282
Net capital gains and provisions — — — — —
Attributable profit 358 351 339 265 282
Appendix
62. 62
Brazil
EUR million
Q1'17 Q2'17 Q3'17 Q4'17 Q1'18
NII + Fee income 3,455 3,413 3,392 3,458 3,403
Gross income 3,717 3,502 3,542 3,512 3,445
Operating expenses (1,314) (1,233) (1,244) (1,289) (1,165)
Net operating income 2,403 2,269 2,298 2,223 2,280
Net loan-loss provisions (910) (852) (819) (814) (822)
Other (358) (349) (268) (211) (154)
Underlying profit before taxes 1,135 1,068 1,211 1,198 1,304
Underlying consolidated profit 713 689 747 738 761
Underlying attributable profit 634 610 659 642 677
Net capital gains and provisions — — — — —
Attributable profit 634 610 659 642 677
Appendix
63. 63
Brazil
BRL million
Q1'17 Q2'17 Q3'17 Q4'17 Q1'18
NII + Fee income 11,561 12,036 12,567 13,139 13,568
Gross income 12,438 12,367 13,129 13,367 13,737
Operating expenses (4,397) (4,355) (4,613) (4,895) (4,644)
Net operating income 8,041 8,013 8,516 8,472 9,093
Net loan-loss provisions (3,045) (3,008) (3,045) (3,105) (3,276)
Other (1,198) (1,231) (1,007) (825) (615)
Underlying profit before taxes 3,798 3,773 4,464 4,543 5,202
Underlying consolidated profit 2,386 2,431 2,757 2,802 3,034
Underlying attributable profit 2,121 2,152 2,432 2,438 2,699
Net capital gains and provisions — — — — —
Attributable profit 2,121 2,152 2,432 2,438 2,699
Appendix
64. 64
Mexico
EUR million
Q1'17 Q2'17 Q3'17 Q4'17 Q1'18
NII + Fee income 804 856 879 811 836
Gross income 824 914 892 830 831
Operating expenses (319) (361) (356) (345) (340)
Net operating income 505 553 536 485 491
Net loan-loss provisions (233) (246) (240) (187) (200)
Other (4) (6) (4) (24) (3)
Underlying profit before taxes 267 301 292 274 288
Underlying consolidated profit 211 238 231 225 225
Underlying attributable profit 163 187 182 178 175
Net capital gains and provisions — — — — —
Attributable profit 163 187 182 178 175
Appendix
65. 65
Mexico
MXN million
Q1'17 Q2'17 Q3'17 Q4'17 Q1'18
NII + Fee income 17,348 17,505 18,399 18,076 19,257
Gross income 17,779 18,706 18,677 18,508 19,143
Operating expenses (6,894) (7,386) (7,460) (7,683) (7,832)
Net operating income 10,886 11,320 11,218 10,825 11,310
Net loan-loss provisions (5,032) (5,019) (5,015) (4,201) (4,610)
Other (90) (131) (89) (522) (72)
Underlying profit before taxes 5,764 6,170 6,113 6,102 6,628
Underlying consolidated profit 4,548 4,865 4,841 4,996 5,181
Underlying attributable profit 3,523 3,829 3,808 3,963 4,021
Net capital gains and provisions — — — — —
Attributable profit 3,523 3,829 3,808 3,963 4,021
Appendix
66. 66
Chile
EUR million
Q1'17 Q2'17 Q3'17 Q4'17 Q1'18
NII + Fee income 592 589 534 583 601
Gross income 645 644 604 630 640
Operating expenses (264) (260) (253) (248) (258)
Net operating income 381 383 351 382 382
Net loan-loss provisions (122) (122) (108) (110) (121)
Other 2 7 11 3 22
Underlying profit before taxes 261 267 255 276 282
Underlying consolidated profit 214 218 209 218 223
Underlying attributable profit 147 149 143 146 151
Net capital gains and provisions — — — — —
Attributable profit 147 149 143 146 151
Appendix
67. 67
Chile
CLP billion
Q1'17 Q2'17 Q3'17 Q4'17 Q1'18
NII + Fee income 413,110 430,039 403,461 434,470 444,260
Gross income 450,136 469,704 456,238 469,635 473,564
Operating expenses (184,039) (189,977) (191,129) (184,867) (190,863)
Net operating income 266,097 279,727 265,110 284,768 282,700
Net loan-loss provisions (85,110) (89,381) (81,474) (81,875) (89,852)
Other 1,438 4,750 8,384 2,363 16,034
Underlying profit before taxes 182,425 195,096 192,020 205,256 208,882
Underlying consolidated profit 149,458 158,760 157,744 162,572 164,822
Underlying attributable profit 102,796 108,904 107,839 109,081 111,380
Net capital gains and provisions — — — — —
Attributable profit 102,796 108,904 107,839 109,081 111,380
Appendix
68. 68
Argentina
EUR million
Q1'17 Q2'17 Q3'17 Q4'17 Q1'18
NII + Fee income 374 428 382 398 343
Gross income 405 470 423 449 377
Operating expenses (221) (269) (235) (244) (218)
Net operating income 184 201 187 205 159
Net loan-loss provisions (29) (42) (46) (41) (49)
Other 1 (35) (35) (23) (17)
Underlying profit before taxes 156 123 106 141 92
Underlying consolidated profit 108 86 71 97 67
Underlying attributable profit 108 85 70 96 66
Net capital gains and provisions — — — — —
Attributable profit 108 85 70 96 66
Appendix
69. 69
Argentina
ARS billion
Q1'17 Q2'17 Q3'17 Q4'17 Q1'18
NII + Fee income 6,241 7,378 7,644 8,101 8,293
Gross income 6,764 8,104 8,460 9,103 9,117
Operating expenses (3,690) (4,640) (4,713) (4,964) (5,278)
Net operating income 3,074 3,464 3,747 4,139 3,840
Net loan-loss provisions (486) (730) (903) (828) (1,196)
Other 17 (596) (659) (466) (411)
Underlying profit before taxes 2,606 2,138 2,185 2,845 2,232
Underlying consolidated profit 1,807 1,486 1,462 1,960 1,610
Underlying attributable profit 1,795 1,477 1,453 1,948 1,599
Net capital gains and provisions — — — — —
Attributable profit 1,795 1,477 1,453 1,948 1,599
Appendix
70. 70
United States
EUR million
Q1'17 Q2'17 Q3'17 Q4'17 Q1'18
NII + Fee income 1,763 1,738 1,545 1,495 1,435
Gross income 1,879 1,880 1,604 1,596 1,578
Operating expenses (837) (845) (743) (773) (735)
Net operating income 1,042 1,035 861 824 843
Net loan-loss provisions (811) (697) (634) (638) (579)
Other (32) (24) (2) (31) (23)
Underlying profit before taxes 199 314 225 155 241
Underlying consolidated profit 138 235 154 109 174
Underlying attributable profit 95 149 93 71 125
Net capital gains and provisions* — — — (76) —
Attributable profit 95 149 93 (5) 125
(*) Including: in Q4’17 fiscal reform, provisions for hurricanes, increased stake in Santander Consumer USA and other
Appendix
71. 71
United States
USD million
Q1'17 Q2'17 Q3'17 Q4'17 Q1'18
NII + Fee income 1,877 1,912 1,820 1,765 1,764
Gross income 2,001 2,068 1,893 1,884 1,940
Operating expenses (891) (929) (875) (909) (904)
Net operating income 1,109 1,138 1,018 975 1,036
Net loan-loss provisions (863) (768) (749) (753) (712)
Other (34) (27) (4) (36) (28)
Underlying profit before taxes 212 343 265 186 296
Underlying consolidated profit 147 257 182 132 214
Underlying attributable profit 101 163 111 85 154
Net capital gains and provisions* — — — (85) —
Attributable profit 101 163 111 (0) 154
(*) Including: in Q4’17 fiscal reform, provisions for hurricanes, increased stake in Santander Consumer USA and other
Appendix
72. 72
Corporate Centre
EUR million
Q1'17 Q2'17 Q3'17 Q4'17 Q1'18
NII + Fee income (198) (223) (227) (240) (233)
Gross income (341) (340) (300) (238) (227)
Operating expenses (119) (118) (118) (120) (121)
Net operating income (460) (458) (419) (359) (348)
Net loan-loss provisions (5) (11) (22) (8) (37)
Other (32) (53) (54) (43) (43)
Underlying profit before taxes (497) (522) (495) (410) (427)
Underlying consolidated profit (471) (561) (481) (378) (421)
Underlying attributable profit (468) (563) (480) (378) (421)
Net capital gains and provisions* — — (130) (306) —
Attributable profit (468) (563) (610) (684) (421)
(*) Including: in Q3’17 equity stakes and intangible assets
in Q4’17 goodwill charges
Appendix
74. 74
Glossary - Acronyms
AFS: Available for sale
Bn: Billion
CET1: Common equity tier 1
C&I: Commercial and Industrial
DGF: Deposit guarantee fund
FL: Fully-loaded
EPS: Earning per share
LTV: Loan to Value
LLPs: Loan-loss provisions
MXN: Mexican Pesos
NII: Net interest income
NIM: Net interest margin
NPL: Non-performing loans
n.m.: Non meaningful
PBT: Profit before tax
P&L: Profit and loss
RoRWA: Return on risk-weighted assets
RWA: Risk-weighted assets
RoTE: Return on tangible equity
SCF: Santander Consumer Finance
SC USA: Santander Consumer USA
SGCB: Santander Global Corporate Banking
SMEs: Small and Medium Enterprises
SRF: Single Resolution Fund
ST: Short term
SVR: Standard variable rate
TNAV: Tangible net asset value
UF: Unidad de fomento (Chile)
y-o-y: Year on Year
UK: United Kingdom
US: United States
75. 75
Glossary – definitions
PROFITABILITY AND EFFICIENCY
RoTE: Return on tangible capital: Group attributable profit / average of: net equity (excluding minority interests) – intangible assets (including goodwill)
RoRWA: Return on risk-weighted assets: consolidated profit / average risk-weighted assets
Efficiency: Operating expenses / gross income. Operating expenses defined as general administrative expenses + amortisations
CREDIT RISK
NPL ratio: Non-performing loans and customer advances, customer guarantees and contingent liabilities / total risk. Total risk is defined as: normal and
non-performing balances of customer loans and advances, customer guarantees and contingent liabilities
NPL coverage ratio: Provisions to cover losses due to impairment of customer loans and advances, customer guarantees and contingent liabilities /
non-performing balances of customer loans and advances, customer guarantees and contingent liabilities
Cost of credit: Provisions to cover losses due to impairment of loans in the last 12 months / average customer loans and advances of the last 12 months
CAPITALISATION
Tangible net asset value per share – TNAV: Tangible stockholders' equity / number of shares (excluding treasury shares). Tangible stockholders'
equity calculated as shareholders equity + accumulated other comprehensive income - intangible assets
Notes: 1) The averages for the RoTE and RoRWA denominators are calculated on the basis of four months from December to March.
2) For periods of less than a year, and in the event of non-recurring results existing, the profit used to calculate the RoTE is the annualised underlying attributable profit (excluding non-recurring results), to
which are added non-recurring results without annualising them.
3) For periods of less than a year, and in the event of non-recurring results existing, the profit used to calculate the RoRWA is the consolidated annualised result (excluding non-recurring results), to which
is added non-recurring results without annualising them.
4) The risk-weighted assets included in the RoRWA denominator are calculated in accordance with the criteria defined by the Capital Requirements Regulation (CRR).
76. Thank you
Our purpose is to help people
and business prosper
Our culture is based on believing
that everything we do should be